
Data Center Cable Management Market Size, Share & Forecast to 2035
Market at a glance
The Data Center Cable Management market was worth USD 556.2 million in 2025 and is forecast to reach USD 1,570.0 million by 2035, growing at a 10.92% CAGR.
 By Amit Jain, Senior Consultant, ICT & Emerging Technologies
 Reviewed by Deepti Agrawal
Last updated 20 Oct 2026
Base year 2025 PDF + Excel
What is inside the report
- 01Introduction
- 02Executive Summary
- 03Market Scope
- 04Market Drivers
- 05Market Trends
- 06Market Challenges
- 07Market Opportunities
- 08Pricing
- 09Standards and Regulation
- 10Market Segmentation
- 18chapters
- 2020-2024Historical period
- 2026-2035Forecast period
- —Companies profiled
Segmentation
Full analysis
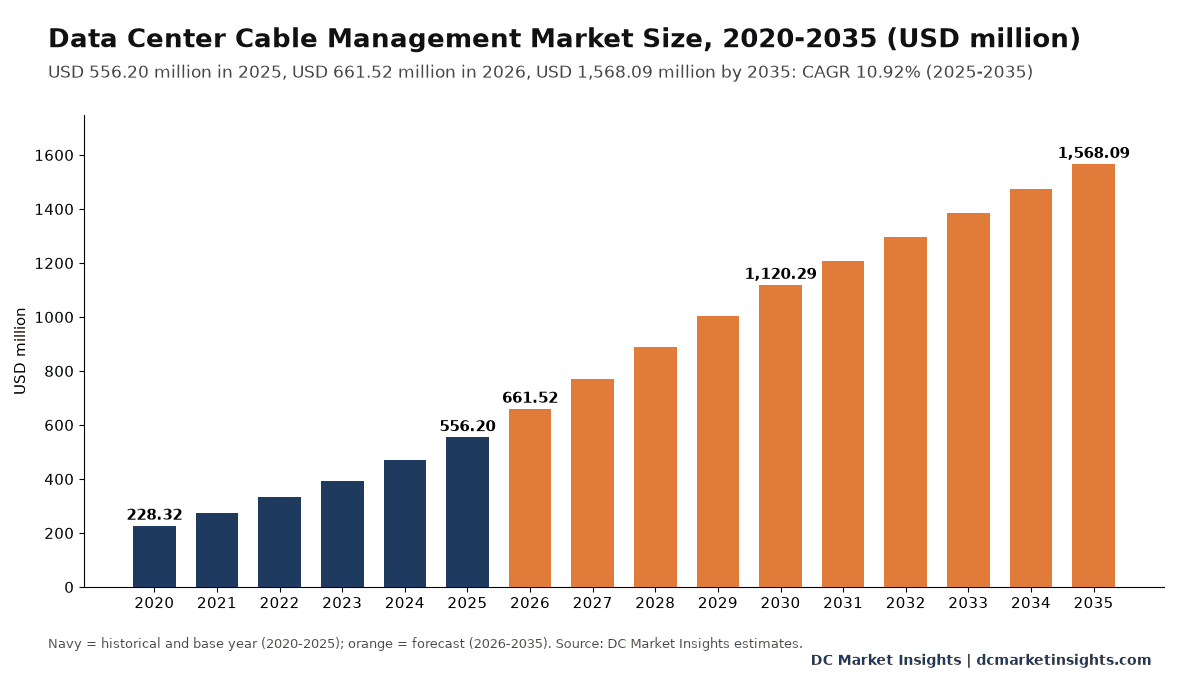
The Data Center Cable Management Market is valued at USD 661.52 million in 2026 and is projected to reach USD 1.57 billion by 2035, up from USD 556.20 million in 2025, a CAGR of 10.92% from 2025 to 2035 (DC Market Insights estimate). What moves this money is fibre count, not floor area: according to Corning, an optical fibre maker, generative artificial intelligence (AI) data centers need more than 10 times the optical fibre of traditional networks, and every extra trunk has to ride in an overhead raceway, a wire mesh tray or a vertical manager beside the rack. Steel did the rest: according to the US Bureau of Labor Statistics (BLS), its producer price index for fabricated structural metal rose 80% between January 2020 and December 2025, so the pathway kit for one new megawatt (MW) of IT load climbed from USD 22,800 to USD 31,850 even though denser racks need fewer metres of tray per MW. In 2025 the 12.0 GW of new IT capacity bought USD 382.20 million of trays, raceways, managers and accessories, and the 116 GW installed base spent USD 174.00 million on moves, additions, changes and refresh. Overhead fiber raceways and ducts are the fastest product type at 14.57% a year, and the Middle East and Africa is the fastest region at 15.86% a year as Saudi Arabia builds AI campuses from bare land.
Key Market Statistics: How Big Is the Data Center Cable Management Market in 2026?
DC Market Insights values the Data Center Cable Management Market at USD 661.52 million in 2026, 18.94% above the USD 556.20 million of 2025.
- Market size 2025: USD 556.20 million; 2026: USD 661.52 million; 2030: USD 1.12 billion; 2035: USD 1.57 billion.
- CAGR 2025-2035: 10.92% in the base case; the 2035 range runs from USD 1.32 billion (low, 9.00%) to USD 1.83 billion (high, 12.68%).
- New-build spend: USD 382.20 million in 2025 (68.7%); installed-base moves, additions, changes and refresh: USD 174.00 million (31.3%).
- Pathway content per new MW: USD 31,850 in 2025, rising to USD 36,200 in 2030 as AI halls take 60% of new capacity.
- Largest product type: cable trays (wire mesh, ladder and solid-bottom), USD 228.05 million or 41.0% of 2025; fastest: overhead fiber raceways and ducts, 14.57% a year.
- Fiber optic cable pathways grow from USD 211.36 million to USD 784.05 million, from 38.0% to 50% of the market.
- Leading region: North America, USD 233.61 million (42.0%) in 2025; fastest region: Middle East and Africa, 15.86% a year.
- Largest country: United States, USD 216.92 million in 2025; fastest large country: India, 18.38% a year.
- Five suppliers (Legrand, Panduit, nVent, Eaton and ABB) hold about 42% of 2025 spend, a DC Market Insights estimate.
How Fast Has Data Center Cable Management Spending Grown Since 2020?
The Global Data Center Cable Management Market size was valued at USD 228.32 million in 2020, reached USD 556.20 million in 2025, and is anticipated to reach USD 1.57 billion by 2035, at a CAGR of 10.92% during the forecast period.
| Attribute | Details |
|---|---|
| Historical period | 2020-2024 |
| Base year | 2025 |
| Forecast period | 2026-2035 |
| Market size 2025 | USD 556.20 million |
| Market size 2026 | USD 661.52 million |
| CAGR 2025-2035 | 10.92% |
| Market size 2035 | USD 1.57 billion |
Spending rose 2.44 times between 2020 and 2025, a rate of 19.49% a year, because new capacity doubled from 6.0 GW to 12.0 GW a year and the content per new MW rose 39.7% on steel prices and fibre counts. From 2026 the rate eases to 10.92% a year: new capacity keeps rising to 27.0 GW in 2035, but content per MW gains only 19.1% over the decade, to USD 37,920, as the AI share of new capacity levels off near 66%. Installed-base spend grows faster than new build, from USD 174.00 million to USD 544.25 million, because every AI refresh re-cables the hall. DC Market Insights expects the market to pass USD 1 billion for the first time in 2029.
What Counts as Data Center Cable Management?
The Data Center Cable Management Market covers USD 556.20 million of 2025 spend on the hardware that carries, separates and organises power, copper and fibre cables inside data center buildings, bought by owners, operators and their electrical and network contractors.
Included
- Cable trays: wire mesh (basket), ladder and solid-bottom trays, with their splices, brackets and threaded-rod supports.
- Overhead fiber raceways and ducts: channels, spillouts, junctions and covers that carry fibre trunks above the racks.
- Rack and cabinet cable managers: vertical and horizontal managers, finger ducts, slack spools and rear cable bars.
- Underfloor trays and pathways installed below raised floors.
- Cable ties, hook-and-loop straps, labels, identification sleeves and grounding kits sold for the pathway.
Excluded
- The cables themselves: power and copper cable, sized in the Data Center Cables Market report, and optical fibre, covered in the Data Center Fiber Optic Cabling Connectivity Market report.
- Racks and cabinets, busway and hot or cold aisle enclosures; containment hardware is sized in the Data Center Containment Market report.
- Installation labour, conduit buried in the slab, cable glands and outdoor duct banks.
How Do the Cable Management Segments Fit Together?
Each new MW is fitted once with trays, raceways and managers (new-build spend of USD 382.20 million in 2025, concentrated in hyperscale and AI sites), then pays about USD 1,500 a year for moves, additions, changes and refresh across its life (USD 174.00 million across 116 GW). The product type, cable type served and data center type splits each divide the same USD 556.20 million total.
Why Do Data Center Cable Management Market Estimates Differ?
DC Market Insights puts the data center cable management market at USD 661.52 million in 2026; figures several times larger usually count a wider cable management market or the cables in the tray.
Three definitions inflate published numbers. The first is the whole cable management industry: conduit, cable glands, trunking and floor boxes sold to homes, offices, factories and utilities, of which data centers are a small slice. The second adds structured cabling, patch cords and fibre cable for power cable applications and network links, plus advanced fiber termination tools and Ethernet test equipment, which cost far more per MW than the pathway that carries them. The third adds installation labour, which can match the hardware value on a hyperscale site. DC Market Insights counts only pathway hardware bought for data centers, from small edge rooms and enterprise server rooms run by SMEs (small and medium-sized enterprises) to hyperscale campuses.
| Element | In this report | Why |
|---|---|---|
| Trays, raceways, managers, ties and labels for data centers | Yes, USD 556.20 million (2025) | Core pathway hardware |
| Conduit, cable glands and trunking in other buildings | No | Not bought for data centers |
| Power, copper and fibre cable | No | Separate cable markets |
| Installation labour | No | Service cost, not product |
| Moves, additions, changes and refresh hardware | Yes, USD 174.00 million (2025) | Recurring spend on the installed base |
Why Are Data Centers Spending More on Cable Pathways?
Three forces lifted data center cable management content per new MW from USD 22,800 in 2020 to USD 31,850 in 2025: AI fibre counts, steel and wiring-device prices, and supplier capacity built for data centers.
AI Back-End Networks Multiply Fibre Trunks Tenfold
According to Corning, generative AI data centers need more than 10 times the optical fibre of traditional networks because each graphics processing unit (GPU) cluster adds a back-end network. On 6 May 2026, NVIDIA and Corning announced that Corning will raise its US optical connectivity manufacturing capacity 10 times and its US fibre capacity by more than 50% (Source: NVIDIA, 6 May 2026). Corning reported that its Optical Communications sales rose 35% to USD 6.27 billion in 2025 (Source: Corning, 28 January 2026). DC Market Insights models fiber optic cable pathways rising from USD 211.36 million to USD 784.05 million, a rate of 14.01% a year.
BLS Price Indexes: Structural Metal Up 80%, Wiring Devices Up 61%
The BLS producer price index for fabricated structural metal manufacturing rose from 162.4 in January 2020 to 291.843 in December 2025, and the index for wiring device manufacturing, which includes raceway and boxes, rose from 162.0 to 261.596 over the same period (Source: BLS, series PCU332312332312 and PCU3359333593). Trays and supports are mostly pre-galvanised or electro-zinc steel, so DC Market Insights raises the air-cooled hall content from USD 22,000 per MW in 2020 to USD 28,000 in 2025, a 27% increase that stays below the index because racks of 30 kW to 130 kW need fewer tray metres per MW than racks of 8 kW.
Legrand and nVent Build Data Center Capacity
Legrand, owner of the Cablofil wire mesh tray brand, reported data center sales of EUR 2.4 billion in 2025, 26% of group sales, against EUR 0.7 billion in 2020 (Source: Legrand, 12 February 2026), and data centers reached 32% of group revenue in the first half of 2026. nVent, owner of the CADDY support brand, grew 2025 sales 30% to USD 3.9 billion, led by data centers and power utilities (Source: nVent, 6 February 2026). Supplier capacity shortens tray lead times, which lets operators fit full overhead pathways rather than phase them in.
How Is Data Center Cable Routing Changing?
Data center cable management is moving overhead and getting denser: underfloor trays fall from 7.0% of spend in 2025 to 4% in 2035, while overhead fiber raceways rise from 17.0% to 23.5%.
Slab Floors Push Wire Mesh Tray Overhead
Liquid-cooled AI halls are built on concrete slabs to carry racks above 1,500 kg, so cables run overhead. Legrand presents wire mesh as the preferred data center tray (Source: Legrand). DC Market Insights values cable trays (wire mesh, ladder and solid-bottom) at USD 228.05 million in 2025 and USD 603.72 million in 2035. Underfloor trays and pathways grow 4.88% a year.
Very-Small-Form-Factor Connectors Change Raceway Fill
Panduit was certified in July 2025 to sell MMC very-small-form-factor fibre connectors, which it says address the fibre density of AI and hyperscale data centers (Source: Panduit, 15 July 2025). Denser connectors put more fibres in each trunk, which raises raceway fill per rack and favours wider channels; DC Market Insights expects raceways and ducts to reach USD 368.50 million by 2035.
Power Pods Bring Factory-Built Pathways
Legrand bought Girtz Industries, a US maker of modular power pods with about USD 80 million of sales, in June 2026, mainly for data centers (Source: Legrand, 29 July 2026). Prefabricated pods arrive with trays and supports fitted, which moves part of the USD 211.35 million power cable pathway spend from site contractors to factories.
What Holds Back Data Center Cable Management Spending?
Two problems cap data center cable management growth at 10.92% a year: volatile steel prices and the fight for overhead space with liquid-cooling pipework.
Steel Price Swings Upset Fixed-Price Bids
The BLS structural metal index peaked at 276.465 in June 2022, fell to 264.043 by December 2024 and rose again to 291.843 in December 2025. Contractors who price trays at bid stage carry that 10% swing, and aluminum commodity prices move aluminium ladder tray quotes the same way, which is why DC Market Insights holds the 2030 to 2035 content increase to USD 1,000 per MW for air-cooled halls.
Coolant Pipes Compete for Ceiling Space
The AI share of new capacity rises from 35% in 2025 to 66% in 2035, and every liquid-cooled row needs supply and return pipework above or beside the rack. Designers keep water away from power trays, which limits tray stacking to two or three tiers; DC Market Insights therefore sets AI hall content at USD 39,000 per MW in 2025, only 39% above air-cooled halls although fibre counts are far higher.
Where Will New Cable Management Revenue Come From by 2035?
The two largest new data center cable management revenue pools are refresh work in existing halls, worth USD 370.25 million more a year by 2035, and AI campuses in India and Saudi Arabia.
Refresh of Existing Halls: USD 174.00 million to USD 544.25 million
Installed-base spend grows from USD 174.00 million in 2025 to USD 544.25 million in 2035 as the installed base rises from 116 GW to 311 GW and the spend per MW rises from USD 1,500 to USD 1,750 a year. Retrofitting legacy facilities is the main job: colocation operators that turn air-cooled halls into AI suites, and owners of older enterprise campuses, replace underfloor trays with overhead raceway, which suits suppliers with retrofit kits that install without a shutdown.
India and Saudi Arabia Grow Fastest
India’s data center capacity rose from about 375 MW in 2020 to about 1,500 MW in 2025 (Source: Press Information Bureau, 13 March 2026), and DC Market Insights models India’s cable management spend rising from USD 13.35 million to USD 72.13 million, 18.38% a year. Saudi Arabia grows from USD 8.34 million to USD 47.04 million, 18.89% a year, because its AI campuses are built new rather than retrofitted.
How Much Does Data Center Cable Management Cost per MW?
A new MW carried USD 31,850 of data center cable management hardware in 2025, USD 28,000 in an air-cooled hall and USD 39,000 in a liquid-cooled AI hall, plus about USD 1,500 a year for refresh (DC Market Insights estimates).
| Year | AI share of new capacity | Air-cooled hall (USD per MW) | AI hall (USD per MW) | Weighted content per new MW (USD) | Yearly spend per installed MW (USD) |
|---|---|---|---|---|---|
| 2020 | 10% | 22,000 | 30,000 | 22,800 | 1,300 |
| 2025 | 35% | 28,000 | 39,000 | 31,850 | 1,500 |
| 2030 | 60% | 29,000 | 41,000 | 36,200 | 1,650 |
| 2035 | 66% | 30,000 | 42,000 | 37,920 | 1,750 |
Public price anchors are thin because most tray is sold through electrical distributors on project quotes. L-com lists a 20-inch by 6-inch wire mesh tray in 10-foot lengths at roughly USD 21 to USD 23 per foot on its own web store in October 2026; at 40 to 60 metres of overhead tray per MW in an air-cooled hall, tray sections alone account for USD 2,800 to USD 4,500 of the USD 28,000, with supports, raceway, managers, ties and labels making up the rest.
Which Standards Govern Data Center Cable Pathways?
Seven standards set how data center cable management pathways are designed and tested in 2026, and they apply to the sites behind most of the USD 661.52 million spend.
- ANSI/TIA-942-C (Telecommunications Industry Association), published in May 2024, adds new cabling requirements, floor loading capacity and minimum cabinet width for hyperscale, colocation and enterprise sites.
- ANSI/TIA-569-E (May 2019, addendum E-1 in July 2022) sets requirements for telecommunications pathways and spaces.
- ANSI/BICSI 002-2024 is the current data center design standard of the Building Industry Consulting Service International (BICSI).
- NFPA 70, the US National Electrical Code (NEC) 2026 edition from the National Fire Protection Association, keeps cable trays in Article 392.
- IEC 61537:2023 (International Electrotechnical Commission), edition 3.0 of 24 January 2023, revises corrosion classes and safe working load tests and adds an annex on trays used as a protective earth conductor.
- NEMA VE 1-2017 (National Electrical Manufacturers Association) covers metal cable tray systems, harmonised with CSA C22.2 No. 126.1-17; NEMA VE 2-2013 guides installation.
- EN 50174-2:2018 covers installation planning of copper and fibre cabling inside buildings, including separation from power cabling.
In the European Union, Commission Delegated Regulation (EU) 2026/331 of 13 February 2026 keeps the reaction-to-fire classes for cables under the new Construction Products Regulation (EU) 2024/3110, so tray layouts in European halls still have to suit the cable class chosen for each run.
Which Data Center Cable Management Segment Earns the Most?
In data center cable management, cable trays earn the most at USD 228.05 million in 2025, but overhead fiber raceways and ducts grow fastest at 14.57% a year.
By Product Type
| Product Type | 2025 (USD million) | Share 2025 | 2035 (USD million) | CAGR 2025-2035 |
|---|---|---|---|---|
| Cable Trays (Wire Mesh Ladder and Solid-Bottom) | 228.05 | 41.0% | 603.72 | 10.23% |
| Overhead Fiber Raceways and Ducts | 94.55 | 17.0% | 368.50 | 14.57% |
| Rack and Cabinet Cable Managers | 122.36 | 22.0% | 313.62 | 9.87% |
| Underfloor Trays and Pathways | 38.93 | 7.0% | 62.72 | 4.88% |
| Cable Ties Labels and Accessories | 72.31 | 13.0% | 219.53 | 11.75% |
Trays stay the largest product because every power and fibre run needs one, while cable ties, labels and accessories grow 11.75% a year as fibre counts multiply the number of bundles to tie and label.
By Cable Type Served
| Cable Type Served | 2025 (USD million) | Share 2025 | 2035 (USD million) | CAGR 2025-2035 |
|---|---|---|---|---|
| Power Cable Pathways | 211.35 | 38.0% | 548.83 | 10.01% |
| Copper Data Cable Pathways | 133.49 | 24.0% | 235.21 | 5.83% |
| Fiber Optic Cable Pathways | 211.36 | 38.0% | 784.05 | 14.01% |
Copper data cable pathways grow only 5.83% a year because AI back-end networks run on fibre; fibre pathways reach half of the market by 2035.
By Data Center Type
| Data Center Type | 2025 (USD million) | Share 2025 | 2035 (USD million) | CAGR 2025-2035 |
|---|---|---|---|---|
| Hyperscale and AI | 228.04 | 41.0% | 815.40 | 13.59% |
| Colocation | 183.55 | 33.0% | 470.43 | 9.87% |
| Enterprise | 111.24 | 20.0% | 188.17 | 5.40% |
| Edge | 33.37 | 6.0% | 94.09 | 10.92% |
Hyperscale and AI sites rise from 41.0% to 52% of spend, while enterprise server rooms grow 5.40% a year as workloads move to colocation and cloud.
DC Exclusive: Data Center Cable Pathway Supplier Map, 9 Suppliers Holding 54% of 2025 Spend
DC Market Insights mapped nine data center cable management suppliers to the pathway lines they sell and estimated their share of the USD 556.20 million spent in 2025; this is a DC Market Insights model built from 12 inputs (company product ranges, data center sales disclosures and the segment model), not reported revenue.
| Supplier | Data center pathway lines | Strongest product type | Estimated share 2025 | Estimated 2025 (USD million) |
|---|---|---|---|---|
| Legrand | Cablofil wire mesh tray, ladder tray, cable bus | Cable trays | 13% | 72.31 |
| Panduit | FiberRunner overhead raceway, vertical and horizontal managers, ties and labels | Overhead fiber raceways | 12% | 66.74 |
| nVent | CADDY supports and fixings, ERICO, HOFFMAN enclosures | Supports and accessories | 7% | 38.93 |
| Eaton | B-Line cable tray and support systems | Cable trays | 6% | 33.37 |
| ABB | Thomas and Betts cable tray, Ty-Rap cable ties | Ties and accessories | 4% | 22.25 |
| Chatsworth Products | Vertical cable managers, overhead runway, cabinet cable management | Rack and cabinet managers | 4% | 22.25 |
| Atkore | Unistrut framing and cable management | Supports and framing | 3% | 16.69 |
| Amphenol (CommScope CCS) | FiberGuide overhead fiber raceway | Overhead fiber raceways | 3% | 16.69 |
| HellermannTyton | Cable ties, labels and RapidNet pre-terminated pathways | Ties and accessories | 2% | 11.12 |
| Others (regional tray makers, rack vendors, distributors’ own brands) | Trays, managers and accessories | Mixed | 46% | 255.85 |
The map shows two kinds of leader. Tray specialists (Legrand, Eaton, ABB and Atkore) win the USD 228.05 million cable tray segment through electrical contractors, while network-side suppliers (Panduit, Chatsworth Products and Amphenol, which bought CommScope’s Connectivity and Cable Solutions business) win the USD 94.55 million overhead raceway segment through network installers. Buyers that split tray and raceway between the two channels should check that brackets from one supplier carry raceway from the other, because mixed systems are where most site rework starts.
Which Region Spends the Most on Data Center Cable Management?
North America spends the most on data center cable management at USD 233.61 million in 2025, 42.0% of the market, while the Middle East and Africa grows fastest at 15.86% a year.
North America
North America grows from USD 233.61 million to USD 588.03 million, 9.67% a year. US data centers used 176 TWh in 2023, 4.4% of US electricity, and could use 6.7% to 12% by 2028 (Source: US Department of Energy, 20 December 2024), which keeps the United States the largest buyer of new pathway kit.
Asia Pacific
Asia Pacific grows from USD 150.17 million to USD 486.11 million, 12.46% a year, led by China at USD 60.07 million in 2025 and India, whose capacity rose fourfold between 2020 and 2025 (Source: Press Information Bureau, March 2026).
Europe
Europe cable management spend for data centers grows from USD 116.80 million to USD 274.42 million, 8.92% a year, as sustainability mandates such as EU data center energy reporting push operators to rebuild airflow and cable routes. In Ireland, data centers used 7,663 GWh in 2025, 23% of metered electricity (Source: Central Statistics Office, 7 July 2026), and grid limits there push operators to refit existing halls rather than build new ones.
Latin America
Latin America grows from USD 25.03 million to USD 86.24 million, 13.17% a year, with Brazil at USD 11.12 million in 2025; Legrand announced a data center solutions acquisition in Brazil in February 2026 (Source: Legrand, 12 February 2026). Mexico adds USD 6.12 million in 2025 and Argentina USD 1.39 million.
Middle East and Africa
The Middle East and Africa grows from USD 30.59 million to USD 133.29 million, 15.86% a year, the fastest of the five regions, because Saudi Arabia and the United Arab Emirates build AI campuses on new slab floors with overhead pathways from day one; Nigeria adds USD 1.11 million in 2025.
Which Countries Buy the Most Data Center Cable Management Hardware?
The United States buys the most at USD 216.92 million in 2025, 39.0% of the market, and India is the fastest large country at 18.38% a year.
| Rank | Country | Region | 2025 (USD million) | 2035 (USD million) | CAGR 2025-2035 |
|---|---|---|---|---|---|
| 1 | United States | North America | 216.92 | 542.56 | 9.60% |
| 2 | China | Asia Pacific | 60.07 | 181.90 | 11.72% |
| 3 | Germany | Europe | 23.92 | 54.88 | 8.66% |
| 4 | United Kingdom | Europe | 22.25 | 50.18 | 8.47% |
| 5 | Japan | Asia Pacific | 21.14 | 61.16 | 11.21% |
| 6 | Canada | North America | 16.69 | 45.47 | 10.54% |
| 7 | India | Asia Pacific | 13.35 | 72.13 | 18.38% |
| 8 | France | Europe | 12.79 | 29.79 | 8.82% |
| 9 | Australia | Asia Pacific | 11.68 | 34.50 | 11.44% |
| 10 | Brazil | Latin America | 11.12 | 37.63 | 12.96% |
| 11 | Singapore | Asia Pacific | 10.01 | 25.09 | 9.62% |
| 12 | Saudi Arabia | Middle East and Africa | 8.34 | 47.04 | 18.89% |
Saudi Arabia, ranked 12th at USD 8.34 million in 2025, grows 18.89% a year and moves into the top 10 by 2035. Outside the top 12, DC Market Insights puts South Korea at USD 7.95 million in 2025 (USD 24.10 million in 2035), Mexico at USD 6.12 million (USD 21.30 million), Russia at USD 2.50 million (USD 5.00 million), Turkey at USD 2.23 million (USD 6.10 million), Argentina at USD 1.39 million (USD 3.95 million) and Nigeria at USD 1.11 million (USD 5.05 million).
What Could the Data Center Cable Management Market Be Worth in 2035?
DC Market Insights puts the 2035 data center cable management market at USD 1.57 billion in the base case, within a range of USD 1.32 billion to USD 1.83 billion.
| Scenario | 2035 (USD million) | CAGR 2025-2035 | Assumption |
|---|---|---|---|
| Low | 1,317.20 | 9.00% | New capacity stalls near 22 GW a year on grid limits; steel prices fall back to 2024 levels |
| Base | 1,568.09 | 10.92% | New capacity reaches 27.0 GW in 2035; AI share 66%; content USD 37,920 per new MW |
| High | 1,834.67 | 12.68% | AI clusters double fibre per rack again after 2030; refresh cycles shorten to five years |
Who Are the Leading Data Center Cable Management Suppliers?
Five data center cable management suppliers hold about 42% of the USD 556.20 million spent in 2025, a DC Market Insights estimate based on their product ranges and data center sales statements; regional tray makers and rack vendors share the rest.
- Legrand
- Panduit
- nVent
- Eaton
- ABB
- Chatsworth Products
- Atkore
- Amphenol (CommScope CCS)
- HellermannTyton
- Schneider Electric
- Vertiv
- Rittal
- OBO Bettermann
- Niedax Group
- Snake Tray
Legrand reported data center sales of EUR 2.4 billion in 2025 and more than 30% like-for-like data center growth in the first half of 2026 (Source: Legrand, 29 July 2026). nVent reported second-quarter 2026 sales of USD 1.5 billion, up 53%, after completing the USD 975 million purchase of the Electrical Products Group of Avail Infrastructure Solutions in May 2025 (Source: nVent). Eaton reported data center orders up about 200% and revenue up about 40% in the fourth quarter of 2025 (Source: Eaton, 3 February 2026). ABB’s Electrification orders rose 36% to USD 5.32 billion in the fourth quarter of 2025, helped by data center orders above USD 100 million each (Source: ABB, 29 January 2026). Atkore’s Safety and Infrastructure segment, which includes Unistrut framing and cable management, reported fiscal 2025 sales of USD 853.4 million (Source: Atkore 10-K, November 2025). Amphenol completed the purchase of CommScope’s Connectivity and Cable Solutions business for USD 10.5 billion in January 2026 (Source: Amphenol, 12 January 2026). None of these companies reports data center cable management revenue on its own, so the 42% share is modelled, not reported.
What Has Changed in Data Center Cable Management Since 2025?
Six dated data center cable management events since May 2025 show suppliers adding fibre and data center capacity while AI raises fibre counts.
- In May 2025, nVent completed the USD 975 million acquisition of the Electrical Products Group of Avail Infrastructure Solutions, adding enclosures, switchgear and bus systems (Source: nVent).
- In July 2025, Panduit was certified to offer MMC very-small-form-factor fibre products for AI and hyperscale fibre density (Source: Panduit).
- In August 2025, Chatsworth Products announced a multi-year manufacturing capacity build-out with a new facility in New Bern, North Carolina (Source: Chatsworth Products).
- In January 2026, Amphenol completed its USD 10.5 billion acquisition of CommScope’s Connectivity and Cable Solutions business, expected to deliver about USD 4.1 billion of sales in 2026 (Source: Amphenol).
- In May 2026, NVIDIA and Corning announced a partnership under which Corning will raise US optical connectivity capacity 10 times (Source: NVIDIA).
- In July 2026, Legrand reported that data centers made up 32% of group revenue in the first half of 2026 and that it had acquired Girtz Industries (Source: Legrand).
Analyst Takeaways: What Should Cable Management Buyers Plan For?
Four numbers matter most for data center cable management buyers planning 2026 to 2035 budgets, starting with USD 39,000 of hardware per AI MW.
- USD 39,000 of pathway hardware per AI MW in 2025, 39% more than an air-cooled MW, because back-end fibre networks add trunks to every row.
- 14.57% a year growth in overhead fiber raceways to USD 368.50 million by 2035, because slab floors and MMC connectors push dense fibre overhead.
- 80% rise in the BLS structural metal price index from January 2020 to December 2025, because steel sets most tray and support cost; fixed-price bids need an index clause.
- USD 544.25 million of yearly refresh spend by 2035, because AI conversions re-cable existing halls; retrofit kits that install live win this work.
Methodology: How Did DC Market Insights Size the Data Center Cable Management Market?
DC Market Insights built the Data Center Cable Management Market bottom-up from capacity and pathway content per MW, giving USD 556.20 million for 2025 from 8 model inputs.
New-build spend equals new IT capacity (12.0 GW in 2025, 22.0 GW in 2030, 27.0 GW in 2035) times pathway content per new MW (USD 28,000 air-cooled and USD 39,000 AI in 2025, weighted by an AI share of 35%, 60% and 66%). Installed-base spend equals installed IT capacity (116 GW in 2025, 311 GW in 2035) times USD 1,500 per MW a year in 2025, rising to USD 1,750. In 2025: 12.0 GW x USD 31,850 = USD 382.20 million, plus 116 GW x USD 1,500 = USD 174.00 million, for USD 556.20 million. Segment, region and country shares are applied to this total, and every split sums to it.
Three bound checks hold. Ceiling one: the market is about 21% of Legrand’s 2025 data center sales of EUR 2.4 billion (about USD 2.7 billion), which also include power distribution, busway, racks and cabinets. Ceiling two: it is below the USD 853.4 million fiscal 2025 sales of Atkore’s Safety and Infrastructure segment, which sells framing and cable management to all building types. Floor: 12.0 GW of new capacity at a minimum tray-and-manager kit of USD 15,000 per MW, plus 116 GW at USD 800 per MW a year, already gives USD 272.80 million. The full method is described on the DC Market Insights research methodology page.
Table of contents
- 01Introduction
- 1.1Report Description
- 1.2Key Market Statistics, 2025, 2026, 2030 and 2035
- 02Executive Summary
- 2.1Market Snapshot, 2025, 2026 and 2035
- 2.2Market Size Chart, 2020-2035
- 03Market Scope
- 3.1Included Products
- 3.2Excluded Products
- 3.3How the Cable Management Segments Fit Together
- 3.4Why Market Estimates Differ
- 04Market Drivers
- 4.1AI Back-End Networks Multiply Fibre Trunks
- 4.2BLS Price Indexes for Structural Metal and Wiring Devices
- 4.3Legrand and nVent Data Center Capacity
- 05Market Trends
- 5.1Slab Floors Push Wire Mesh Tray Overhead
- 5.2Very-Small-Form-Factor Connectors and Raceway Fill
- 5.3Power Pods with Factory-Built Pathways
- 06Market Challenges
- 6.1Steel Price Swings
- 6.2Coolant Pipes Competing for Ceiling Space
- 07Market Opportunities
- 7.1Refresh of Existing Halls
- 7.2India and Saudi Arabia
- 08Pricing
- 8.1Cable Management Content per MW, 2020, 2025, 2030 and 2035
- 8.2Wire Mesh Tray Price Anchor
- 09Standards and Regulation
- 9.1ANSI/TIA-942-C
- 9.2ANSI/TIA-569-E
- 9.3ANSI/BICSI 002-2024
- 9.4NEC 2026 Article 392
- 9.5IEC 61537:2023
- 9.6NEMA VE 1-2017 and VE 2-2013
- 9.7EN 50174-2:2018
- 9.8EU Delegated Regulation 2026/331
- 10Market Segmentation
- 10.1By Product Type
- 10.2Cable Trays (Wire Mesh Ladder and Solid-Bottom)
- 10.3Overhead Fiber Raceways and Ducts
- 10.4Rack and Cabinet Cable Managers
- 10.5Underfloor Trays and Pathways
- 10.6Cable Ties Labels and Accessories
- 10.7By Cable Type Served
- 10.8Power Cable Pathways
- 10.9Copper Data Cable Pathways
- 10.10Fiber Optic Cable Pathways
- 10.11By Data Center Type
- 10.12Hyperscale and AI
- 10.13Colocation
- 10.14Enterprise
- 10.15Edge
- 11DC Exclusive: Cable Pathway Supplier Map
- 11.1Supplier, Product Lines and Estimated 2025 Share
- 11.2Tray Specialists vs Network-Side Suppliers
- 12Regional Insights
- 12.1North America
- 12.2Asia Pacific
- 12.3Europe
- 12.4Latin America
- 12.5Middle East and Africa
- 13Country Analysis
- 13.1United States
- 13.2China
- 13.3Germany
- 13.4United Kingdom
- 13.5Japan
- 13.6Canada
- 13.7India
- 13.8France
- 13.9Australia
- 13.10Brazil
- 13.11Singapore
- 13.12Saudi Arabia
- 14Forecast Scenarios
- 14.1Low Scenario
- 14.2Base Scenario
- 14.3High Scenario
- 15Competitive Insights
- 15.1Legrand
- 15.2Panduit
- 15.3nVent
- 15.4Eaton
- 15.5ABB
- 15.6Chatsworth Products
- 15.7Atkore
- 15.8Amphenol (CommScope CCS)
- 15.9HellermannTyton
- 15.10Schneider Electric
- 15.11Vertiv
- 15.12Rittal
- 15.13OBO Bettermann
- 15.14Niedax Group
- 15.15Snake Tray
- 16Recent Developments
- 16.1Dated Supplier and Technology Events, 2025-2026
- 17Analyst Takeaways
- 17.1What Cable Management Buyers Should Plan For
- 18Methodology
- 18.1Bottom-Up Model
- 18.2Bound Checks
- Fig. 1Data Center Cable Management Market Size, 2020-2035
- Table 1Market Snapshot
- Table 2Scope Comparison
- Table 3Cable Management Content per MW, 2020-2035
- Table 4Segmentation by Product Type
- Table 5Segmentation by Cable Type Served
- Table 6Segmentation by Data Center Type
- Table 7Cable Pathway Supplier Map
- Table 8Top 12 Countries
- Table 9Forecast Scenarios, 2035
About this report
Written by Amit Jain and reviewed by Deepti Agrawal, Senior Editor, Research. Figures are built top-down and bottom-up and reconciled before publication, with 2025 as the base year.
Read our methodologyHow we built this
- Historical period2020-2024
- Base year2025
- Forecast period2026-2035
- Sizing approachTop-down + bottom-up
Need more than the report?
Advisory on this market
Due diligence, site selection and market entry work, by the analysts who wrote this report.
See consulting servicesFrequently asked questions
USD 661.52 million in 2026, up 18.94% from USD 556.20 million in 2025, according to DC Market Insights estimates. The market is projected to reach USD 1.57 billion by 2035, a CAGR of 10.92% from 2025.
10.92% a year from 2025 to 2035, after 19.49% a year from 2020 to 2025, because new IT capacity rises from 12.0 GW to 27.0 GW a year and AI halls carry USD 39,000 of pathway hardware per MW.
USD 556.20 million of 2025 spend on cable trays, overhead fiber raceways, rack and cabinet cable managers, underfloor trays, cable ties and labels bought for data centers. Cables, racks, containment and installation labour are excluded.
USD 31,850 per new MW in 2025 on average: USD 28,000 in an air-cooled hall and USD 39,000 in a liquid-cooled AI hall, plus about USD 1,500 a year per installed MW for refresh (DC Market Insights estimates).
Overhead fiber raceways and ducts, at 14.57% a year from USD 94.55 million in 2025 to USD 368.50 million in 2035, because AI back-end networks need more than 10 times the fibre of traditional networks.
Underfloor trays fall from 7.0% of spend in 2025 to 4% in 2035 because liquid-cooled AI halls sit on concrete slabs that carry racks above 1,500 kg, so wire mesh trays and fibre raceways run above the racks.
North America, with USD 233.61 million or 42.0% of 2025 spend. The Middle East and Africa grows fastest at 15.86% a year as Saudi Arabia and the United Arab Emirates build AI campuses.
Legrand, Panduit, nVent, Eaton and ABB hold about 42% of 2025 spend (DC Market Insights estimate). Legrand reported data center sales of EUR 2.4 billion in 2025, 26% of group sales.
Seven main ones in 2026: ANSI/TIA-942-C (2024), TIA-569-E, ANSI/BICSI 002-2024, NEC 2026 Article 392, IEC 61537:2023, NEMA VE 1-2017 and EN 50174-2:2018.
USD 661.52 million in 2026 is the DC Market Insights figure for pathway hardware bought for data centers only. Estimates that add conduit for all buildings, the cables themselves or installation labour come out several times larger.
Licences, delivery and payment
Which licence should I choose?
Single User is a view-only PDF for one person. Multi User adds a printable PDF and the Excel data for unlimited users at one location. Enterprise covers your whole company and includes 100 free analyst hours.
How and when will I receive the report?
By email, within 24–48 business hours of payment, in the formats of your licence.
How can I pay?
Securely through PayPal: with a PayPal account, a debit or credit card, or PayPal Pay Later where available. Prices are in US dollars.
Can I see a sample first?
Yes. Request a free sample and we will email it to you.
Can the report be tailored to my needs?
Yes. We can add countries, segments or data cuts. Talk to an analyst about the scope you need.
Can I get an invoice or pay against a purchase order?
Write to sales@dcmarketinsights.com and our team will help.