
Crypto Mining Data Center Market Size, Share & Forecast to 2035
Market at a glance
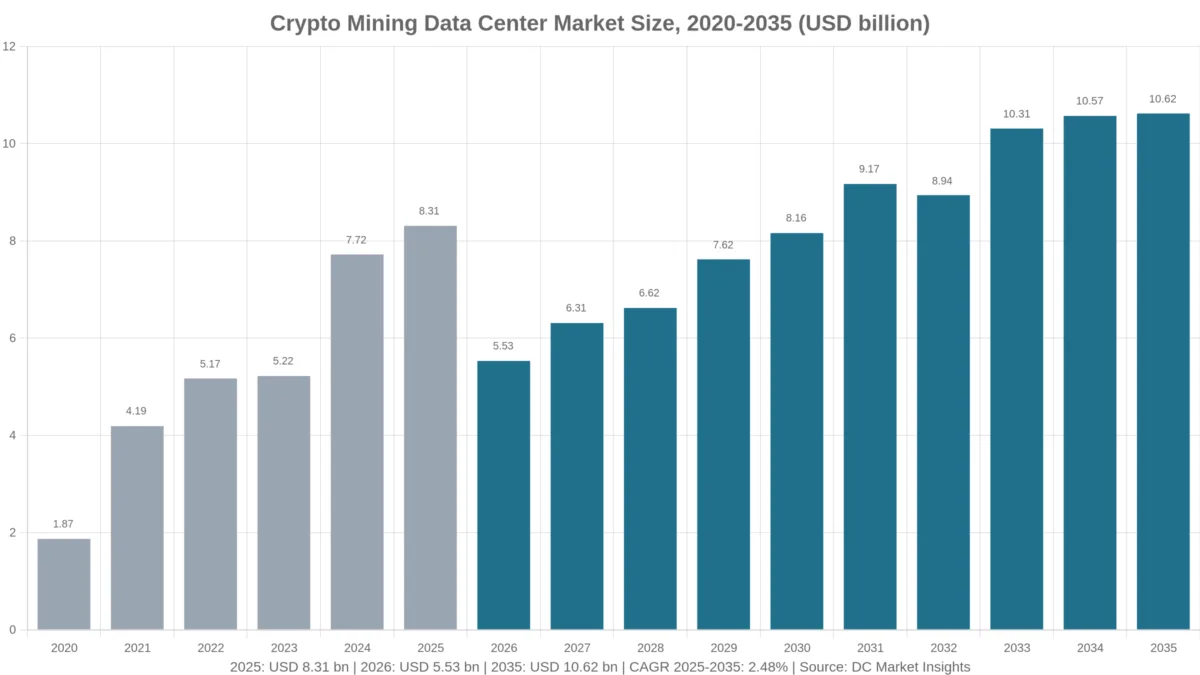
The Crypto Mining Data Center market was worth USD 8,310.0 million in 2025 and is forecast to reach USD 10.62 billion by 2035, growing at a 2.48% CAGR.
 By Amit Jain, Senior Consultant, ICT & Emerging Technologies
 Reviewed by Deepti Agrawal
Last updated 29 Oct 2026
Base year 2025 PDF + Excel
Key findings
April 2024 Halving Forces a Faster Fleet Refresh
Mining Campuses Become AI Campuses
Norway and New York Restrict New Mining Sites
Hosting for Miners Displaced by AI Leases
What is inside the report
- 01Introduction and Market Scope
- 02Key Market Statistics and Takeaways
- 03Executive Summary
- 04Market Drivers
- 05Market Trends
- 06Market Challenges
- 07Market Opportunities
- 08Pricing
- 09Standards and Regulation
- 10Market Segmentation
- 17chapters
- 2020-2024Historical period
- 2026-2035Forecast period
- —Companies profiled
Segmentation
Recent developments
TeraWulf added 160 MW of critical IT for Fluidstack with a Google backstop of about USD 3.2 billion (Source: TeraWulf).
Core Scientific and CoreWeave set out about 590 MW of AI capacity with more than USD 10 billion of contract value (Source: Core Scientific).
the Norwegian government proposed a temporary ban on new crypto-mining data centres (Source: Government of Norway).
IREN signed a USD 9.7 billion, five-year AI cloud contract with Microsoft for Childress, Texas (Source: IREN).
Hut 8 signed a 15-year, 245 MW lease at River Bend, Louisiana, worth USD 7.0 billion (Source: Hut 8).
Canaan Inc. reported 2025 revenue of USD 529.7 million (Source: Canaan Inc.).
Full analysis
The Crypto Mining Data Center Market is valued at USD 5.53 billion in 2026 and is projected to reach USD 10.62 billion by 2035, after USD 8.31 billion in 2025, a CAGR of 2.48% from 2025 to 2035 (DC Market Insights estimate). The market covers what proof-of-work miners spend on the sites that run their machines: application-specific integrated circuit (ASIC) miners, the power and cooling build of mining halls and containers, third-party hosting fees net of electricity, and operations and repair work. Spend falls 33.46% in 2026 because the Bitcoin network stopped adding machines: Riot Platforms, citing Blockchain.com, reports network hashrate averaging 1,071 exahashes per second (EH/s) in the fourth quarter of 2025 and 957 EH/s in the second quarter of 2026, so 2026 ASIC deliveries drop to about 298 EH/s from 409 EH/s. The receipt for 2025 is 409 EH/s of new miners × USD 14 per terahash = USD 5.72 billion, plus 4,077 MW of new mining load × USD 0.45 million per MW = USD 1.83 billion, plus hosting and repair work of USD 755.07 million. At the same time the best-powered sites are leaving mining: six contract sets disclosed between August 2025 and February 2026 move 2,157 MW of former mining capacity to artificial intelligence (AI) tenants for USD 48.8 billion, so new mining load has to be built elsewhere, mostly in the Middle East and Africa, the fastest region at 8.55% a year, led by Ethiopia’s state utility power contracts.
Key Market Statistics: How Big Is the Crypto Mining Data Center Market in 2026?
DC Market Insights estimates the Crypto Mining Data Center Market at USD 5.53 billion in 2026, 33.46% below the USD 8.31 billion spent in 2025, as flat network hashrate cuts miner orders.
- Market size 2025: USD 8.31 billion; 2026: USD 5.53 billion; 2030: USD 8.16 billion; 2035: USD 10.62 billion.
- CAGR 2025-2035: 2.48% (low case -0.03%, high case 4.96%); 2020-2025: 34.79%.
- Largest component: Mining Hardware (ASIC Miners), USD 5.72 billion or 68.83% of 2025 spend.
- Fastest cooling method: Immersion Cooled, 12.32% a year to USD 2.66 billion in 2035.
- Leading region: North America, USD 3.66 billion or 44.0% of 2025.
- Fastest region: Middle East and Africa, 8.55% a year.
- Largest country: United States, USD 3.31 billion in 2025.
- Network load modelled: 17,550 MW of miners running in 2025 at a fleet average of 19.5 joules per terahash (J/TH).
- Market leader: Bitmain supplies most ASIC miners (DC Market Insights estimate); MARA Holdings runs the largest listed fleet at 66.4 EH/s energized at the end of 2025.
Key Takeaways: What Moves Spending on Bitcoin Mining Sites?
- ASIC hardware is 68.8% of 2025 Crypto Mining Data Center Market spend, because miners replace about 22% of the fleet each year to stay below the cost of power.
- The 2026 drop of 33.46% happens because network hashrate fell from 1,071 EH/s to 957 EH/s between late 2025 and mid-2026.
- Immersion and hydro cooling rise from 28.0% to 60.0% of spend by 2035, because denser miners above 300 terahashes per second cannot be cooled by fans alone.
- Middle East and Africa grows 8.55% a year because Texas and other U.S. grid sites are being re-let to AI tenants at much higher rent per MW.
Executive Summary: Crypto Mining Data Center Market Size and Outlook
The Global Crypto Mining Data Center Market size was valued at USD 1.87 billion in 2020, reached USD 8.31 billion in 2025, and is anticipated to reach USD 10.62 billion by 2035, at a CAGR of 2.48% during the forecast period.
| Attribute | Value |
|---|---|
| Historical period | 2020-2024 |
| Base year | 2025 |
| Forecast period | 2026-2035 |
| Market size 2025 | USD 8.31 billion |
| Market size 2026 | USD 5.53 billion |
| CAGR 2025-2035 | 2.48% |
| Market size 2035 | USD 10.62 billion |
The Crypto Mining Data Center Market grew 34.79% a year from 2020 to 2025 as network hashrate rose from about 130 EH/s to an average of about 900 EH/s in 2025 (DC Market Insights estimate from miner filings). Growth after 2026 is slower, 2.48% a year, because machines become more efficient (19.5 J/TH in 2025, 8.5 J/TH in 2035) and the price per terahash falls from USD 14 to USD 9, while the April 2028 and 2032 halvings each cut the block reward in half. Mining load stays near 17.5 to 24.6 GW, so most of the money is spent replacing machines, not building halls.
What Does the Crypto Mining Data Center Market Include?
The Crypto Mining Data Center Market counts USD 8.31 billion of 2025 spend on proof-of-work mining capacity, about 90% of it for Bitcoin.
Included
- ASIC miners delivered to mining sites, valued at purchase price per terahash.
- Power and cooling build for new mining load: substations, transformers, power distribution, air, hydro and immersion cooling, buildings and containers.
- Hosting fees paid by miners to third-party sites, net of the electricity passed through.
- Operations, maintenance and ASIC repair services.
Excluded
- Electricity bought by miners, mining revenue, pool fees and exchange services.
- Former mining sites leased to AI and high-performance computing (HPC) tenants: that spend sits in the AI Data Center Market.
- Graphics processing units (GPUs) for proof-of-stake validation and home mining rigs.
How the segments fit together
Every segment table below sums to the same total each year: component, cooling method, facility type and energy source are four views of the same USD 8.31 billion in 2025.
Why Do Crypto Mining Data Center Market Estimates Differ?
Public figures for this market name range widely, while DC Market Insights puts it at USD 5.53 billion in 2026 on a hardware-plus-site definition.
Broader definitions add the electricity that miners buy (about 138 terawatt-hours a year by the Cambridge Centre for Alternative Finance estimate of April 2025), the value of the Bitcoin mined, or the AI leases signed on former mining campuses. Narrower ones count only containers and cooling, or only North America. Mining pools, ASIC chip foundry work, blockchain software and crypto exchanges are also outside this count. The table shows what this edition carries.
| Element | In this edition | Why |
|---|---|---|
| ASIC miners | Yes, USD 5.72 billion (2025) | Miners are the IT load of a mining site |
| Power and cooling build | Yes, USD 1.83 billion | Facility spend |
| Hosting net of power | Yes, USD 368.97 million | Colocation for miners |
| Electricity | No | An operating input, not site spend |
| AI leases on former mining sites | No | Counted in AI data center spend |
Small and mid-sized miners that buy a few hundred machines and use hosting are inside the count through the hosting and hardware lines.
Market Drivers: Why Do Miners Keep Buying Sites and Machines?
Three forces keep Crypto Mining Data Center Market spend at USD 8.16 billion by 2030 despite the 2026 dip: fleet replacement after the halving, low-cost power in new countries, and grid rules that pay miners to switch off.
April 2024 Halving Forces a Faster Fleet Refresh
The April 2024 halving cut the block reward from 6.25 to 3.125 bitcoin, as MARA Holdings states in its 2025 annual report on Form 10-K, so older machines above about 25 J/TH lost money at most power prices. DC Market Insights models fleet replacement at 22% of the installed hashrate each year, which is 139 EH/s of the 409 EH/s delivered in 2025. Riot Platforms disclosed an order for 49.2 EH/s of miners for about USD 779.5 million in its 2025 Form 10-K, about USD 15.8 per terahash.
Ethiopia, the Gulf and Paraguay Sell Surplus Power to Miners
Ethiopian Electric Power said on 31 May 2024 that 4 of the 25 firms that asked for data-mining power contracts were already running and had paid 555.5 million birr in nine months. DC Market Insights puts Ethiopia at USD 254.30 million in 2025, rising to USD 611.84 million by 2035 at 9.18% a year, the fastest of the large mining countries.
Texas Grid Rules Make Miners a Flexible Load
Texas Senate Bill 1929, in force from 1 September 2023, requires mining sites in the Electric Reliability Council of Texas (ERCOT) grid with more than 75 MW of interruptible load to register with the Public Utility Commission, according to the Texas Legislature’s bill analysis. The U.S. Energy Information Administration (EIA) reported in October 2024 that ERCOT had approved 5,479 MW of large flexible load. Curtailment payments keep U.S. sites, USD 3.31 billion of 2025 spend, profitable at higher power prices.
Market Trends: How Are Mining Sites Changing?
Cooling is the clearest change in the Crypto Mining Data Center Market: immersion and hydro cooling take 60.0% of 2035 spend, up from 28.0% in 2025.
Mining Campuses Become AI Campuses
IREN signed a contract with Microsoft worth about USD 9.7 billion over five years for 200 MW of critical IT at Childress, Texas, on 3 November 2025, according to IREN’s filing with the U.S. Securities and Exchange Commission (SEC). Cipher Mining signed a 15-year, 300 MW lease with Amazon Web Services worth about USD 5.5 billion the same day. Each MW that leaves mining has to be rebuilt elsewhere, which is why DC Market Insights models 9% of mining load retiring each year.
Hydro and Immersion Cooling Replace Fans
Immersion Cooled spend grows 12.32% a year to USD 2.66 billion, and Hydro Cooled 9.53% to USD 3.72 billion, because new miners carry more heat per unit. The same fluids and tanks are covered in the Data Center Immersion Cooling Market.
Natural Gas Gains on Hydropower
The Cambridge Centre for Alternative Finance survey of April 2025, covering 49 firms and 48% of global mining activity, found natural gas at 38.2% of the energy mix, up from 25.0% in 2022, and sustainable sources at 52.4%. DC Market Insights carries Natural Gas and Flared Gas at USD 3.16 billion of 2025 spend.
Market Challenges: What Holds Crypto Mining Site Spend Back?
Policy limits and the falling price per terahash hold Crypto Mining Data Center Market growth to 2.48% a year.
Norway and New York Restrict New Mining Sites
The Norwegian government proposed on 7 October 2025 a temporary ban on new data centres that mainly mine cryptocurrency, and New York ran a two-year moratorium on new fossil-fuel power permits for proof-of-work mining from 22 November 2022 to 22 November 2024, according to the New York State Department of Environmental Conservation. DC Market Insights models Norway falling from USD 98.89 million in 2025 to USD 74.36 million by 2035.
Cheaper Terahashes Shrink Hardware Value
DC Market Insights models the price of a terahash falling from USD 14 in 2025 to USD 9 in 2035, so the hardware line grows only 3.03% a year even though deliveries more than double from 409 EH/s to 856 EH/s.
Market Opportunities: Where Is New Money in Mining Sites?
Hosting and repair are the steadiest lines in the Crypto Mining Data Center Market, together USD 1.23 billion by 2035.
Hosting for Miners Displaced by AI Leases
Hosting and Colocation Services reach USD 570.07 million by 2035 at 4.45% a year. Core Scientific booked USD 24.4 million of hosted-mining revenue in 2025, according to its fourth-quarter 2025 results, while it turns sites over to CoreWeave.
Modular Sites at Stranded Gas and Hydro
Modular and Container Sites grow 6.21% a year to USD 2.12 billion, the fastest facility type, because containers can move to flared gas and remote dams in Latin America, where Paraguay reaches USD 467.38 million by 2035.
Pricing: What Does a Terahash and a Megawatt of Mining Cost?
DC Market Insights puts the 2025 Crypto Mining Data Center Market price of ASIC hardware at USD 14 per terahash and the power-and-cooling build at USD 0.45 million per MW.
| Year | ASIC price (USD per TH/s) | Fleet efficiency (J/TH) | Site build (USD million per MW) |
|---|---|---|---|
| 2020 | 30.00 | 48.0 | 0.30 |
| 2025 | 14.00 | 19.5 | 0.45 |
| 2030 | 11.50 | 12.5 | 0.55 |
| 2035 | 9.00 | 8.5 | 0.62 |
Public anchors: Riot’s 49.2 EH/s order at about USD 779.5 million (USD 15.8 per terahash, 2025 Form 10-K); Canaan Inc. revenue of USD 529.7 million in 2025 on more than 36.5 EH/s of computing power sold, according to its fourth-quarter release; MARA’s newly deployed miners at 18.6 J/TH. A mining MW costs a fraction of an AI MW: CoreWeave funds up to USD 1.5 million per MW of Core Scientific’s AI build-out alone.
Standards and Regulation: Which Rules Apply to Mining Sites?
Five rules shape where the Crypto Mining Data Center Market spends its USD 5.53 billion in 2026.
- Texas Senate Bill 1929 (in force 1 September 2023): registration of mining loads above 75 MW in ERCOT (Source: Texas Legislature).
- New York Chapter 628 of the Laws of 2022: two-year moratorium on fossil-fuel power permits for proof-of-work mining, 2022-2024 (Source: New York State Department of Environmental Conservation).
- Russia’s registry of miners kept by the Federal Tax Service, with a 6,000 kWh a month limit for individuals who mine without registering (Source: Federal Tax Service of Russia).
- Norway’s proposed temporary ban on new crypto-mining data centres, 7 October 2025 (Source: Government of Norway).
- EU Markets in Crypto-Assets Regulation (EU) 2023/1114, whose sustainability disclosures cover the energy use of consensus mechanisms (Source: EUR-Lex).
The EIA estimated in February 2024 that mining uses 0.6% to 2.3% of U.S. electricity, across 137 identified facilities.
Market Segmentation: Which Parts of Crypto Mining Sites Earn the Most?
Mining Hardware (ASIC Miners) is the largest Crypto Mining Data Center Market segment at USD 5.72 billion in 2025, and Immersion Cooled is the fastest at 12.32% a year.
By Component
Operations and Repair Services grow fastest among components at 5.52% a year as fleets age between refresh cycles.
| Component | 2025 (USD million) | Share 2025 | 2035 (USD million) | CAGR 2025-2035 |
|---|---|---|---|---|
| Mining Hardware (ASIC Miners) | 5,720.40 | 68.83% | 7,707.60 | 3.03% |
| Facility Infrastructure (Power and Cooling Build) | 1,834.85 | 22.08% | 1,683.52 | -0.86% |
| Hosting and Colocation Services | 368.97 | 4.44% | 570.07 | 4.45% |
| Operations and Repair Services | 386.10 | 4.65% | 661.06 | 5.52% |
By Cooling Method
Air Cooled spend shrinks 3.37% a year as halls move to liquid.
| Cooling Method | 2025 (USD million) | Share 2025 | 2035 (USD million) | CAGR 2025-2035 |
|---|---|---|---|---|
| Air Cooled | 5,983.43 | 72.00% | 4,248.90 | -3.37% |
| Hydro Cooled | 1,495.86 | 18.00% | 3,717.79 | 9.53% |
| Immersion Cooled | 831.03 | 10.00% | 2,655.56 | 12.32% |
By Facility Type
Self-Mining Owned Sites carry 64.0% of 2025 spend.
| Facility Type | 2025 (USD million) | Share 2025 | 2035 (USD million) | CAGR 2025-2035 |
|---|---|---|---|---|
| Self-Mining Owned Sites | 5,318.61 | 64.00% | 6,160.90 | 1.48% |
| Third-Party Hosting Sites | 1,828.27 | 22.00% | 2,336.89 | 2.48% |
| Modular and Container Sites | 1,163.45 | 14.00% | 2,124.45 | 6.21% |
By Energy Source
Wind and Solar grow fastest at 6.36% a year, while Coal and Other shrinks 1.59% a year.
| Energy Source | 2025 (USD million) | Share 2025 | 2035 (USD million) | CAGR 2025-2035 |
|---|---|---|---|---|
| Natural Gas and Flared Gas | 3,157.92 | 38.00% | 3,505.34 | 1.05% |
| Hydropower | 1,911.37 | 23.00% | 2,336.89 | 2.03% |
| Wind and Solar | 1,662.06 | 20.00% | 3,080.45 | 6.36% |
| Nuclear | 831.03 | 10.00% | 1,062.22 | 2.48% |
| Coal and Other | 747.93 | 9.00% | 637.33 | -1.59% |
DC Exclusive: Mining-to-AI Conversion Tracker, 6 Contracts and 2,157 MW
Six contract sets disclosed between August 2025 and February 2026 move 2,157 MW of mining-grade capacity to AI tenants for about USD 48.8 billion, which DC Market Insights uses to set the 9% yearly retirement of mining load in the Crypto Mining Data Center Market model; the tracker is a DC Market Insights model built on 6 inputs from company filings.
| Deal | Signed | Critical IT (MW) | Contract value (USD billion) | Site |
|---|---|---|---|---|
| Core Scientific to CoreWeave | Oct 2025 | 590 | More than 10.0 | Texas, Georgia, Kentucky and other sites |
| IREN to Microsoft | Nov 2025 | 200 | 9.7 over 5 years | Childress, Texas |
| Cipher Mining to Amazon Web Services | Nov 2025 | 300 | 5.5 over 15 years | Black Pearl, Texas |
| Cipher Mining to Fluidstack | By Feb 2026 | 300 | 3.8 over 10 years | Barber Lake, Texas |
| TeraWulf to Fluidstack (all contracts) | Aug 2025 to Feb 2026 | 522 | More than 12.8 | Lake Mariner, New York and other sites |
| Hut 8 to Fluidstack | Dec 2025 | 245 | 7.0 over 15 years | River Bend, Louisiana |
| Total | 2025-2026 | 2,157 | About 48.8 | Mostly Texas |
The value per MW tells the story: about USD 22.6 million of contract value per MW of AI lease against a mining build cost of USD 0.45 million per MW. MARA Holdings also formed a joint venture with Starwood for more than 1 GW of IT load, not counted in the 2,157 MW. Each contract leaves a mining fleet without a home, so DC Market Insights expects 1,580 MW of mining load to be rebuilt in 2026, mainly in Ethiopia, the Gulf, Paraguay and West Texas.
Regional Insights: Where Are Crypto Mining Data Centers Built?
North America leads the Crypto Mining Data Center Market with 44.0% of 2025 spend, and Middle East and Africa grows fastest at 8.55% a year.
| Region | 2025 (USD million) | Share 2025 | 2035 (USD million) | CAGR |
|---|---|---|---|---|
| North America | 3,656.54 | 44.00% | 4,036.45 | 0.99% |
| Asia Pacific | 1,994.48 | 24.00% | 2,336.89 | 1.60% |
| Europe | 1,412.76 | 17.00% | 1,487.11 | 0.51% |
| Middle East and Africa | 747.93 | 9.00% | 1,699.56 | 8.55% |
| Latin America | 498.62 | 6.00% | 1,062.22 | 7.86% |
North America
North America mining site spend moves from USD 3.66 billion in 2025 to USD 4.04 billion in 2035 at 0.99% a year. The United States has USD 3.31 billion of 2025 spend; the Cambridge survey of April 2025 put the U.S. at 75.4% of the mining activity it covered, and EIA counted 10,275 MW of maximum use at 101 U.S. facilities.
Asia Pacific
Asia Pacific mining site spend moves from USD 1.99 billion in 2025 to USD 2.34 billion in 2035 at 1.60% a year. China remains second at USD 1.16 billion through small hydro and gas sites, and Kazakhstan holds USD 279.23 million (DC Market Insights estimates).
Europe
Europe mining site spend moves from USD 1.41 billion in 2025 to USD 1.49 billion in 2035 at 0.51% a year. Russia is USD 932.42 million of 2025 spend after its Federal Tax Service opened a registry of miners; Norway shrinks under its October 2025 ban proposal.
Middle East and Africa
Middle East and Africa mining site spend moves from USD 747.93 million in 2025 to USD 1.70 billion in 2035 at 8.55% a year. Ethiopia (USD 254.30 million), the United Arab Emirates (USD 209.42 million) and Oman (USD 104.71 million) grow on state power contracts.
Latin America
Latin America mining site spend moves from USD 498.62 million in 2025 to USD 1.06 billion in 2035 at 7.86% a year. Paraguay leads with USD 249.31 million, and Brazil is the fastest country at 11.77% a year.
Country Analysis: Which Countries Spend Most on Mining Sites?
The United States is the largest Crypto Mining Data Center Market country at USD 3.31 billion in 2025, and Brazil is the fastest of the top 12 at 11.77% a year, ahead of Oman at 9.31%.
| Rank | Country | Region | 2025 (USD million) | 2035 (USD million) | CAGR |
|---|---|---|---|---|---|
| 1 | United States | North America | 3,309.17 | 3,592.44 | 0.82% |
| 2 | China | Asia Pacific | 1,156.80 | 1,168.45 | 0.10% |
| 3 | Russia | Europe | 932.42 | 951.75 | 0.21% |
| 4 | Canada | North America | 347.37 | 444.01 | 2.48% |
| 5 | Kazakhstan | Asia Pacific | 279.23 | 303.80 | 0.85% |
| 6 | Ethiopia | Middle East and Africa | 254.30 | 611.84 | 9.18% |
| 7 | Paraguay | Latin America | 249.31 | 467.38 | 6.49% |
| 8 | United Arab Emirates | Middle East and Africa | 209.42 | 407.89 | 6.89% |
| 9 | Malaysia | Asia Pacific | 159.56 | 210.32 | 2.80% |
| 10 | Oman | Middle East and Africa | 104.71 | 254.93 | 9.31% |
| 11 | Norway | Europe | 98.89 | 74.36 | -2.81% |
| 12 | Brazil | Latin America | 69.81 | 212.44 | 11.77% |
Ethiopia is the fastest large country at 9.18% a year. The top 12 hold 86.3% of 2025 spend.
Forecast Scenarios: How Low or High Could Mining Site Spend Go by 2035?
The Crypto Mining Data Center Market reaches USD 10.62 billion in 2035 in the base case, within a range of USD 8.29 billion to USD 13.49 billion.
| Scenario | 2035 (USD million) | CAGR 2025-2035 | Assumption |
|---|---|---|---|
| Low | 8,285.35 | -0.03% | Hashrate near 2,300 EH/s by 2035; more sites leave for AI |
| Base | 10,622.25 | 2.48% | Hashrate 2,900 EH/s, 22% yearly fleet replacement |
| High | 13,490.26 | 4.96% | Hashrate above 3,500 EH/s on higher Bitcoin prices |
Key Players and Market Share: Who Builds and Equips Crypto Mining Sites?
DC Market Insights estimates that three ASIC makers supply about 90% of the USD 5.72 billion hardware line of the Crypto Mining Data Center Market, while the largest listed miners run below a quarter of network hashrate.
- Bitmain
- MicroBT
- Canaan Inc.
- Bitdeer Technologies
- Auradine
- MARA Holdings
- Riot Platforms
- CleanSpark
- Core Scientific
- Cipher Mining
- IREN
- Hut 8
- TeraWulf
- Bitfarms
MARA reported 66.4 EH/s energized and revenue of USD 907.1 million for 2025; Bitdeer reported 55.2 EH/s of self-mining in December 2025 and 1,658 MW online; CleanSpark reached 50 EH/s in June 2025 and revenue of USD 766.3 million in its year to September 2025; Riot deployed 38.5 EH/s at the end of 2025 with 700 MW at Rockdale and 400 MW developed at Corsicana, and revenue of USD 647.4 million (Source: company filings with the SEC). Canaan Inc. revenue more than doubled to USD 529.7 million in 2025. The five largest listed fleets, about 233 EH/s, equal roughly 22% of the 1,071 EH/s network average of the fourth quarter of 2025 (DC Market Insights calculation).
Recent Developments in the Crypto Mining Data Center Market
The Crypto Mining Data Center Market saw AI lease contracts on mining sites worth about USD 48.8 billion disclosed between August 2025 and February 2026.
- In August 2025, TeraWulf added 160 MW of critical IT for Fluidstack with a Google backstop of about USD 3.2 billion (Source: TeraWulf).
- In October 2025, Core Scientific and CoreWeave set out about 590 MW of AI capacity with more than USD 10 billion of contract value (Source: Core Scientific).
- In October 2025, the Norwegian government proposed a temporary ban on new crypto-mining data centres (Source: Government of Norway).
- In November 2025, IREN signed a USD 9.7 billion, five-year AI cloud contract with Microsoft for Childress, Texas (Source: IREN).
- In December 2025, Hut 8 signed a 15-year, 245 MW lease at River Bend, Louisiana, worth USD 7.0 billion (Source: Hut 8).
- In February 2026, Canaan Inc. reported 2025 revenue of USD 529.7 million (Source: Canaan Inc.).
Research Methodology: How the Crypto Mining Data Center Model Is Built
The Crypto Mining Data Center Market model multiplies network hashrate and machine efficiency into mining load, then prices new machines, new MW, hosting and repair work for each year from 2020 to 2035.
Inputs: network hashrate averages of 378 EH/s (2023), 630 EH/s (2024) and about 900 EH/s (2025) from Riot Platforms filings citing Blockchain.com; fleet efficiency 19.5 J/TH in 2025; 22% yearly fleet replacement; ASIC price USD 14 per terahash; site build USD 0.45 million per MW; 9% yearly retirement of mining load; hosting at 20% of load and USD 0.012 per kWh net of power; repair at USD 22,000 per MW-year. For 2025 that gives USD 5.72 billion + USD 1.83 billion + USD 368.97 million + USD 386.10 million = USD 8.31 billion.
Three bound checks:
- Ceiling 1: modelled 2025 load of 17,550 MW at a power usage effectiveness of 1.1 uses about 169 terawatt-hours a year, about a fifth above the 138 terawatt-hours that the Cambridge Centre for Alternative Finance estimated in April 2025, before network hashrate rose by roughly 40%.
- Ceiling 2: hardware spend of USD 5.72 billion equals 40% of the replacement value of the whole 900 EH/s network at Riot’s USD 15.8 per terahash, consistent with 22% yearly replacement plus about 270 EH/s of net network growth in 2025.
- Floor: Canaan’s USD 529.7 million revenue plus Riot’s USD 779.5 million order already make USD 1.31 billion, below the modelled hardware line.
All figures are DC Market Insights estimates in current U.S. dollars. See the research methodology. Related coverage: Energy and Utilities Data Center Market and Data Center Colocation Market. Company figures come from filings such as the Riot Platforms 2025 Form 10-K and IREN’s Microsoft contract release; the Cambridge figures from the University of Cambridge Judge Business School and the Norwegian proposal from the Government of Norway.
Table of contents
- 01Introduction and Market Scope
- 1.1Included
- 1.2Excluded
- 1.3How the segments fit together
- 1.4Why Estimates Differ
- 02Key Market Statistics and Takeaways
- 2.1Market Size 2025, 2026, 2030 and 2035
- 2.2CAGR and Scenario Range
- 2.3Key Takeaways
- 03Executive Summary
- 3.1Market Snapshot, 2025, 2026 and 2035
- 3.2Growth Outlook 2026-2035
- 04Market Drivers
- 4.1April 2024 Halving Forces a Faster Fleet Refresh
- 4.2Ethiopia, the Gulf and Paraguay Sell Surplus Power to Miners
- 4.3Texas Grid Rules Make Miners a Flexible Load
- 05Market Trends
- 5.1Mining Campuses Become AI Campuses
- 5.2Hydro and Immersion Cooling Replace Fans
- 5.3Natural Gas Gains on Hydropower
- 06Market Challenges
- 6.1Norway and New York Restrict New Mining Sites
- 6.2Cheaper Terahashes Shrink Hardware Value
- 07Market Opportunities
- 7.1Hosting for Miners Displaced by AI Leases
- 7.2Modular Sites at Stranded Gas and Hydro
- 08Pricing
- 8.1ASIC Price per Terahash, 2020-2035
- 8.2Site Build Cost per MW
- 8.3Public Price Anchors
- 09Standards and Regulation
- 9.1Texas Senate Bill 1929
- 9.2New York Chapter 628 of 2022
- 9.3Russia Federal Tax Service Miner Registry
- 9.4Norway Proposed Ban
- 9.5EU Markets in Crypto-Assets Regulation
- 10Market Segmentation
- 10.1Component: Mining Hardware (ASIC Miners)
- 10.2Component: Facility Infrastructure (Power and Cooling Build)
- 10.3Component: Hosting and Colocation Services
- 10.4Component: Operations and Repair Services
- 10.5Cooling Method: Air Cooled
- 10.6Cooling Method: Hydro Cooled
- 10.7Cooling Method: Immersion Cooled
- 10.8Facility Type: Self-Mining Owned Sites
- 10.9Facility Type: Third-Party Hosting Sites
- 10.10Facility Type: Modular and Container Sites
- 10.11Energy Source: Natural Gas and Flared Gas
- 10.12Energy Source: Hydropower
- 10.13Energy Source: Wind and Solar
- 10.14Energy Source: Nuclear
- 10.15Energy Source: Coal and Other
- 11DC Exclusive: Mining-to-AI Conversion Tracker
- 11.1Core Scientific to CoreWeave
- 11.2IREN to Microsoft
- 11.3Cipher Mining to Amazon Web Services
- 11.4Cipher Mining to Fluidstack
- 11.5TeraWulf to Fluidstack
- 11.6Hut 8 to Fluidstack
- 12Regional Insights
- 12.1North America
- 12.2Asia Pacific
- 12.3Europe
- 12.4Middle East and Africa
- 12.5Latin America
- 13Country Analysis
- 13.1United States
- 13.2China
- 13.3Russia
- 13.4Canada
- 13.5Kazakhstan
- 13.6Ethiopia
- 13.7Paraguay
- 13.8United Arab Emirates
- 13.9Malaysia
- 13.10Oman
- 13.11Norway
- 13.12Brazil
- 14Forecast Scenarios
- 14.1Low Scenario
- 14.2Base Scenario
- 14.3High Scenario
- 15Competitive Insights
- 15.1Bitmain
- 15.2MicroBT
- 15.3Canaan Inc.
- 15.4Bitdeer Technologies
- 15.5Auradine
- 15.6MARA Holdings
- 15.7Riot Platforms
- 15.8CleanSpark
- 15.9Core Scientific
- 15.10Cipher Mining
- 15.11IREN
- 15.12Hut 8
- 15.13TeraWulf
- 15.14Bitfarms
- 16Recent Developments
- 16.12025 AI Lease Contracts
- 16.22025-2026 Policy and Company Updates
- 17Research Methodology
- 17.1Model Inputs
- 17.2Bound Checks
- Fig. 1Crypto Mining Data Center Market Size, 2020-2035
- Table 1Executive Summary Attributes
- Table 2Scope of This Edition
- Table 3Pricing per Terahash and per MW
- Table 4Segmentation by Component
- Table 5Segmentation by Cooling Method
- Table 6Segmentation by Facility Type
- Table 7Segmentation by Energy Source
- Table 8Mining-to-AI Conversion Tracker
- Table 9Regional Market Size
- Table 10Top 12 Countries
- Table 11Forecast Scenarios 2035
About this report
Written by Amit Jain and reviewed by Deepti Agrawal, Senior Editor, Research. Figures are built top-down and bottom-up and reconciled before publication, with 2025 as the base year.
Read our methodologyHow we built this
- Historical period2020-2024
- Base year2025
- Forecast period2026-2035
- Sizing approachTop-down + bottom-up
Need more than the report?
Advisory on this market
Due diligence, site selection and market entry work, by the analysts who wrote this report.
See consulting servicesFrequently asked questions
USD 5.53 billion in 2026, down 33.46% from USD 8.31 billion in 2025, according to DC Market Insights estimates. The market is projected to reach USD 10.62 billion by 2035, a CAGR of 2.48% from 2025.
Spend drops 33.46% because network hashrate stopped rising: it averaged 1,071 EH/s in the fourth quarter of 2025 and 957 EH/s in the second quarter of 2026, so ASIC deliveries fall to about 298 EH/s from 409 EH/s.
2.48% a year from 2025 to 2035, after 34.79% a year from 2020 to 2025, as cheaper terahashes (USD 14 falling to USD 9) offset deliveries that double to 856 EH/s by 2035.
About USD 0.45 million per MW for the power and cooling build in 2025, rising to USD 0.62 million by 2035, a DC Market Insights estimate. The ASIC miners for one MW cost far more: about USD 0.72 million at 19.5 J/TH and USD 14 per terahash.
Immersion Cooled grows fastest at 12.32% a year to USD 2.66 billion by 2035. Mining Hardware (ASIC Miners) stays the largest component at USD 5.72 billion, or 68.8% of 2025 spend.
North America, with USD 3.66 billion or 44.0% of 2025 spend. Middle East and Africa grows fastest at 8.55% a year, led by Ethiopia at 9.18%.
Yes: about 2,157 MW in six contract sets worth about USD 48.8 billion, including Core Scientific with CoreWeave (about 590 MW), TeraWulf with Fluidstack (522 MW), IREN with Microsoft (200 MW, USD 9.7 billion) and Cipher Mining with Amazon Web Services (300 MW, USD 5.5 billion).
About 138 terawatt-hours a year for Bitcoin, the Cambridge Centre for Alternative Finance estimated in April 2025, and 0.6% to 2.3% of U.S. electricity, according to the U.S. Energy Information Administration in February 2024.
Bitmain, MicroBT and Canaan supply most ASIC miners; Canaan’s 2025 revenue was USD 529.7 million. MARA Holdings ran 66.4 EH/s at the end of 2025, Bitdeer 55.2 EH/s, CleanSpark 50 EH/s and Riot Platforms 38.5 EH/s.
USD 5.53 billion in 2026 counts only ASIC miners, site build, hosting net of power and repair work. Estimates that add the electricity miners buy, the value of Bitcoin mined, or AI leases on former mining campuses come out several times larger.
Get this report
How do I get the full report?
Request a quote; we reply by email within one business day.
How and when will I receive the report?
By email, within 24–48 business hours of payment.
How can I pay?
Once you accept the quote, we email you a secure payment link.
Can I see a sample first?
Yes. Request a free sample and we will email it to you.
Can the report be tailored to my needs?
Yes. We can add countries, segments or data cuts. Talk to an analyst about the scope you need.
Can I get an invoice or pay against a purchase order?
Write to sales@dcmarketinsights.com and our team will help.