
Data Center Design Market Size, Share & Forecast to 2035
Market at a glance
The Data Center Design market was worth USD 8,130.0 million in 2025 and is forecast to reach USD 19.75 billion by 2035, growing at a 9.28% CAGR.
 By Amit Jain, Senior Consultant, ICT & Emerging Technologies
 Reviewed by Deepti Agrawal
Last updated 19 Oct 2026
Base year 2025 PDF + Excel
Key findings
Repeat Designs Cut the Fee per Megawatt Share
What is inside the report
- 01Introduction
- 02Research Methodology
- 03Executive Summary
- 04What Does the Data Center Design Market Include?
- 05Why Do Data Center Design Market Estimates Differ?
- 06Market Drivers
- 07Market Trends
- 08Market Restraints
- 09Market Opportunities
- 10Pricing Analysis: Data Center Design Cost per Megawatt
- 20chapters
- 2020-2024Historical period
- 2026-2035Forecast period
- —Companies profiled
Segmentation
Recent developments
NVIDIA released the Vera Rubin DSX AI Factory reference design and made the Omniverse DSX Blueprint generally available, with Jacobs among the infrastructure partners (Source: NVIDIA).
Jacobs said its Data Center Digital Twin solution is featured in the NVIDIA Omniverse DSX Blueprint (Source: Jacobs).
AECOM reported a record total backlog of USD 26.2 billion for its second fiscal quarter (Source: AECOM).
Jacobs reported fiscal third-quarter gross revenue of USD 4.1 billion, up 34.5%, and a first-place Engineering News-Record ranking for data centers (Source: Jacobs).
WSP Global reported a record backlog of CAD 20.1 billion at the end of June (Source: WSP Global).
Stantec said it was selected to provide architecture, engineering and integrated design services for Meta's data center in Sturgeon County, Alberta (Source: Stantec).
Full analysis
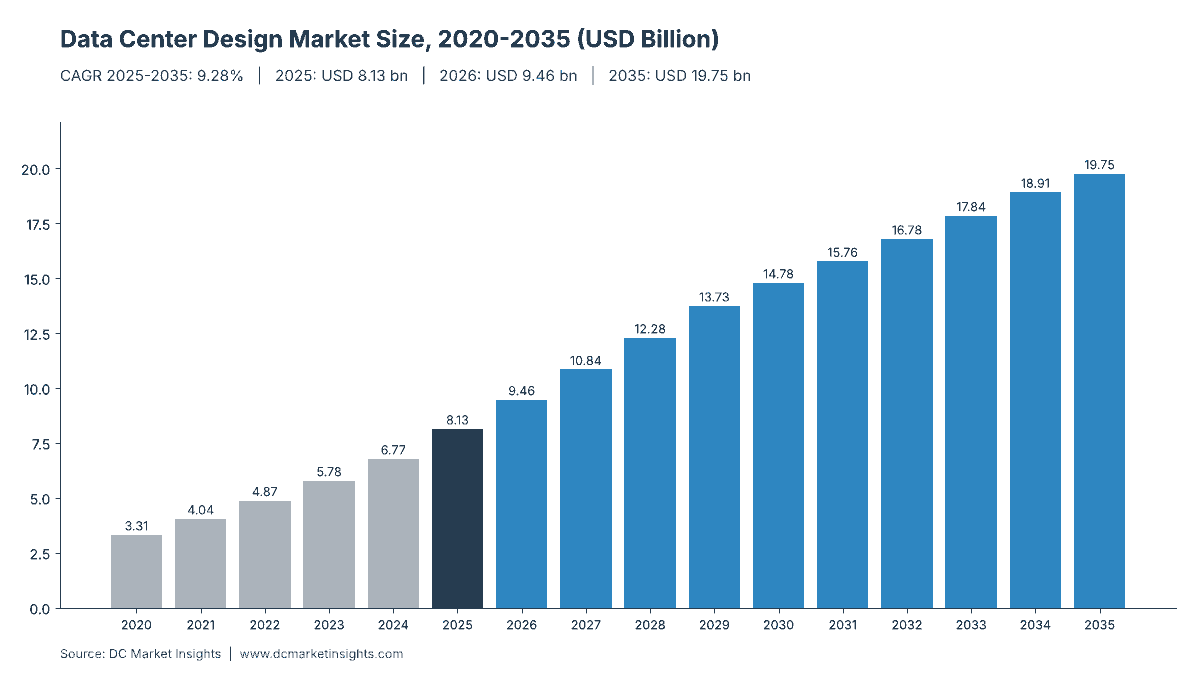
The Data Center Design Market is valued at USD 9.46 billion in 2026 and is projected to reach USD 19.75 billion by 2035, up from USD 8.13 billion in 2025, a compound annual growth rate (CAGR) of 9.28% from 2025 to 2035 (DC Market Insights estimate). Design money moves about a year ahead of construction: the USD 6.01 billion of 2025 new-build design fees were earned on the 14.0 gigawatts (GW) of IT capacity due for completion in 2026, at a facility cost of USD 11.30 million per megawatt (MW) and a fee of 3.80% of that cost. That fee rate has fallen from 4.20% in 2020 because hyperscale owners now reuse their own reference designs, and in March 2026 NVIDIA pushed the same idea to the whole industry with its Vera Rubin DSX AI Factory reference design, which lists Jacobs as an infrastructure partner. The result is a market that grows more slowly than construction spend, but whose fastest line, Digital Twin, CFD and Simulation Services, grows 14.93% a year, while Middle East and Africa is the fastest-growing region at 14.72% a year as Gulf campuses are designed from scratch.
Key Market Statistics: How Big Is the Data Center Design Market in 2026?
DC Market Insights values the Data Center Design Market at USD 9.46 billion in 2026, 16.4% above 2025, because design teams are already working on the 16.0 GW of IT capacity scheduled for completion in 2027.
- Market size 2025: USD 8.13 billion
- Market size 2026: USD 9.46 billion
- Market size 2030: USD 14.78 billion
- Market size 2035: USD 19.75 billion
- CAGR 2025-2035: 9.28% in the base case, 6.39% in the low case and 11.21% in the high case
- Largest service type: mechanical, electrical and plumbing (MEP) engineering, 54.7% of 2025 value (USD 4.45 billion)
- Fastest-growing service type: digital twin, computational fluid dynamics (CFD) and simulation services, 14.93% a year
- Largest facility type: hyperscale and AI campuses, 52.0% of 2025 value, rising to 62.0% in 2035
- Leading region: North America, 45.0% of 2025 value (USD 3.66 billion)
- Fastest-growing region: Middle East and Africa, 14.72% a year
- Largest country: the United States, USD 3.17 billion in 2025
- Market leader: Jacobs, about 6% of 2025 value (DC Market Insights assessment)
Executive Summary
The Global Data Center Design Market size was valued at USD 3.31 billion in 2020, reached USD 8.13 billion in 2025, and is anticipated to reach USD 19.75 billion by 2035, at a CAGR of 9.28% during the forecast period.
| Report attribute | Details |
|---|---|
| Historical Period | 2020-2024 |
| Base Year | 2025 |
| Forecast Period | 2026-2035 |
| Data Center Design Market Size 2025 | USD 8.13 Billion |
| Data Center Design Market Size 2026 | USD 9.46 Billion |
| Data Center Design Market, CAGR | 9.28% |
| Data Center Design Market Size 2035 | USD 19.75 Billion |
Data center design spending grew 19.69% a year from 2020 to 2025, faster than the forecast pace, because the IT capacity due for completion one year ahead doubled from 7.0 GW to 14.0 GW and facility cost per MW rose from USD 8.22 million to USD 11.30 million. From 2025 to 2035 the new-build design line grows 9.29% a year to USD 14.62 billion: completions rise to 27.5 GW, but the fee rate eases from 3.80% to 3.50% as repeat designs spread. Renovation and retrofit design grows faster, at 10.41% a year, because the installed base built before 2015 needs new power and liquid cooling, and pre-design work such as site selection and owner’s engineering reaches USD 2.02 billion by 2035.
Key Takeaways
Four figures explain where data center design spending goes between 2025 and 2035, with the reason behind each.
- The market reaches USD 19.75 billion by 2035, because new IT completions rise from 14.0 GW in 2026 to 27.5 GW in 2036 and each MW costs more to build.
- The new-build fee rate falls from 4.20% to 3.50% of facility cost, because owners reuse reference designs instead of drawing each campus from zero.
- Digital twin, CFD and simulation services grow 14.93% a year to USD 2.31 billion, because AI halls above 100 kilowatts (kW) per rack must be simulated before they are built.
- Middle East and Africa grows 14.72% a year, because Gulf campuses are mostly first-of-a-kind designs with higher fees per MW.
What Does the Data Center Design Market Include?
The Data Center Design Market covers the fees paid to outside firms to plan and design data center facilities, worth USD 8.13 billion in 2025 in the DC Market Insights model.
Included. Architecture and civil-structural design of data halls, shells and campus sites; mechanical, electrical and plumbing (MEP) engineering, including medium-voltage and low-voltage power design, cooling plant and liquid-cooling loop design, fire and controls design; digital twin, computational fluid dynamics (CFD) and power-system simulation delivered as design services; and pre-design work: site selection, power and water feasibility studies, master planning and the owner’s engineer role during procurement. Both new-build design (greenfield campuses and brownfield expansions) and the design of renovations and retrofits are counted. Values are fees earned by design and engineering firms, including the design share of design-build contracts.
Excluded. Construction work itself, covered in the Data Center Construction Market; commissioning, integrated systems testing and certification audits, covered in the Data Center Testing Inspection Certification Market; the build cost of retrofits, covered in the Data Center Renovation Market; design work done by owners’ in-house teams; equipment makers’ free application engineering; and software licences sold separately from a design contract.
How the segments fit together. Every segment table splits the same USD 8.13 billion of 2025 value. The model builds three lines: new-build design fees (USD 6.01 billion), renovation and retrofit design (USD 1.16 billion) and pre-design site and feasibility work (USD 960.00 million). The service-type split divides the first two lines by discipline; the project-type and facility-type splits regroup the same total.
Why Do Data Center Design Market Estimates Differ?
Estimates differ mainly because some count only design fees, as DC Market Insights does with USD 9.46 billion in 2026, while others add the construction that follows the drawings.
Broader definitions of data center design often fold in design-build construction value, which is many times larger than the fee; data center infrastructure management (DCIM) and building information modelling (BIM) software licences sold on their own; commissioning and certification services; interior fit-out of offices and support buildings; and design work by owners’ in-house engineering teams, which is a cost rather than a market. Some also count the design of telecom exchanges or edge cabinets that sit outside data center facilities. Each of these adds value that is not paid to an outside design firm, which is why the DC Market Insights figure is lower than a construction-inclusive number.
| Element | Included here | Why |
|---|---|---|
| Architecture, civil and structural design | Yes, USD 2.15 billion in 2025 | Fee paid to outside firms |
| MEP engineering | Yes, USD 4.45 billion in 2025 | Fee paid to outside firms |
| Digital twin, CFD and simulation services | Yes, USD 573.66 million in 2025 | Delivered under design contracts |
| Site selection, feasibility, owner’s engineer | Yes, USD 960.00 million in 2025 | Pre-design advisory fees |
| Construction and design-build build value | No | Covered by the construction report |
| Commissioning and certification | No | Covered by the testing, inspection and certification report |
| Stand-alone DCIM and BIM software licences | No | Software, not a design fee |
| In-house owner design teams | No | Internal cost, not a market |
Buyers inside the scope include hyperscale cloud providers, AI and GPU cloud operators, colocation providers, enterprises and banks building their own halls, governments and public research centres, and small and mid-sized enterprises (SMEs) commissioning edge or server-room upgrades. Design-build contractors that buy design services from engineering subconsultants are also inside the scope.
Why Is Data Center Design Spending Rising?
Data center design spending rises because the capacity due one year ahead grows from 14.0 GW to 27.5 GW and because AI halls need more engineering per MW.
AI Halls Above 100 kW per Rack Need New Power and Cooling Designs
Rack densities of 100 kW and more break the air-cooled templates most data centers were designed on, so every AI hall needs a new liquid-cooling loop, new electrical distribution and new structural checks for heavier racks. In the DC Market Insights model the AI share of new capacity rises from 35% in 2025 to 60% in 2030, and the new-build design line grows from USD 6.01 billion to USD 10.85 billion over the same years. NVIDIA said in March 2026 that more than 200 GW of projects wait in United States interconnection queues, according to the NVIDIA release on its DSX reference design, which means design firms are also redesigning projects around the power that will actually be available.
Jacobs, Stantec and WSP Report Record Backlogs
Listed design firms report the demand in their own numbers. Jacobs reported gross revenue of USD 4.1 billion in its fiscal third quarter of 2026, up 34.5%, and a backlog of USD 28.9 billion, up 27.3%, naming data centers among the sectors that led growth, according to its third-quarter fiscal 2026 results; the same release says Engineering News-Record ranked Jacobs first in 18 categories including data centers. Stantec reported net revenue of 1.8 billion Canadian dollars (CAD) in the second quarter of 2026, up 11.5%, and a contract backlog of CAD 9.2 billion, according to its second-quarter 2026 report. WSP Global reported a record backlog of CAD 20.1 billion at the end of June 2026, according to WSP Global. These backlogs cover all sectors, but data centers are named as a source of growth by Jacobs and Stantec.
Gigawatt Campuses Need Site Selection and Power Studies Years Ahead
Pre-design work grows from USD 960.00 million in 2025 to USD 2.02 billion in 2035 because campuses now start with a power study rather than a building plan. In the model, site selection, feasibility and owner’s engineering are booked two years before completion at USD 60,000 per MW in 2025, rising to USD 72,000 per MW by 2035 as grid and water studies get longer. Stantec said in August 2026 that its Buildings team was selected to provide architecture, engineering and integrated design services for Meta’s data center in Sturgeon County, Alberta, which Stantec describes as a 13 billion dollar project, an example of how one campus can keep a design team busy for several years.
How Is Data Center Design Work Changing?
Design work is shifting from one-off drawings to reusable reference designs checked in simulation, which lifts digital twin services to USD 2.31 billion by 2035.
The NVIDIA DSX Reference Design Turns AI Halls into Repeat Products
On 16 March 2026, NVIDIA released its Vera Rubin DSX AI Factory reference design and made its Omniverse DSX Blueprint generally available, according to the NVIDIA release; the blueprint lets developers build a digital twin and simulate power, cooling and operations before construction. Design firms adapt such reference designs to a site instead of starting from zero, which is the main reason the DC Market Insights fee rate falls from 3.80% of facility cost in 2025 to 3.50% in 2035.
Jacobs Puts a Data Center Digital Twin into the DSX Blueprint
Jacobs said on 16 March 2026 that its Data Center Digital Twin solution is featured in the NVIDIA Omniverse DSX Blueprint and libraries, letting owners plan and simulate gigawatt-scale AI data centers in a virtual environment, according to Jacobs. DC Market Insights counts this kind of work in the digital twin, CFD and simulation line, which rises from 7.1% of the market in 2025 to 11.7% in 2035.
Engineering Firms Buy Mission-Critical Specialists
Large firms have bought data center design capacity rather than building it. Stantec acquired Environmental Systems Design, a 270-person Chicago engineering firm, in 2023, saying the deal deepened its mission-critical and data center design expertise, according to Stantec. DC Market Insights expects further deals because the top five firms hold only about 20% of the USD 8.13 billion market.
Market Restraints: What Holds Back Data Center Design Fees?
Two restraints hold design fees below construction growth: falling fee rates on repeat work and a shortage of power engineers.
Repeat Designs Cut the Fee per Megawatt Share
Hyperscale owners that build the same hall dozens of times pay design firms for site adaptation rather than full design. In the DC Market Insights model this lowers the new-build fee from 4.20% of facility cost in 2020 to 3.50% in 2035; had the 2025 rate of 3.80% held, the 2035 market would be about USD 1.25 billion larger. The low scenario cuts the rate by a further 0.3 points from 2026, which removes a similar amount from 2035 value.
Power Engineers Are Scarce and Grid Studies Take Longer
Campus power design now depends on grid connection studies that take years in many markets, and DC Market Insights treats the number of engineers able to design medium-voltage substations and campus power systems as a limit on how fast completions can rise. DC Market Insights assumes completions of 22.0 GW in 2029 rather than a faster ramp, and the low case of USD 15.11 billion in 2035 assumes 20% fewer completions from 2027.
Where Are the Openings for Data Center Design Firms?
The two largest openings are retrofit design for older halls and simulation services for AI campuses, which together reach USD 5.43 billion in 2035.
Liquid-Cooling Retrofits of Halls Built Before 2015
Renovation and retrofit design grows 10.41% a year, faster than new-build design, because halls designed for 5 to 10 kW per rack must be re-engineered for liquid cooling and higher power. The model sets this line at 9% of renovation spend, which gives USD 1.16 billion in 2025 and USD 3.12 billion in 2035.
Simulation-Led Design for Gulf and Indian Campuses
Saudi Arabia (16.32% a year) and India (15.90% a year) are the fastest-growing countries in the top 12, and most of their campuses are first-of-a-kind designs in hot climates where cooling plant and water use must be simulated before approval. Design spending in the two countries rises from USD 325.23 million in 2025 to USD 1.44 billion in 2035.
How Much Does Data Center Design Cost per Megawatt?
New-build design costs about USD 429,000 per MW of IT capacity in 2025, 3.80% of a USD 11.30 million facility cost per MW, in the DC Market Insights model.
| Design year | Facility cost per MW, year of completion (USD million) | Design fee, % of facility cost | Design fee per MW (USD thousand) | Pre-design fee per MW (USD thousand) |
|---|---|---|---|---|
| 2020 | 8.22 | 4.20% | 345 | 45 |
| 2025 | 11.30 | 3.80% | 429 | 60 |
| 2030 | 13.10 | 3.60% | 472 | 68 |
| 2035 | 15.19 | 3.50% | 532 | 72 |
The fee per MW rises in dollars even as the percentage falls, because facility cost per MW keeps rising about 3% a year after 2026. A public anchor for the percentage is the United States federal rule that limits architect-engineer fees for the production of designs, plans, drawings and specifications to 6 percent of the estimated construction cost, under Federal Acquisition Regulation 15.404-4(c)(4)(i)(B), as applied in the General Services Administration Acquisition Manual 536.602-70. Private data center fees sit well below that cap. For a 100 MW campus in 2026, design at 3.80% of USD 11.30 million per MW comes to about USD 42.9 million.
Which Standards and Rules Shape Data Center Design?
Five rule sets shape most data center design contracts and add engineering hours to every project worth part of the USD 8.13 billion market.
- Commission Delegated Regulation (EU) 2024/1364 of 14 March 2024 set up the first phase of an EU rating scheme for data centres; operators of data centres of at least 500 kW report energy and water indicators, so designers must plan metering from day one.
- The European standard series EN 50600 (also published as ISO/IEC 22237) sets availability classes, power, cooling and security design rules for data center facilities.
- The Telecommunications Industry Association standard ANSI/TIA-942 sets rated infrastructure levels for data center design, widely used in design briefs in North America, India and the Middle East.
- ASHRAE Standard 90.4 sets the energy standard for data centers in the United States and is referenced in many state energy codes.
- Federal Acquisition Regulation 15.404-4(c)(4)(i)(B) caps architect-engineer design fees at 6 percent of estimated construction cost on United States federal projects.
Which Design Services Take the Largest Share?
MEP engineering takes 54.7% of 2025 design spending, because power and cooling systems are the most engineering-heavy part of a data center.
By Service Type: MEP Engineering Leads with 54.7%
MEP engineering is worth USD 4.45 billion in 2025 and USD 10.64 billion in 2035. Digital twin, CFD and simulation services grow fastest, at 14.93% a year, as AI halls are validated in simulation before construction.
| Service type | 2025 (USD million) | Share 2025 | 2035 (USD million) | CAGR 2025-2035 |
|---|---|---|---|---|
| Architecture and Civil-Structural Design | 2,151.24 | 26.5% | 4,789.01 | 8.33% |
| MEP Engineering | 4,445.90 | 54.7% | 10,642.24 | 9.12% |
| Digital Twin, CFD and Simulation Services | 573.66 | 7.1% | 2,305.82 | 14.93% |
| Site Selection, Feasibility and Owner’s Engineering | 960.00 | 11.8% | 2,016.00 | 7.70% |
| Total | 8,130.80 | 100.0% | 19,753.07 | 9.28% |
By Facility Type: Hyperscale and AI Campuses Lead with 52.0%
Hyperscale and AI campuses grow 11.22% a year, and their share rises to 62.0% by 2035. Enterprise, government and edge projects grow only 4.03% a year as workloads move to cloud and colocation.
| Facility type | 2025 (USD million) | Share 2025 | 2035 (USD million) | CAGR 2025-2035 |
|---|---|---|---|---|
| Hyperscale and AI Campuses | 4,228.02 | 52.0% | 12,246.90 | 11.22% |
| Colocation Data Centers | 2,439.24 | 30.0% | 5,333.33 | 8.14% |
| Enterprise, Government and Edge | 1,463.54 | 18.0% | 2,172.84 | 4.03% |
| Total | 8,130.80 | 100.0% | 19,753.07 | 9.28% |
By Project Type: Greenfield Campus Design Leads with 58.3%
Greenfield campus design includes the pre-design site work and holds 58.3% of 2025 value. Renovation and retrofit design grows fastest, at 10.41% a year.
| Project type | 2025 (USD million) | Share 2025 | 2035 (USD million) | CAGR 2025-2035 |
|---|---|---|---|---|
| Greenfield Campus Design | 4,740.69 | 58.3% | 11,310.28 | 9.08% |
| Brownfield Expansion Design | 2,230.91 | 27.4% | 5,322.49 | 9.08% |
| Renovation and Retrofit Design | 1,159.20 | 14.3% | 3,120.30 | 10.41% |
| Total | 8,130.80 | 100.0% | 19,753.07 | 9.28% |
DC Exclusive: Reference-Design Fee Ladder — From USD 565,000 to USD 271,000 of Design per Megawatt
DC Market Insights modelled the design fee for a 100 MW campus completed in 2026 at USD 11.30 million of facility cost per MW (USD 1.13 billion in total), using 12 inputs: the facility cost, five fee rates by design type and six discipline shares. All values are DC Market Insights estimates, not quoted prices.
| Design type | Fee, % of facility cost | Fee for 100 MW (USD million) | Fee per MW (USD thousand) |
|---|---|---|---|
| First-of-a-kind AI campus, liquid-cooled, 130 kW+ racks | 5.0% | 56.5 | 565 |
| Enterprise or government build, single tenant | 4.5% | 50.9 | 508 |
| Colocation campus on an operator standard | 3.8% | 42.9 | 429 |
| Hyperscale repeat of an owner reference design | 2.8% | 31.6 | 316 |
| Site adaptation of a vendor reference design with digital twin | 2.4% | 27.1 | 271 |
The ladder shows why the market grows more slowly than construction: a hyperscale owner repeating its own design pays about half the fee of a first-of-a-kind AI campus. The 3.80% colocation case, which equals the model’s 2025 average, splits by discipline as follows.
| Discipline | Share of facility cost | USD million for 100 MW |
|---|---|---|
| Site selection, feasibility and master plan | 0.40% | 4.52 |
| Architecture and civil-structural | 1.00% | 11.30 |
| Electrical engineering | 1.10% | 12.43 |
| Mechanical and liquid-cooling engineering | 0.90% | 10.17 |
| Digital twin and CFD simulation | 0.25% | 2.83 |
| Construction-phase design support | 0.15% | 1.70 |
| Total | 3.80% | 42.94 |
Electrical and mechanical engineering take 2.00 of the 3.80 points, which is why MEP engineering is the largest service line in the market tables.
Which Region Spends the Most on Data Center Design?
North America spends the most, USD 3.66 billion in 2025, and Middle East and Africa grows fastest at 14.72% a year.
| Region | 2025 (USD million) | Share 2025 | 2035 (USD million) | CAGR 2025-2035 |
|---|---|---|---|---|
| North America | 3,658.86 | 45.0% | 8,296.29 | 8.53% |
| Asia Pacific | 2,276.62 | 28.0% | 6,123.45 | 10.40% |
| Europe | 1,463.54 | 18.0% | 3,160.49 | 8.00% |
| Middle East and Africa | 325.23 | 4.0% | 1,283.95 | 14.72% |
| Latin America | 406.54 | 5.0% | 888.89 | 8.14% |
| Total | 8,130.80 | 100.0% | 19,753.07 | 9.28% |
North America Leads with 45.0% Share
North America’s USD 3.66 billion reflects the largest build pipeline and the home markets of Jacobs, AECOM, Stantec and WSP. Its share eases to 42.0% by 2035 as hyperscale owners reuse designs across more US campuses.
Asia Pacific Holds 28.0% Share
Asia Pacific grows 10.40% a year to USD 6.12 billion, led by China, Japan and India; India’s design spending grows 15.90% a year.
Europe Holds 18.0% Share
Europe’s USD 1.46 billion carries extra reporting and heat-reuse design work under EU rules, but grid limits in Frankfurt, Dublin and Amsterdam slow new campuses, so the region grows 8.00% a year.
Middle East and Africa Is the Fastest-Growing Region at 14.72%
Middle East and Africa rises from USD 325.23 million to USD 1.28 billion, driven by first-of-a-kind AI campuses in Saudi Arabia and the United Arab Emirates that pay higher fees per MW.
Latin America Holds 5.0% Share
Latin America’s USD 406.54 million is led by Brazil and Mexico, where campuses around São Paulo and Querétaro are mostly designed by international firms with local partners.
Which Countries Spend the Most on Data Center Design?
The United States spends USD 3.17 billion in 2025, 39.0% of the global market, and Saudi Arabia grows fastest among the top 12 at 16.32% a year.
| Rank | Country | Region | 2025 (USD million) | 2035 (USD million) | CAGR 2025-2035 |
|---|---|---|---|---|---|
| 1 | United States | North America | 3,171.01 | 7,012.34 | 8.26% |
| 2 | China | Asia Pacific | 813.08 | 1,975.31 | 9.28% |
| 3 | Japan | Asia Pacific | 365.89 | 908.64 | 9.52% |
| 4 | Canada | North America | 325.23 | 829.63 | 9.82% |
| 5 | United Kingdom | Europe | 325.23 | 671.60 | 7.52% |
| 6 | Germany | Europe | 284.58 | 632.10 | 8.31% |
| 7 | India | Asia Pacific | 203.27 | 888.89 | 15.90% |
| 8 | Australia | Asia Pacific | 203.27 | 493.83 | 9.28% |
| 9 | Brazil | Latin America | 203.27 | 434.57 | 7.89% |
| 10 | Malaysia | Asia Pacific | 146.35 | 434.57 | 11.50% |
| 11 | Saudi Arabia | Middle East and Africa | 121.96 | 553.09 | 16.32% |
| 12 | Mexico | Latin America | 105.70 | 276.54 | 10.10% |
India is the fastest-growing large country at 15.90% a year, with design spending rising to USD 888.89 million by 2035 as campuses in Mumbai, Chennai and Hyderabad move to AI-ready designs.
How Could the 2035 Data Center Design Forecast Change?
The 2035 value ranges from USD 15.11 billion to USD 23.52 billion depending on how much capacity is completed and how far fee rates fall.
| Scenario | Assumptions from 2027 | 2035 (USD million) | CAGR 2025-2035 |
|---|---|---|---|
| Low | Completions 20% lower, fee rate 0.3 points lower from 2026, renovation 10% lower | 15,112.19 | 6.39% |
| Base | Completions 16.0 GW (2027) to 27.5 GW (2036), fee 3.72% to 3.50% | 19,753.07 | 9.28% |
| High | Completions 15% higher, fee rate 0.2 points higher from 2026, renovation 10% higher | 23,520.55 | 11.21% |
Who Are the Leading Data Center Design Firms?
Jacobs leads with about 6% of 2025 value, and the top five firms hold about 20%, a DC Market Insights assessment based on reported backlogs, sector rankings and project awards; the rest is spread across hundreds of regional engineering firms.
- Jacobs
- AECOM
- Stantec (including Environmental Systems Design)
- WSP Global
- Arcadis
- Corgan
- HDR
- Black & Veatch
- Burns & McDonnell
- Syska Hennessy Group
- Arup
- Ramboll
- Sweco
- Salas O’Brien
- Page Southerland Page
- kW Mission Critical Engineering
Jacobs reported a backlog of USD 28.9 billion in August 2026, up 27.3%, and is ranked first for data centers by Engineering News-Record, according to Jacobs. AECOM reported a record total backlog of USD 26.2 billion and net service revenue of USD 1.95 billion for its second fiscal quarter of 2026, according to AECOM’s May 2026 release. Stantec reported a contract backlog of CAD 9.2 billion in August 2026 and named data center projects among its sources of United States growth, according to Stantec. WSP Global reported net revenues of CAD 4.27 billion for the second quarter of 2026, according to WSP. Architecture-led firms such as Corgan and engineering-led firms such as Syska Hennessy Group and kW Mission Critical Engineering compete for hyperscale and colocation programmes, while Arup, Ramboll and Sweco are strong in Europe.
Recent Developments
Six dated events from 2026 show demand, partnerships and backlog growth among data center design firms.
- In March 2026, NVIDIA released the Vera Rubin DSX AI Factory reference design and made the Omniverse DSX Blueprint generally available, with Jacobs among the infrastructure partners (Source: NVIDIA).
- In March 2026, Jacobs said its Data Center Digital Twin solution is featured in the NVIDIA Omniverse DSX Blueprint (Source: Jacobs).
- In May 2026, AECOM reported a record total backlog of USD 26.2 billion for its second fiscal quarter (Source: AECOM).
- In August 2026, Jacobs reported fiscal third-quarter gross revenue of USD 4.1 billion, up 34.5%, and a first-place Engineering News-Record ranking for data centers (Source: Jacobs).
- In August 2026, WSP Global reported a record backlog of CAD 20.1 billion at the end of June (Source: WSP Global).
- In August 2026, Stantec said it was selected to provide architecture, engineering and integrated design services for Meta’s data center in Sturgeon County, Alberta (Source: Stantec).
Methodology: How DC Market Insights Sizes the Data Center Design Market
DC Market Insights sizes the market as design fees on the capacity due for completion one year later, plus renovation design and pre-design work, which gives USD 8.13 billion in 2025 and USD 19.75 billion in 2035.
The model in numbers: new IT capacity completed of 7.0 GW in 2021, 14.0 GW in 2026, 23.0 GW in 2031 and 27.5 GW in 2036 (DC Market Insights capacity anchors of 12.0 GW in 2025, 22 GW in 2030 and 27 GW in 2035); facility cost of USD 8.22 million per MW in 2021, USD 11.30 million in 2026 and about 3% a year more after that, the same unit values as the Data Center Market; new-build design fees of 4.20% of facility cost in 2020, 3.80% in 2025, 3.60% in 2030 and 3.50% in 2035, booked one year before completion; renovation design at 9% of renovation spend; and pre-design work at USD 45,000 to USD 72,000 per MW, booked two years before completion. Segment, regional and country shares are DC Market Insights allocations; every split sums to the total in every year.
Three bound checks test the result. Ceiling one: the new-build fee of 3.80% sits below the 6 percent federal limit on architect-engineer design fees. Ceiling two: the USD 8.13 billion market equals 1.4% of the USD 570.04 billion DC Market Insights estimate of total 2025 data center infrastructure spend. Floor: a minimum design fee of 2% on the USD 158.20 billion facility cost of 2026 completions alone gives USD 3.16 billion, well below the model’s USD 6.01 billion of new-build design. The full approach is described on the DC Market Insights research methodology page.
Table of contents
- 01Introduction
- 1.1Market Definition
- 1.2Historical Period, Base Year and Forecast Period
- 1.3Report Attributes
- 02Research Methodology
- 2.1The Completion-Lead Fee Model in Numbers
- 2.2Bound Checks: Federal 6 Percent Fee Cap, Total Infrastructure Spend Ceiling and Minimum-Fee Floor
- 03Executive Summary
- 3.1Market Snapshot, 2025, 2026 and 2035
- 3.2Key Market Statistics
- 3.3Key Takeaways
- 04What Does the Data Center Design Market Include?
- 4.1Included: Architecture, MEP Engineering, Simulation and Pre-Design Work
- 4.2Excluded: Construction, Commissioning, Software Licences and In-House Design
- 4.3How the Segments Fit Together
- 05Why Do Data Center Design Market Estimates Differ?
- 5.1Construction Value, Software and Commissioning in Broader Definitions
- 5.2Scope Comparison: What Is In and Out
- 5.3Buyers Inside the Scope
- 06Market Drivers
- 6.1AI Halls Above 100 kW per Rack Need New Power and Cooling Designs
- 6.2Jacobs, Stantec and WSP Report Record Backlogs
- 6.3Gigawatt Campuses Need Site Selection and Power Studies Years Ahead
- 07Market Trends
- 7.1The NVIDIA DSX Reference Design Turns AI Halls into Repeat Products
- 7.2Jacobs Puts a Data Center Digital Twin into the DSX Blueprint
- 7.3Engineering Firms Buy Mission-Critical Specialists
- 08Market Restraints
- 8.1Repeat Designs Cut the Fee per Megawatt Share
- 8.2Power Engineers Are Scarce and Grid Studies Take Longer
- 09Market Opportunities
- 9.1Liquid-Cooling Retrofits of Halls Built Before 2015
- 9.2Simulation-Led Design for Gulf and Indian Campuses
- 10Pricing Analysis: Data Center Design Cost per Megawatt
- 10.1Design Fee per MW and Share of Facility Cost, 2020-2035
- 10.2Federal Architect-Engineer Fee Cap
- 11Standards and Regulation
- 11.1Commission Delegated Regulation (EU) 2024/1364
- 11.2EN 50600 and ISO/IEC 22237
- 11.3ANSI/TIA-942
- 11.4ASHRAE Standard 90.4
- 11.5Federal Acquisition Regulation 15.404-4
- 12Data Center Design Market, By Service Type
- 12.1Architecture and Civil-Structural Design
- 12.2MEP Engineering
- 12.3Digital Twin, CFD and Simulation Services
- 12.4Site Selection, Feasibility and Owner's Engineering
- 13Data Center Design Market, By Facility Type
- 13.1Hyperscale and AI Campuses
- 13.2Colocation Data Centers
- 13.3Enterprise, Government and Edge
- 14Data Center Design Market, By Project Type
- 14.1Greenfield Campus Design
- 14.2Brownfield Expansion Design
- 14.3Renovation and Retrofit Design
- 15DC Exclusive: Reference-Design Fee Ladder
- 15.1Design Fee by Design Type for a 100 MW Campus
- 15.2Design Fee by Discipline
- 16Data Center Design Market, By Region
- 16.1North America
- 16.2Asia Pacific
- 16.3Europe
- 16.4Middle East and Africa
- 16.5Latin America
- 17Data Center Design Market, By Country
- 17.1United States
- 17.2China
- 17.3Japan
- 17.4Canada
- 17.5United Kingdom
- 17.6Germany
- 17.7India
- 17.8Australia
- 17.9Brazil
- 17.10Malaysia
- 17.11Saudi Arabia
- 17.12Mexico
- 18Forecast Scenarios
- 18.1Low Case
- 18.2Base Case
- 18.3High Case
- 19Competitive Insights
- 19.1Jacobs
- 19.2AECOM
- 19.3Stantec
- 19.4WSP Global
- 19.5Arcadis
- 19.6Corgan
- 19.7HDR
- 19.8Black & Veatch
- 19.9Burns & McDonnell
- 19.10Syska Hennessy Group
- 19.11Arup
- 19.12Ramboll
- 19.13Sweco
- 19.14Salas O'Brien
- 19.15Page Southerland Page
- 19.16kW Mission Critical Engineering
- 20Recent Developments
- 20.1Dated Events, March to August 2026
- Fig. 1Data Center Design Market Size, 2020-2035
- Table 1Report Attributes
- Table 2Scope Comparison: What Is In and Out
- Table 3Design Fee per MW, 2020-2035
- Table 4Market by Service Type, 2025 and 2035
- Table 5Market by Facility Type, 2025 and 2035
- Table 6Market by Project Type, 2025 and 2035
- Table 7Reference-Design Fee Ladder for a 100 MW Campus
- Table 8Design Fee by Discipline
- Table 9Market by Region, 2025 and 2035
- Table 10Top 12 Countries, 2025 and 2035
- Table 11Forecast Scenarios, 2035
About this report
Written by Amit Jain and reviewed by Deepti Agrawal, Senior Editor, Research. Figures are built top-down and bottom-up and reconciled before publication, with 2025 as the base year.
Read our methodologyHow we built this
- Historical period2020-2024
- Base year2025
- Forecast period2026-2035
- Sizing approachTop-down + bottom-up
Need more than the report?
Advisory on this market
Due diligence, site selection and market entry work, by the analysts who wrote this report.
See consulting servicesFrequently asked questions
USD 9.46 billion in 2026, up 16.4% from USD 8.13 billion in 2025, according to DC Market Insights estimates. The market is projected to reach USD 19.75 billion by 2035, a CAGR of 9.28% from 2025.
9.28% a year from 2025 to 2035, after 19.69% a year from 2020 to 2025, because completions double again while the design fee rate eases from 3.80% to 3.50% of facility cost.
USD 8.13 billion of 2025 fees cover architecture and civil-structural design, MEP engineering, digital twin and CFD simulation, and site selection, feasibility and owner’s engineering. Construction, commissioning and in-house owner design are excluded.
About USD 429,000 per MW of IT capacity in 2025, or 3.80% of a USD 11.30 million facility cost per MW (DC Market Insights estimate). First-of-a-kind AI campuses reach about USD 565,000 per MW.
54.7% of 2025 value, or USD 4.45 billion, goes to MEP engineering. Digital twin, CFD and simulation services grow fastest, at 14.93% a year to USD 2.31 billion by 2035.
45.0% of 2025 value, or USD 3.66 billion, is spent in North America. Middle East and Africa grows fastest at 14.72% a year, and Saudi Arabia is the fastest-growing country in the top 12.
About 6% of 2025 value is held by Jacobs (DC Market Insights assessment). AECOM, Stantec, WSP Global and Arcadis follow; the top five hold about 20%, and hundreds of regional engineering firms share the rest.
A hyperscale repeat of an owner reference design costs about 2.8% of facility cost, against 5.0% for a first-of-a-kind AI campus (DC Market Insights). NVIDIA released its DSX AI factory reference design in March 2026.
About one year for detailed design and two years for site selection in the DC Market Insights model, so 2025 design fees of USD 6.01 billion track the 14.0 GW of IT capacity due for completion in 2026.
USD 9.46 billion in 2026 is the DC Market Insights figure for design fees paid to outside firms only. Estimates that add design-build construction value, commissioning, stand-alone software or in-house design teams are larger.
Licences, delivery and payment
Which licence should I choose?
Single User is a view-only PDF for one person. Multi User adds a printable PDF and the Excel data for unlimited users at one location. Enterprise covers your whole company and includes 100 free analyst hours.
How and when will I receive the report?
By email, within 24–48 business hours of payment, in the formats of your licence.
How can I pay?
Securely through PayPal: with a PayPal account, a debit or credit card, or PayPal Pay Later where available. Prices are in US dollars.
Can I see a sample first?
Yes. Request a free sample and we will email it to you.
Can the report be tailored to my needs?
Yes. We can add countries, segments or data cuts. Talk to an analyst about the scope you need.
Can I get an invoice or pay against a purchase order?
Write to sales@dcmarketinsights.com and our team will help.