
Data Center Renovation Market Size, Share & Forecast to 2035
Market at a glance
The Data Center Renovation market was worth USD 12.88 billion in 2025 and is forecast to reach USD 34.67 billion by 2035, growing at a 10.41% CAGR. North America accounts for 41% of the market.
 By Amit Jain, Senior Consultant, ICT & Emerging Technologies
 Reviewed by Deepti Agrawal
Last updated 13 Oct 2026
Base year 2025 PDF + Excel
Reviewed by Deepti Agrawal
Last updated 13 Oct 2026
Base year 2025 PDF + Excel
Source: DC Market Insights analysis
Key findings
Ageing Facilities: 27.5% of Operators Run Sites 16 Years or Older
Liquid Cooling Moves into Existing Halls
Live-Site Disruption Makes Upgrades Costly
AI-Ready Retrofits Add USD 2.56 billion by 2030
What is inside the report
- 01Introduction
- 02Research Methodology
- 03Executive Summary
- 04Market Scope: What Does the Data Center Renovation Market Cover?
- 05Why Do Data Center Renovation Market Estimates Differ?
- 06Market Drivers
- 07Market Trends
- 08Market Challenges
- 09Market Opportunities
- 10Pricing Analysis: Data Center Renovation Cost per MW
- 21chapters
- 2020-2024Historical period
- 2026-2035Forecast period
- 15Companies profiled
Regional insights
- North America41%
- Europe27%
- Asia Pacific25%
- Middle East and Africa3.3%
- Latin America3.7%
Segmentation
Companies profiled
- Schneider Electric
- Vertiv
- Eaton
- Johnson Controls
- Legrand
- ABB
- Siemens
- STULZ
- technotrans
- Comfort Systems USA
- EMCOR Group
- CBRE
- Jacobs
- Turner Construction
- Mercury Engineering
Recent developments
the European Commission proposed an EU sustainability rating scheme for data centers above 500 kW, with first labels expected in 2027 (Source: European Commission).
the Central Statistics Office reported that data centers used 23% of Ireland's metered electricity in 2025 (Source: CSO).
Vertiv reported a backlog of USD 15.0 billion at the end of 2025, up 109% (Source: Vertiv filing).
Schneider Electric reported FY2025 revenues of EUR 40.15 billion and triple-digit growth in its pure data center segment in the fourth quarter (Source: Schneider Electric).
Ireland's CRU published its data center connection policy requiring on-site or nearby generation or storage (Source: CRU).
Turner & Townsend reported 5.5% cost inflation for traditional data centers in 2025 (Source: Turner & Townsend).
Full analysis
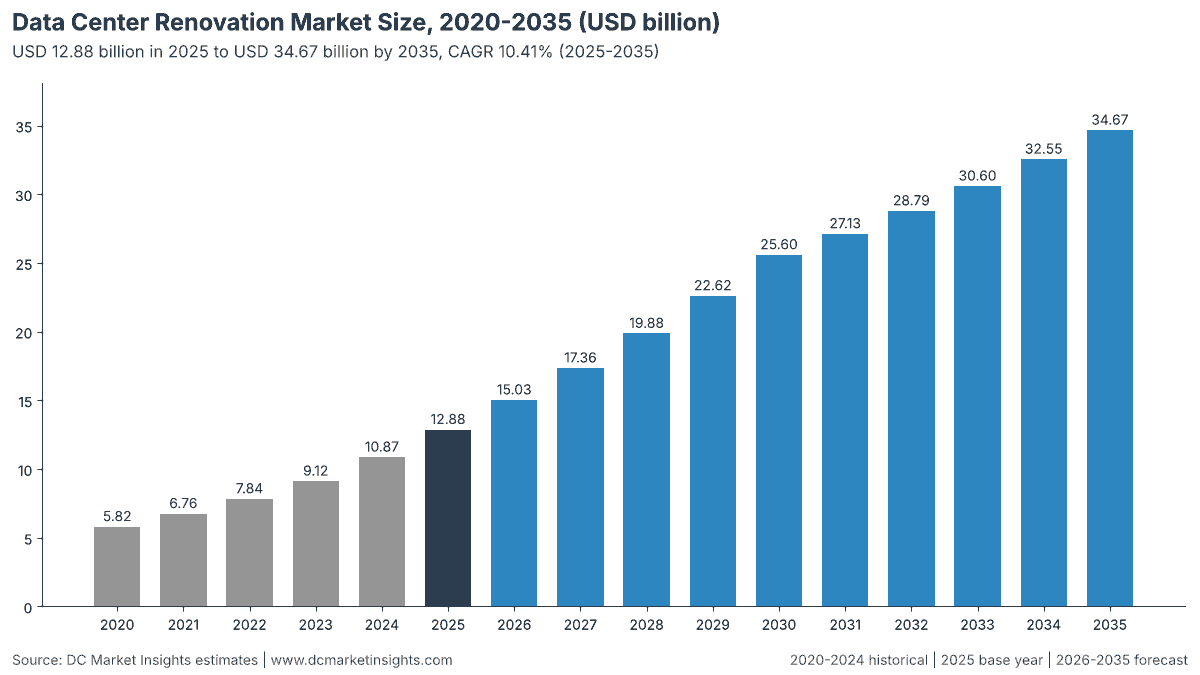
The Data Center Renovation Market is valued at USD 15.03 billion in 2026 and is projected to reach USD 34.67 billion by 2035, up from USD 12.88 billion in 2025, a CAGR of 10.41% from 2025 to 2035 (DC Market Insights estimate). The market covers third-party spending to renovate, retrofit and modernise existing data center facilities: power and electrical upgrades such as uninterruptible power supply (UPS) and switchgear replacement, cooling retrofits including direct liquid cooling (DLC) added to existing halls, white space and densification fit-out, building shell and structural works, and fire safety, security and controls upgrades, together with the design, installation and commissioning work that delivers them. The build receipt: about 55.0 gigawatts (GW) of IT capacity was ten or more years old in 2025, and renovating 6.5% of it, or 3,575 megawatts (MW), at USD 3.20 million per MW gives USD 11.44 billion, while 0.80 GW of younger halls retrofitted for liquid cooling at USD 1.80 million per MW adds USD 1.44 billion. Cooling retrofits are the fastest-growing renovation type at 12.12% a year because operators add liquid cooling to halls built for 8 to 9 kilowatt (kW) racks, and Asia Pacific is the fastest-growing region at 12.44% a year as China, Japan and Singapore set power usage effectiveness (PUE) targets for existing sites.
Key Market Statistics: How Big Is the Data Center Renovation Market in 2026?
DC Market Insights values the Data Center Renovation Market at USD 15.03 billion in 2026, 16.7% above the USD 12.88 billion of 2025.
- Market size 2025: USD 12.88 billion
- Market size 2026: USD 15.03 billion
- Market size 2030: USD 25.60 billion
- Market size 2035: USD 34.67 billion
- CAGR 2025-2035: 10.41% in the base case, 6.57% in the low case and 13.38% in the high case
- Largest renovation type: power and electrical upgrades, 31.0% of 2025 value (USD 3.99 billion)
- Fastest-growing renovation type: cooling retrofits, 12.12% a year, reaching 35.0% of value by 2035
- Fastest-growing data center type: hyperscale and cloud data centers, 14.28% a year
- Leading region: North America, 41.0% of 2025 value (USD 5.28 billion)
- Fastest-growing region: Asia Pacific, 12.44% a year
- Largest country: the United States, USD 4.92 billion in 2025 (38.2% of global value)
- Market leader: Schneider Electric, followed by Vertiv and Eaton (DC Market Insights assessment)
Executive Summary
The Global Data Center Renovation Market size was valued at USD 5.82 billion in 2020, reached USD 12.88 billion in 2025, and is anticipated to reach USD 34.67 billion by 2035, at a CAGR of 10.41% during the forecast period.
| Report attribute | Details |
|---|---|
| Historical Period | 2020-2024 |
| Base Year | 2025 |
| Forecast Period | 2026-2035 |
| Data Center Renovation Market Size 2025 | USD 12.88 Billion |
| Data Center Renovation Market Size 2026 | USD 15.03 Billion |
| Data Center Renovation Market, CAGR | 10.41% |
| Data Center Renovation Market Size 2035 | USD 34.67 Billion |
The market grew at 17.24% a year between 2020 and 2025, and 2025 alone added 18.5% over the USD 10.87 billion of 2024 as the ten-year-old installed base rose from 51.6 GW to 55.0 GW and the share renovated each year climbed from 6.3% to 6.5%. Growth eases to 10.41% a year from 2025 to 2035 because the liquid-cooling catch-up in younger halls peaks at 2.5 GW in 2030 and then falls to 2.0 GW in 2035, while the core renovation pool keeps rising with the ageing base, reaching 116.0 GW of ten-year-old capacity and 8,120 MW renovated in 2035.
Market Scope: What Does the Data Center Renovation Market Cover?
The Data Center Renovation Market covers renovation, retrofit and modernisation projects in data centers that are already operating, valued at the price the owner or operator pays its contractors and suppliers in current US dollars; DC Market Insights sizes it at USD 12.88 billion in 2025 and USD 15.03 billion in 2026.
Included. Replacement and upgrade of UPS systems, batteries, switchgear, power distribution and generators in existing buildings; cooling retrofits such as chiller and computer room air handler replacement, containment, economiser conversions and DLC or rear-door heat exchangers added to existing halls; white space refurbishment and densification fit-out, including raised floor and busway changes for higher rack densities; roof, structural and envelope works needed to carry new plant; fire detection, suppression, physical security, building management system (BMS) and data center infrastructure management (DCIM) upgrades done as part of a renovation; and the design, engineering, installation, project management and commissioning of these projects.
Excluded. New data center construction on greenfield sites, conversion of offices or warehouses into data centers, IT hardware refresh (servers, storage, network equipment), routine planned maintenance contracts, decommissioning and IT asset disposal, and land and electricity costs. Related spending sits in other DC Market Insights reports, such as the Data Center Transformation Market for IT modernisation services and the Data Center Precision Air Conditioning Market for precision cooling units.
How the segments fit together. Renovation type, service type and data center type each split the same total, so every dimension sums to USD 12.88 billion in 2025 and USD 34.67 billion in 2035. Regions and countries are allocations of the same total by the location of the renovated facility.
Why Do Data Center Renovation Market Estimates Differ?
Public estimates for data center renovation differ by more than 1.5 times because definitions differ; DC Market Insights counts only facility works in existing sites and values the market at USD 15.03 billion in 2026.
Broader definitions add IT hardware refresh, migration and consolidation services, conversions of non-data-center buildings, routine maintenance contracts and sometimes whole new halls built on existing campuses. Each of those lifts the headline figure but mixes renovation with new capacity or recurring operations. Narrower definitions count only cooling or only power retrofits, which gives figures under USD 4 billion. Terms such as data center modernization, data center refurbishment, legacy data center upgrade, brownfield retrofit and AI-ready retrofit are covered here when the work is on facility infrastructure in an operating site; server refresh, cloud migration and greenfield expansion are outside this report.
| Element | In this report | Why |
|---|---|---|
| Power, cooling, white space, shell and controls works in existing sites | Yes, USD 12.88 billion in 2025 | Core renovation spend |
| Liquid-cooling retrofits in halls under ten years old | Yes, USD 1.44 billion in 2025 | Facility work in operating sites |
| Design, engineering and commissioning of retrofits | Yes, USD 2.58 billion in 2025 | Part of project cost |
| Server, storage and network refresh | No | IT hardware, not facility |
| Conversion of offices or warehouses into data centers | No | Adds new capacity |
| Routine maintenance contracts | No | Recurring operations spend |
Buyers inside the scope include enterprises and governments with their own server rooms and data centers, small and medium-sized enterprises (SMEs) that renovate single-site facilities, colocation operators, hyperscale and cloud providers, and telecom and edge operators.
Market Drivers: What Drives the Data Center Renovation Market?
An ageing installed base, higher rack densities and new efficiency rules drive a 10.41% annual rise in renovation spending from 2025 to 2035.
Ageing Facilities: 27.5% of Operators Run Sites 16 Years or Older
The Uptime Institute Global Data Center Survey 2025 found that 27.5% of respondents work in facilities that are 16 years or older, and the 2024 survey found that 47% work primarily with a facility more than 11 years old. DC Market Insights estimates that the ten-year-old installed base rises from 55.0 GW in 2025 to 116.0 GW in 2035, so the pool of capacity due for a mid-life renovation more than doubles. Uptime notes that efficiency pressure is forcing some older data centers to either close or undertake major retrofits, which turns ageing capacity into project demand worth USD 11.44 billion in 2025.
Higher Rack Densities: 29% of Operators Upgrade Existing Halls
In July 2024, Uptime reported that 29% of operators are upgrading their existing data hall space for high-density cabinets. Artificial intelligence (AI) servers need 30 kW to over 100 kW per rack, against a typical rack of almost 9 kW in 2025. DC Market Insights estimates that 0.80 GW of halls under ten years old were retrofitted for liquid cooling in 2025, worth USD 1.44 billion, rising to 2.50 GW and USD 4.00 billion in 2030.
Electricity Demand and Efficiency: 415 TWh in 2024
The International Energy Agency (IEA) reports that data centers used about 415 terawatt-hours (TWh) in 2024 and expects around 945 TWh by 2030. With an industry weighted average PUE of 1.54 in 2025, every 0.1 point of PUE cut in a 10 MW legacy site saves about 8.8 gigawatt-hours (GWh) a year, so efficiency retrofits pay back on power cost and regulation. Efficiency-driven cooling and power upgrades account for about 61.0% of 2025 renovation value, or USD 7.86 billion.
Market Trends: How Is Data Center Renovation Changing?
Liquid cooling, modular retrofit kits and densification of colocation halls move cooling retrofits from 30.0% of renovation value in 2025 to 35.0% in 2035.
Liquid Cooling Moves into Existing Halls
In December 2023, Equinix extended advanced liquid cooling support to more than 100 data centers in more than 45 metros, and Digital Realty offers power densities from 30 kW to 150 kW per rack at 170 sites in 33 markets. The Uptime Cooling Systems Survey 2024 found that 22% of respondents use DLC in some form. DC Market Insights estimates that cooling retrofits grow from USD 3.86 billion in 2025 to USD 12.13 billion in 2035.
Plug-and-Play Retrofit Units Shorten Projects
In April 2024, technotrans launched a plug-and-play liquid-cooling retrofit unit for existing server infrastructure with a first order in the single-digit EUR million range. Packaged coolant distribution and rear-door units cut on-site work, which keeps installation and construction at about 32.0% to 33.0% of value through 2035.
Density Headroom Stays Large
Uptime’s 2025 survey shows the average modal rack density at almost 9 kW, up from 8.3 kW in 2024. With most halls still built for air cooling, white space and densification fit-out grows from USD 2.19 billion in 2025 to USD 5.55 billion in 2035.
Market Challenges: What Holds the Data Center Renovation Market Back?
Disruption risk in live facilities and 5.5% construction cost inflation slow renovation decisions; DC Market Insights puts the low case at USD 24.33 billion in 2035.
Live-Site Disruption Makes Upgrades Costly
Uptime’s 2024 survey notes that for legacy data centers, more substantial upgrades are often cost-prohibitive and disruptive. Work inside an operating hall needs temporary power and cooling, phased cut-overs and night shifts, which DC Market Insights estimates adds 15% to 25% to the cost per MW renovated compared with a vacant building. Some owners close small sites instead, which caps the renovation rate at about 7.5% of the ageing base in 2030.
Construction Inflation Raises Project Costs
Turner & Townsend reports cost inflation for traditional data centres averaging 5.5 percent in 2025. DC Market Insights raises the cost per MW renovated from USD 3.20 million in 2025 to USD 3.90 million in 2035, but higher prices also delay marginal projects: at a 5.5% renovation rate and USD 3.50 million per MW, the 2035 market would be USD 24.33 billion.
Market Opportunities: Where Are the New Revenue Pools?
AI-ready retrofits and compliance upgrades in Europe and Asia Pacific add about USD 21.79 billion of annual renovation spending between 2025 and 2035.
AI-Ready Retrofits Add USD 2.56 billion by 2030
Uptime’s 2025 survey found that more than 80% of operators have no racks above 30 kW, so most existing halls need new cooling and power distribution to host AI servers. DC Market Insights estimates that liquid-cooling retrofits in younger halls rise from USD 1.44 billion in 2025 to USD 4.00 billion in 2030, an increase of USD 2.56 billion.
Compliance Upgrades in Europe and Asia Pacific Reach USD 19.07 billion by 2035
Germany, China, Japan and Singapore set PUE targets for existing sites (see Standards and Regulation). DC Market Insights estimates that Europe and Asia Pacific together grow from USD 6.70 billion in 2025 to USD 19.07 billion in 2035, with Asia Pacific the fastest region at 12.44% a year.
Pricing: How Much Does Data Center Renovation Cost per MW?
A full mid-life renovation of power and cooling costs about USD 3.20 million per MW of IT capacity in 2025, and a liquid-cooling retrofit of a younger hall about USD 1.80 million per MW (DC Market Insights estimates).
| Year | Full renovation, USD million per MW | Liquid-cooling retrofit, USD million per MW | MW renovated |
|---|---|---|---|
| 2020 | 2.60 | 1.90 | 2,200 |
| 2025 | 3.20 | 1.80 | 3,575 |
| 2030 | 3.60 | 1.60 | 6,000 |
| 2035 | 3.90 | 1.50 | 8,120 |
Public anchors: the Turner & Townsend Data Centre Cost Index 2025-26 puts new-build costs at USD 15.2 per watt in Tokyo, USD 12.0 in London and USD 11.6 in Frankfurt, or USD 11.6 million to USD 15.2 million per MW, and reports a 7-10 percent construction cost premium for AI data centers in the US. A full renovation at USD 3.20 million per MW is about 25% to 30% of new-build cost because the land, shell and grid connection are reused. Liquid-cooling retrofit costs fall from USD 1.90 million to USD 1.50 million per MW as packaged units replace custom pipework.
Standards and Regulation: Which Rules Force Data Center Renovation?
PUE limits for existing sites in Germany, China and Japan and EU reporting for sites of 500 kW or more turn efficiency upgrades into compliance work worth part of the USD 12.88 billion 2025 market.
- Germany Energy Efficiency Act (Energieeffizienzgesetz, EnEfG) §11: data centers that started operating before 1 July 2026 must reach a PUE of 1.5 or lower from 1 July 2027 and 1.3 or lower from 1 July 2030; new sites from 1 July 2026 need 1.2 or lower.
- EU Energy Efficiency Directive (EED) and Delegated Regulation (EU) 2024/1364: operators with installed IT power demand of at least 500 kW report energy and water indicators by 15 September 2024, then by 15 May 2025 and every year. On 21 September 2026 the European Commission proposed an EU rating scheme; the first labels are expected in 2027.
- China Special Action Plan for Green and Low-Carbon Data Centers (July 2024): the national average PUE must fall below 1.5 by end-2025, new and renovated large sites must reach 1.25, and the plan calls for energy-saving retrofits of inefficient and old, small, scattered data centers.
- Japan Ministry of Economy, Trade and Industry (METI): operators have a benchmark of PUE 1.4 or lower by fiscal year 2030.
- Singapore Infocomm Media Development Authority (IMDA) Green DC Roadmap (May 2024): aims to uplift energy efficiency of all data centers, existing sites included.
- Brazil REDATA (Provisional Measure 1,318 of September 2025): suspends federal taxes on IT equipment for companies that install or modernise data centers.
Market Segmentation: Which Segment Leads the Data Center Renovation Market?
Power and electrical upgrades lead the Data Center Renovation Market with USD 3.99 billion, or 31.0% of 2025 value, while cooling retrofits grow fastest at 12.12% a year.
By Renovation Type: Power and Electrical Upgrades Lead with 31.0%
UPS, battery and switchgear replacement reaches end of life every 10 to 15 years, so power work leads in 2025; cooling retrofits overtake it by 2035 with USD 12.13 billion as liquid cooling spreads.
| Renovation type | 2025 (USD million) | Share 2025 | 2035 (USD million) | CAGR 2025-2035 |
|---|---|---|---|---|
| Power and Electrical Upgrades | 3,992.80 | 31.0% | 10,053.72 | 9.67% |
| Cooling Retrofits | 3,864.00 | 30.0% | 12,133.80 | 12.12% |
| White Space and Densification Fit-Out | 2,189.60 | 17.0% | 5,546.88 | 9.74% |
| Building Shell and Structural Works | 1,288.00 | 10.0% | 2,773.44 | 7.97% |
| Fire Safety Security and Controls Upgrades | 1,545.60 | 12.0% | 4,160.16 | 10.41% |
By Service Type: Equipment Supply Leads with 48.0%
Equipment supply takes USD 6.18 billion in 2025; project management and commissioning grows fastest at 11.72% a year because live-site work needs more phasing and testing.
| Service type | 2025 (USD million) | Share 2025 | 2035 (USD million) | CAGR 2025-2035 |
|---|---|---|---|---|
| Equipment Supply | 6,182.40 | 48.0% | 16,293.96 | 10.18% |
| Installation and Construction | 4,121.60 | 32.0% | 11,440.44 | 10.75% |
| Design and Engineering | 1,545.60 | 12.0% | 3,813.48 | 9.45% |
| Project Management and Commissioning | 1,030.40 | 8.0% | 3,120.12 | 11.72% |
By Data Center Type: Enterprise Data Centers Lead with 46.0%
Enterprise sites are the oldest part of the base and spend USD 5.92 billion in 2025; hyperscale and cloud data centers grow fastest at 14.28% a year as their 2015-2020 campuses reach mid-life.
| Data center type | 2025 (USD million) | Share 2025 | 2035 (USD million) | CAGR 2025-2035 |
|---|---|---|---|---|
| Enterprise Data Centers | 5,924.80 | 46.0% | 12,480.48 | 7.73% |
| Colocation Data Centers | 3,992.80 | 31.0% | 11,787.12 | 11.43% |
| Hyperscale and Cloud Data Centers | 2,189.60 | 17.0% | 8,320.32 | 14.28% |
| Edge and Telecom Data Centers | 772.80 | 6.0% | 2,080.08 | 10.41% |
DC Exclusive: The Ageing-Base Renovation Model and Renovation Type × Data Center Type Matrix
The DC Market Insights Ageing-Base Renovation Model sizes the market from 12 inputs: installed IT capacity in 2010, 2015, 2020 and 2025, the renovation rate and cost per MW at four anchor years, and liquid-cooling retrofit MW and cost per MW; it gives USD 12.88 billion in 2025.
The matrix below splits 2025 value by renovation type and data center type (USD million). Enterprise power upgrades are the largest single cell at USD 1.86 billion.
| Renovation type | Enterprise Data Centers | Colocation Data Centers | Hyperscale and Cloud Data Centers | Edge and Telecom Data Centers | Total |
|---|---|---|---|---|---|
| Power and Electrical Upgrades | 1,858.50 | 1,220.57 | 672.17 | 241.56 | 3,992.80 |
| Cooling Retrofits | 1,643.57 | 1,182.22 | 804.24 | 233.97 | 3,864.00 |
| White Space and Densification Fit-Out | 887.74 | 778.61 | 412.67 | 110.58 | 2,189.60 |
| Building Shell and Structural Works | 753.86 | 354.66 | 101.76 | 77.72 | 1,288.00 |
| Fire Safety Security and Controls Upgrades | 781.13 | 456.74 | 198.76 | 108.97 | 1,545.60 |
| Total | 5,924.80 | 3,992.80 | 2,189.60 | 772.80 | 12,880.00 |
Regional Insights: Which Region Leads the Data Center Renovation Market?
North America leads with USD 5.28 billion, or 41.0% of 2025 value, and Asia Pacific is the fastest-growing region at 12.44% a year to USD 10.40 billion by 2035.
North America Leads with 41.0% Share
North America spends USD 5.28 billion in 2025, rising to USD 12.83 billion by 2035 at 9.28% a year. The US Department of Energy (DOE) and Lawrence Berkeley National Laboratory (LBNL) report that US data centers used 176 TWh in 2023, about 4.4% of US electricity, and Schneider Electric estimates that about 36% of US data centers are more than 10 years old. Canada has an estimated 239 data centers (Canada Energy Regulator, CER).
Europe Holds 27.0% Share
Europe spends USD 3.48 billion in 2025 and USD 8.67 billion in 2035, growing 9.56% a year. Germany’s EnEfG sets PUE 1.5 for existing sites from July 2027. The UK government designated data centers as Critical National Infrastructure in September 2024. In the Netherlands, data centers use 4.6% of national electricity (Statistics Netherlands, CBS), in Ireland 23% of metered electricity in 2025 (Central Statistics Office, CSO), and the Commission for Regulation of Utilities (CRU) requires new connections to bring on-site or nearby generation or storage. France has about 300 data centers in 2026 (RTE).
Asia Pacific Holds 25.0% Share
Asia Pacific spends USD 3.22 billion in 2025 and grows fastest at 12.44% a year to USD 10.40 billion. China’s 2024 action plan requires retrofits of old sites, Singapore has 1.4 GW in more than 70 data centers under the IMDA efficiency roadmap, India’s capacity reached 1.57 GW in August 2026, and the Australian Energy Market Operator (AEMO) expects data centers to use about 12 TWh by 2030.
Middle East and Africa Holds 3.3% Share
The Middle East and Africa spends USD 425.04 million in 2025, rising to USD 1.32 billion at 11.98% a year. The region’s base is young, so most demand comes from power resilience: Teraco in South Africa is building a 120 MW solar PV plant to supply its sites, while new AI campuses such as stc and HUMAIN’s up to 1 GW in Saudi Arabia and the first 200 MW of Stargate UAE will need retrofits after 2035.
Latin America Holds 3.7% Share
Latin America spends USD 476.56 million in 2025 and USD 1.46 billion in 2035, growing 11.82% a year, led by Brazil, where REDATA tax relief covers modernised data centers, and by Mexico.
Country Analysis: Which Countries Spend the Most on Data Center Renovation?
The United States spends the most, USD 4.92 billion in 2025 or 38.2% of global value, followed by China at USD 1.22 billion.
| Rank | Country | Region | 2025 (USD million) | 2035 (USD million) | CAGR 2025-2035 |
|---|---|---|---|---|---|
| 1 | United States | North America | 4,920.16 | 11,648.45 | 9.00% |
| 2 | China | Asia Pacific | 1,223.60 | 4,333.50 | 13.48% |
| 3 | Germany | Europe | 772.80 | 1,872.07 | 9.25% |
| 4 | Japan | Asia Pacific | 747.04 | 2,288.09 | 11.84% |
| 5 | United Kingdom | Europe | 708.40 | 1,733.40 | 9.36% |
| 6 | France | Europe | 412.16 | 1,005.37 | 9.33% |
| 7 | Canada | North America | 360.64 | 1,178.71 | 12.57% |
| 8 | Netherlands | Europe | 334.88 | 762.70 | 8.58% |
| 9 | Australia | Asia Pacific | 296.24 | 901.37 | 11.77% |
| 10 | Singapore | Asia Pacific | 218.96 | 658.69 | 11.64% |
| 11 | South Korea | Asia Pacific | 206.08 | 693.36 | 12.90% |
| 12 | India | Asia Pacific | 193.20 | 1,040.04 | 18.33% |
India is the fastest-growing of the top 12 at 18.33% a year, from USD 193.20 million in 2025 to USD 1.04 billion in 2035, because capacity built since 2020 reaches renovation age during the forecast. China grows 13.48% a year as the 2024 plan pushes retrofits of old sites.
Forecast Scenarios: How Could the 2035 Forecast Change?
The 2035 market ranges from USD 24.33 billion in the low case to USD 45.21 billion in the high case, around a base case of USD 34.67 billion.
| Scenario | Assumptions | 2035 size | CAGR 2025-2035 |
|---|---|---|---|
| Low | 5.5% of the ageing base renovated a year, USD 3.50 million per MW, slower liquid retrofits | USD 24.33 billion | 6.57% |
| Base | 7.0% renovated a year, USD 3.90 million per MW, 2.0 GW liquid retrofits | USD 34.67 billion | 10.41% |
| High | 8.5% renovated a year, USD 4.20 million per MW, faster AI retrofits | USD 45.21 billion | 13.38% |
Competitive Insights: Who Leads the Data Center Renovation Market?
The market is fragmented: DC Market Insights estimates that Schneider Electric, Vertiv, Eaton, Johnson Controls and Legrand together hold about 22% of 2025 renovation value, based on the share of their data center service, retrofit and replacement revenue that falls on existing sites.
- Schneider Electric
- Vertiv
- Eaton
- Johnson Controls
- Legrand
- ABB
- Siemens
- STULZ
- technotrans
- Comfort Systems USA
- EMCOR Group
- CBRE
- Jacobs
- Turner Construction
- Mercury Engineering
Schneider Electric reported FY2025 revenues of EUR 40.15 billion, with its field services covering the lifecycle from commissioning to modernization and maintenance, and it sells retrofit and refurbished offers to extend asset life. Vertiv reported FY2025 net sales of USD 10.23 billion, services net sales of USD 1.84 billion and a backlog of USD 15.0 billion, up 109%. Eaton posted record 2025 sales of USD 27.4 billion with Electrical Americas orders up 16%, driven by data centers. Legrand reports that data centers were 26% of its sales in 2025. Johnson Controls earns repeat business in maintenance, retrofit and replacement from its installed base.
Contractors carry the installation share. Comfort Systems USA reports that renovation, expansion, maintenance and replacement services in existing buildings are a large part of its revenue, with technology customers at 45.0% of 2025 revenue. EMCOR Group grew 2025 revenues to USD 16.99 billion with strong growth in Network and Communications driven by data center investment. CBRE reported FY2025 revenue of USD 40.6 billion, led by outsized growth in data center services, and Jacobs named Data Center among the sectors driving growth in fiscal 2025.
Recent Developments
- In September 2026, the European Commission proposed an EU sustainability rating scheme for data centers above 500 kW, with first labels expected in 2027 (Source: European Commission).
- In July 2026, the Central Statistics Office reported that data centers used 23% of Ireland’s metered electricity in 2025 (Source: CSO).
- In February 2026, Vertiv reported a backlog of USD 15.0 billion at the end of 2025, up 109% (Source: Vertiv filing).
- In February 2026, Schneider Electric reported FY2025 revenues of EUR 40.15 billion and triple-digit growth in its pure data center segment in the fourth quarter (Source: Schneider Electric).
- In December 2025, Ireland’s CRU published its data center connection policy requiring on-site or nearby generation or storage (Source: CRU).
- In November 2025, Turner & Townsend reported 5.5% cost inflation for traditional data centers in 2025 (Source: Turner & Townsend).
More data center research is available on the DC Market Insights industry page and in the Data Center Fire Detection and Suppression Market report.
Methodology: How We Built the Data Center Renovation Market Model
DC Market Insights built the Data Center Renovation Market bottom-up from the ageing installed base, giving USD 12.88 billion in 2025 and USD 34.67 billion in 2035.
The model in numbers. Installed data center IT capacity of 40 GW in 2010, 55 GW in 2015, 80 GW in 2020 and 116 GW in 2025 gives the base that is ten or more years old in each year (55.0 GW in 2025, 80.0 GW in 2030, 116.0 GW in 2035). The share renovated each year rises from 5.5% in 2020 to 6.5% in 2025 and 7.5% in 2030, then eases to 7.0% in 2035, consistent with Uptime’s finding that 29% of operators were upgrading halls in 2024. Cost per MW renovated rises from USD 2.60 million in 2020 to USD 3.90 million in 2035. Liquid-cooling retrofits in younger halls add 0.80 GW in 2025, 2.50 GW in 2030 and 2.00 GW in 2035 at USD 1.80 million to USD 1.50 million per MW. Segment, regional and country splits are DC Market Insights allocations that sum to the total every year.
Bound checks. (1) Ceiling: new-build spending at 12.0 GW a year and about USD 10.7 million per MW is roughly USD 128 billion in 2025, so renovation at USD 12.88 billion is about 10% of new-build spending. (2) Ceiling: renovating 6.5% of the ageing base a year implies a full renovation every 15 years, in line with the 10 to 15 year life of UPS, battery and chiller plant. (3) Floor: end-of-life replacement of UPS and cooling plant alone, 55.0 GW divided by a 15-year life at USD 0.60 million per MW, gives about USD 2.20 billion, below the model’s USD 12.88 billion.
Full details of the approach are on the DC Market Insights research methodology page.
Table of contents
- 01Introduction
- 1.1Market Definition
- 1.2Historical Period, Base Year and Forecast Period
- 1.3Report Attributes
- 02Research Methodology
- 2.1The Ageing-Base Model in Numbers
- 2.2Bound Checks: New-Build Ceiling, Renovation Cycle and Replacement Floor
- 03Executive Summary
- 3.1Market Snapshot, 2025, 2026 and 2035
- 3.2Key Market Statistics
- 04Market Scope: What Does the Data Center Renovation Market Cover?
- 4.1Included: Power, Cooling, White Space, Shell, Fire Safety and Controls Works
- 4.2Excluded: New Construction, Conversions, IT Hardware Refresh, Routine Maintenance, Land and Electricity
- 4.3How the Segments Fit Together
- 05Why Do Data Center Renovation Market Estimates Differ?
- 5.1Broader and Narrower Definitions
- 5.2Scope Comparison: What Is In and Out
- 5.3Buyers Inside the Scope
- 06Market Drivers
- 6.1Ageing Facilities: 27.5% of Operators Run Sites 16 Years or Older
- 6.2Higher Rack Densities: 29% of Operators Upgrade Existing Halls
- 6.3Electricity Demand and Efficiency: 415 TWh in 2024
- 07Market Trends
- 7.1Liquid Cooling Moves into Existing Halls
- 7.2Plug-and-Play Retrofit Units Shorten Projects
- 7.3Density Headroom Stays Large
- 08Market Challenges
- 8.1Live-Site Disruption Makes Upgrades Costly
- 8.2Construction Inflation Raises Project Costs
- 09Market Opportunities
- 9.1AI-Ready Retrofits Add USD 2.56 billion by 2030
- 9.2Compliance Upgrades in Europe and Asia Pacific Reach USD 19.07 billion by 2035
- 10Pricing Analysis: Data Center Renovation Cost per MW
- 10.1Full Renovation Cost per MW
- 10.2Liquid-Cooling Retrofit Cost per MW
- 10.3MW Renovated, 2020-2035
- 10.4Public Cost Anchors: New-Build Cost per Watt
- 11Standards and Regulation
- 11.1Germany Energy Efficiency Act (EnEfG) §11
- 11.2EU Energy Efficiency Directive and Delegated Regulation (EU) 2024/1364
- 11.3China Special Action Plan for Green and Low-Carbon Data Centers
- 11.4Japan METI PUE Benchmark
- 11.5Singapore IMDA Green DC Roadmap
- 11.6Brazil REDATA
- 12Data Center Renovation Market, By Renovation Type
- 12.1Power and Electrical Upgrades
- 12.2Cooling Retrofits
- 12.3White Space and Densification Fit-Out
- 12.4Building Shell and Structural Works
- 12.5Fire Safety Security and Controls Upgrades
- 13Data Center Renovation Market, By Service Type
- 13.1Equipment Supply
- 13.2Installation and Construction
- 13.3Design and Engineering
- 13.4Project Management and Commissioning
- 14Data Center Renovation Market, By Data Center Type
- 14.1Enterprise Data Centers
- 14.2Colocation Data Centers
- 14.3Hyperscale and Cloud Data Centers
- 14.4Edge and Telecom Data Centers
- 15DC Exclusive: The Ageing-Base Renovation Model
- 15.1Model Inputs
- 15.2Renovation Type × Data Center Type Matrix, 2025
- 16Data Center Renovation Market, By Region
- 16.1North America (United States, Canada)
- 16.2Europe (Germany, United Kingdom, Netherlands, Ireland, France)
- 16.3Asia Pacific (China, Singapore, India, Australia)
- 16.4Middle East and Africa (South Africa, Saudi Arabia, United Arab Emirates)
- 16.5Latin America (Brazil, Mexico)
- 17Country Analysis
- 17.1United States
- 17.2China
- 17.3Germany
- 17.4Japan
- 17.5United Kingdom
- 17.6France
- 17.7Canada
- 17.8Netherlands
- 17.9Australia
- 17.10Singapore
- 17.11South Korea
- 17.12India
- 18Forecast Scenarios
- 18.1Low Scenario
- 18.2Base Scenario
- 18.3High Scenario
- 19Competitive Landscape
- 19.1Market Concentration: Top Five Hold About 22%
- 19.2Equipment and Service Leaders
- 19.3Contractors and Installation Share
- 20Recent Developments
- 20.1Policy and Regulation
- 20.2Company Results
- 20.3Construction Cost Inflation
- 21Company Profiles
- 21.1Schneider Electric
- 21.2Vertiv
- 21.3Eaton
- 21.4Johnson Controls
- 21.5Legrand
- 21.6ABB
- 21.7Siemens
- 21.8STULZ
- 21.9technotrans
- 21.10Comfort Systems USA
- 21.11EMCOR Group
- 21.12CBRE
- 21.13Jacobs
- 21.14Turner Construction
- 21.15Mercury Engineering
- Fig. 1Data Center Renovation Market Size, 2020-2035
- Table 1Report Attributes
- Table 2Scope Comparison
- Table 3Cost per MW Renovated, 2020-2035
- Table 4Market by Renovation Type
- Table 5Market by Service Type
- Table 6Market by Data Center Type
- Table 7Renovation Type × Data Center Type Matrix, 2025
- Table 8Top 12 Countries
- Table 9Forecast Scenarios
About this report
Written by Amit Jain and reviewed by Deepti Agrawal, Senior Editor, Research. Figures are built top-down and bottom-up and reconciled before publication, with 2025 as the base year.
Read our methodologyHow we built this
- Historical period2020-2024
- Base year2025
- Forecast period2026-2035
- Sizing approachTop-down + bottom-up
Need more than the report?
Advisory on this market
Due diligence, site selection and market entry work, by the analysts who wrote this report.
See consulting servicesFrequently asked questions
USD 15.03 billion in 2026, up from USD 12.88 billion in 2025, and DC Market Insights projects USD 34.67 billion by 2035, a CAGR of 10.41% from 2025 to 2035.
10.41% a year from 2025 to 2035, after 17.24% a year between 2020 and 2025, when the ten-year-old installed base grew to 55.0 GW and AI retrofits began.
USD 12.88 billion of 2025 spending went on renovating operating data centers: power and UPS upgrades, cooling and liquid-cooling retrofits, densification fit-out, shell works and fire, security and controls upgrades, excluding new builds and IT hardware.
31.0% of 2025 value, or USD 3.99 billion, goes to power and electrical upgrades. Cooling retrofits grow fastest at 12.12% a year and lead by 2035 with 35.0%.
About USD 3.20 million per MW of IT capacity for a full power and cooling renovation in 2025, and USD 1.80 million per MW for a liquid-cooling retrofit of a younger hall (DC Market Insights estimates).
41.0% of 2025 value, or USD 5.28 billion, is spent in North America. Asia Pacific grows fastest at 12.44% a year, reaching USD 10.40 billion by 2035.
About 22% of 2025 value is held by Schneider Electric, Vertiv, Eaton, Johnson Controls and Legrand together (DC Market Insights estimate). ABB, Siemens, STULZ, technotrans, Comfort Systems USA, EMCOR Group, CBRE, Jacobs and Turner Construction also compete.
USD 5.92 billion, or 46.0% of 2025 spending, comes from enterprise data centers. Hyperscale and cloud data centers grow fastest at 14.28% a year.
USD 15.03 billion in 2026 is the DC Market Insights figure for facility works in operating sites only. Broader estimates add IT hardware refresh, migration services, building conversions and maintenance contracts, so headline figures can differ by more than 1.5 times.
PUE 1.5 from 1 July 2027 and 1.3 from 1 July 2030 apply to existing German data centers under the EnEfG; China targets an average PUE below 1.5 by end-2025 and Japan 1.4 by fiscal 2030, pushing retrofits of older sites.
Licences, delivery and payment
Which licence should I choose?
Single User is a view-only PDF for one person. Multi User adds a printable PDF and the Excel data for unlimited users at one location. Enterprise covers your whole company and includes 100 free analyst hours.
How and when will I receive the report?
By email, within 24–48 business hours of payment, in the formats of your licence.
How can I pay?
Securely through PayPal: with a PayPal account, a debit or credit card, or PayPal Pay Later where available. Prices are in US dollars.
Can I see a sample first?
Yes. Request a free sample and we will email it to you.
Can the report be tailored to my needs?
Yes. We can add countries, segments or data cuts. Talk to an analyst about the scope you need.
Can I get an invoice or pay against a purchase order?
Write to sales@dcmarketinsights.com and our team will help.