
Data Center Water Treatment Market Size, Share & Forecast to 2035
Market at a glance
The Data Center Water Treatment market was worth USD 461.9 million in 2025 and is forecast to reach USD 1,770.0 million by 2035, growing at a 14.41% CAGR.
 By Amit Jain, Senior Consultant, ICT & Emerging Technologies
 Reviewed by Deepti Agrawal
Last updated 18 Oct 2026
Base year 2025 PDF + Excel
Key findings
Zero-Water Cooling Designs at Microsoft and NVIDIA
What is inside the report
- 01Introduction
- 02Research Methodology
- 03Executive Summary
- 04What Does Data Center Water Treatment Include?
- 05Why Do Data Center Water Treatment Market Estimates Differ?
- 06Market Drivers
- 07Market Trends
- 08Market Restraints
- 09Market Opportunities
- 10Pricing Analysis: Data Center Water Treatment Cost per MW
- 20chapters
- 2020-2024Historical period
- 2026-2035Forecast period
- —Companies profiled
Segmentation
Recent developments
the governor of California signed AB 2469 and AB 2619 on data center water use (Source: Office of the Governor of California).
Ecolab closed its acquisition of CoolIT Systems and set a USD 4 billion 2030 sales target for Global High-Tech (Source: Ecolab).
Solenis became an approved service provider in Dow's Coolant Care Network for direct-to-chip cooled data centers (Source: Solenis).
New York City's 31-day Legionella testing rule for cooling towers took effect (Source: New York City Department of Health and Mental Hygiene).
Veolia reported its Data Center Resource 360 offer and its reclaimed water work with Amazon (Source: Veolia first-quarter 2026 results).
Veolia set a target of more than EUR 1 billion of annual data center and microelectronics revenue by 2030 (Source: Veolia).
Full analysis
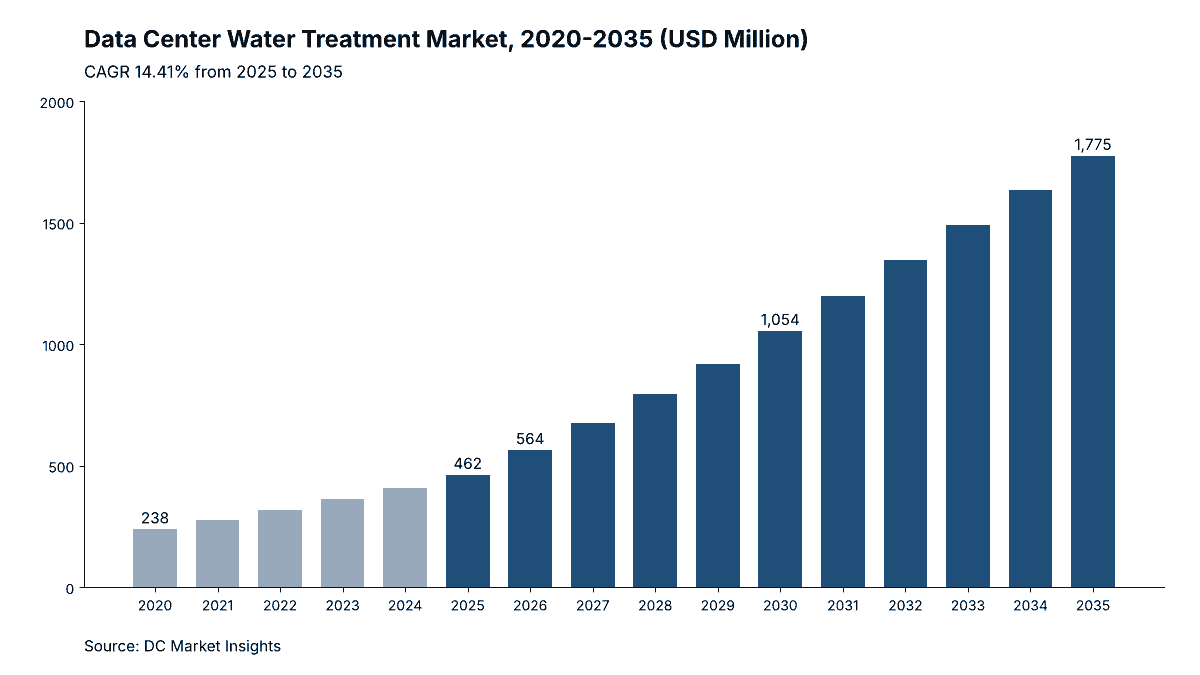
The Data Center Water Treatment Market is valued at USD 564.06 million in 2026 and is projected to reach USD 1.77 billion by 2035, up from USD 461.89 million in 2025, a compound annual growth rate (CAGR) of 14.41% from 2025 to 2035 (DC Market Insights estimate). The money in this market is set by how many litres a data center circulates and how tightly regulators watch them: NVIDIA puts a conventional evaporative design at about 2.6 million gallons of water per megawatt (MW) of IT load a year, and every gallon that evaporates leaves its minerals behind, so operators pay for scale and corrosion inhibitors, biocides, filtration and testing to keep cooling towers clean and free of Legionella. DC Market Insights counts 55,680 MW of evaporative-served data center capacity in 2025 and prices its treatment programme at USD 4,200 per MW a year, which gives USD 233.86 million of spend before any equipment is added. A second circuit is now growing faster than the first: direct-to-chip liquid cooling loops, for which Ecolab launched a dedicated coolant monitoring service in May 2025, rise from 5,558 MW of installed artificial intelligence (AI) capacity in 2025 to 130,131 MW in 2035. Liquid Cooling Loops are therefore the fastest-growing cooling system segment at 30.55% a year, and the Middle East and Africa is the fastest-growing region at 18.46% a year, because Gulf campuses run evaporative and hybrid coolers in hot, water-scarce sites that depend on desalinated or recycled make-up water.
Key Market Statistics: How Big Is the Data Center Water Treatment Market in 2026?
DC Market Insights values the Data Center Water Treatment Market at USD 564.06 million in 2026, 22.12% above the USD 461.89 million of 2025, as liquid-cooled AI halls commissioned in 2026 add coolant treatment contracts on top of cooling tower programmes.
- Market size 2025: USD 461.89 million
- Market size 2026: USD 564.06 million
- Market size 2030: USD 1.05 billion (USD 1,054.20 million)
- Market size 2035: USD 1.77 billion (USD 1,774.85 million)
- CAGR 2025-2035: 14.41% in the base case, 11.82% in the low case and 16.09% in the high case
- Evaporative-served installed capacity: 55,680 MW in 2025 and 124,400 MW in 2035
- Largest offering: Chemical Treatment Programs, 41.4% of 2025 value (USD 191.15 million)
- Fastest-growing cooling system: Liquid Cooling Loops, 30.55% a year
- Leading region: North America, 46.0% of 2025 value (USD 212.47 million)
- Fastest-growing region: the Middle East and Africa, 18.46% a year
- Largest country: the United States, USD 189.38 million in 2025 (41.0% of global value)
- Market leader: Ecolab (Nalco Water), about 24% of 2025 value (DC Market Insights assessment)
Executive Summary
The Global Data Center Water Treatment Market size was valued at USD 238.03 million in 2020, reached USD 461.89 million in 2025, and is anticipated to reach USD 1.77 billion by 2035, at a CAGR of 14.41% during the forecast period.
| Report attribute | Details |
|---|---|
| Historical Period | 2020-2024 |
| Base Year | 2025 |
| Forecast Period | 2026-2035 |
| Data Center Water Treatment Market Size 2025 | USD 461.89 Million |
| Data Center Water Treatment Market Size 2026 | USD 564.06 Million |
| Data Center Water Treatment Market, CAGR | 14.41% |
| Data Center Water Treatment Market Size 2035 | USD 1.77 Billion |
Data center water treatment spending grew 14.18% a year from 2020 to 2025 because evaporative-served capacity rose from 40,000 MW to 55,680 MW and new campuses specified side-stream filtration, softening and automated dosing from day one. The next ten years grow at a similar 14.41% a year, but for a different reason. Water use per kilowatt-hour falls as hyperscale operators move to closed loops, so the evaporative programme grows only 9.11% a year; the gap is filled by the coolant inside liquid cooling loops, which must be kept within pH, inhibitor and particle limits for the life of every cold plate it touches. In 2035, Liquid Cooling Loops account for 43.3% of the market, against 11.6% in 2025.
Key Takeaways
Four findings explain where the USD 1.77 billion of 2035 water treatment spend comes from.
- Liquid Cooling Loops become the second engine of the market, at 30.55% a year, because installed liquid-cooled AI capacity grows about 23 times between 2025 and 2035 and each loop needs continuous coolant monitoring.
- Monitoring and Control Systems grow fastest among offerings, at 19.36% a year, because operators run towers at higher cycles of concentration to save water, which only works with real-time dosing control.
- Pretreatment and Filtration Equipment grows slowest, at 7.17% a year, because new evaporative-served capacity levels off at about 8,400 MW a year after 2032 as zero-water designs spread.
- The Middle East and Africa grows fastest, at 18.46% a year, because Gulf AI campuses combine high heat loads with desalinated or treated sewage make-up water, which needs more pretreatment per MW.
What Does Data Center Water Treatment Include?
Data center water treatment covers the chemicals, equipment, monitoring and services that keep cooling water and coolant inside a data center within quality limits, worth USD 461.89 million in 2025.
Included: Cooling Tower Programmes, Pretreatment, Coolant Care and Testing
The scope has four offerings. Chemical Treatment Programs are scale and corrosion inhibitors, dispersants, oxidising and non-oxidising biocides for evaporative cooling towers and adiabatic coolers, inhibitor packages for closed chilled-water loops and coolant additives for liquid cooling loops. Monitoring and Control Systems are online sensors, fluorometric or conductivity controllers, automated dosing skids and the software that reports water and coolant health. Pretreatment and Filtration Equipment covers softeners, reverse osmosis units for make-up water, side-stream filters, ultraviolet or ozone systems and reclaimed-water polishing at the data center site. Water Management and Testing Services covers Legionella sampling, water management plans under ASHRAE Standard 188, coolant fluid analysis, loop flushing and filling at commissioning, and on-site service technicians.
Excluded: Water Bills, Cooling Hardware, Coolant Fluid and Utility Plants
The scope excludes the water itself and utility charges, cooling towers and dry coolers (covered in the Data Center Cooling Tower Market and the Data Center Dry Cooler Market), coolant distribution units and cold plates (covered in the Direct-to-Chip Liquid Cooling Market), bulk glycol or dielectric fluid supply, off-site municipal wastewater or desalination plants, and ultrapure water for semiconductor fabs.
How the Segments Fit Together
Every dollar sits in one offering, one cooling system and one data center type at the same time. Evaporative Cooling Towers and Adiabatic Coolers hold USD 361.99 million of 2025 value, Liquid Cooling Loops USD 53.51 million and Closed Chilled-Water Loops USD 46.40 million; the same USD 461.89 million splits across Chemical Treatment Programs, Monitoring and Control Systems, Pretreatment and Filtration Equipment and Water Management and Testing Services.
Why Do Data Center Water Treatment Market Estimates Differ?
Estimates differ because definitions differ: DC Market Insights puts the 2026 data center water treatment market at USD 564.06 million and counts only treatment, not the water, the cooling hardware or the fluid.
Broader estimates often add the cost of water and sewer service, which at Loudoun Water’s 2026 potable commercial rate of USD 4.42 per 1,000 gallons is worth more than the treatment itself; they may add the cooling towers, the glycol or dielectric fluid in the loops, municipal wastewater treatment plants built to serve data center clusters, or the ultrapure water systems of semiconductor fabs, which Ecolab and Veolia report together with data centers as one high-technology business. Narrower estimates count chemicals only and leave out pretreatment equipment and Legionella testing services.
| Element | In DC Market Insights scope | Why |
|---|---|---|
| Cooling tower chemicals, dosing and monitoring | Yes (USD 178.18 million in 2025) | Bought per evaporative-served MW every year |
| Make-up pretreatment and side-stream filtration | Yes (USD 128.13 million in 2025) | Installed at the data center site |
| Liquid loop coolant treatment and flushing | Yes (USD 53.51 million in 2025) | Keeps cold plates and coolant distribution units within limits |
| Water and sewer bills | No | A utility charge, not a treatment product |
| Cooling towers, dry coolers, coolant fluid | No | Sized in sibling DC Market Insights reports |
| Semiconductor ultrapure water, municipal plants | No | Different buyers and different sites |
Out-of-scope terms used in other definitions include water utility charges, desalination plants, municipal reclaimed water networks, ultrapure water for microelectronics, glycol supply, dielectric immersion fluid and wastewater discharge fees. Buyers inside the scope include hyperscale and AI operators, colocation providers, enterprise data centers and small and medium-sized operators of edge sites with a single cooling tower.
Why Are Data Centers Spending More on Water Treatment?
Water treatment spending rises 22.12% in 2026, to USD 564.06 million, because three changes add treated water, treated coolant and testing at the same time.
Liquid Cooling Loops Add a Second Treated Circuit to Every AI Hall
Direct-to-chip cooling sends coolant through cold plates with channels a fraction of a millimetre wide, so corrosion products, biological growth or depleted inhibitor can block a plate and throttle a graphics processing unit (GPU). Ecolab launched 3D TRASAR Technology for Direct-to-Chip Liquid Cooling in May 2025, “tracking coolant concentration, temperature, pH, flow rates and other fluid health indicators”, according to Ecolab, and Solenis joined Dow’s Coolant Care Network as an approved service provider in June 2026, according to Solenis. DC Market Insights estimates installed liquid-cooled AI capacity at 5,558 MW in 2025 and 130,131 MW in 2035, at about USD 6,000 of coolant treatment, monitoring and service per MW a year in 2025.
Water Reporting Rules Turn Litres Into an Audited Number
Commission Delegated Regulation (EU) 2024/1364 requires operators of data centres with at least 500 kW of IT power to report total water input and potable water input in cubic metres, first by 15 September 2024 and every year from 15 May 2025, according to the regulation. California’s governor signed AB 2469 on data center water use disclosures and AB 2619 on data center water resources on 21 September 2026, according to the Office of the Governor, and Minnesota now reviews data centers likely to use more than 100 million gallons a year, according to the Minnesota House summary of the 2025 law. Once water is reported, operators buy metering and the treatment that lets towers run at higher cycles of concentration, which lifts Monitoring and Control Systems at 19.36% a year.
New York’s 31-Day Legionella Test Sets the Compliance Bar
Since 8 May 2026, New York City requires building owners to test cooling towers for Legionella bacteria every 31 days while they operate, covering about 4,000 buildings with registered towers, according to the New York City Department of Health and Mental Hygiene; New York State already requires an inspection every 90 days in use and an annual certification by 1 November. The Centers for Disease Control and Prevention (CDC) toolkit says disinfectant residual “should be monitored and adjusted by an automated system”. DC Market Insights prices Legionella sampling, water management plans and technician visits at USD 1,000 per evaporative-served MW a year in 2025, rising to USD 1,300 in 2035 on 124,400 MW.
How Is Data Center Cooling Water Management Changing?
Three shifts change what a data center buys for its water, and together they move 2035 spend towards monitoring, services and coolant care, which reach 58.8% of the USD 1.77 billion.
Reclaimed Water Replaces Drinking Water at Hyperscale Sites
Amazon Web Services (AWS) reports recycled water for cooling at 24 data centers and plans more than 120 locations, according to Amazon, and Veolia said in its first-quarter 2026 results that it works with Amazon on reclaimed water for data center cooling. Loudoun Water charges USD 2.07 per 1,000 gallons for reclaimed water against USD 4.42 to USD 7.59 for potable commercial tiers in 2026, according to Loudoun Water’s rate schedule. Reclaimed water carries more nutrients, phosphate and suspended solids, so the saving on the water bill pays for extra filtration, disinfection and dosing.
Higher Cycles of Concentration Need Real-Time Control
The U.S. Department of Energy’s Federal Energy Management Program (FEMP) says raising cycles of concentration from three to six cuts cooling tower make-up water by 20% and blowdown by 50%. Running a tower that close to its scaling limit requires continuous conductivity, inhibitor and oxidant control, which is why the Monitoring and Control Systems segment rises to USD 326.68 million by 2035, 18.4% of the market.
Treatment Companies Buy Into Cooling Hardware
Ecolab agreed in March 2026 to buy CoolIT Systems, a maker of liquid cooling equipment, for about USD 4.75 billion in cash, and said CoolIT would bring about USD 550 million of sales over the next 12 months. When the deal closed in July 2026, Ecolab said its Global High-Tech business, which serves data centers and microelectronics, was approaching USD 1.5 billion in 2026 annualised sales and targeted USD 4 billion by 2030, according to Ecolab’s announcement. Selling the loop and the treatment of the fluid inside it as one contract shifts coolant care towards hardware suppliers.
Market Restraints: What Could Slow Data Center Water Treatment Spending?
Two restraints cut the evaporative programme, which is why it grows only 9.11% a year while the market grows 14.41%.
Zero-Water Cooling Designs at Microsoft and NVIDIA
Microsoft says all its new datacenter designs since August 2024 use closed-loop chip cooling that consumes zero water for cooling and avoids more than 125 million liters a year per datacenter, according to Microsoft. NVIDIA says 45 °C coolant “can enable chiller-less operation with dry coolers”. DC Market Insights therefore lowers the evaporative share of new AI capacity from 48% in 2025 to 30% in 2035, which holds new evaporative-served capacity at 8,467 MW in 2035 against 5,448 MW in 2025.
Falling Water Use per Kilowatt-Hour at Hyperscale Operators
Hyperscale operators already use far less water per unit of IT energy than the average site. AWS reports a water usage effectiveness (WUE) of 0.12 liters per kilowatt-hour (L/kWh), Microsoft 0.30 L/kWh and Meta 0.19 for its data centers, against just over 0.36 L/kWh for the average U.S. data center through 2023, according to Lawrence Berkeley National Laboratory (LBNL). Less make-up water per MW means fewer kilograms of inhibitor and biocide per MW, so chemical spend per evaporative-served MW rises only from USD 2,400 in 2025 to USD 2,700 in 2035.
Where Are the Openings for Data Center Water Treatment Suppliers?
The two largest openings are coolant care for liquid cooling loops and pretreatment for alternative water sources, together worth USD 1.03 billion in 2035.
Coolant Care Contracts for Direct-to-Chip Loops
Liquid Cooling Loops reach USD 769.16 million by 2035, 43.3% of the market, because every new liquid-cooled MW needs a flush and fill at commissioning, valued at USD 8,000 per MW in 2025, and then monitoring, inhibitor top-ups and fluid analysis for its whole life. Suppliers that can certify coolant quality for cold plate warranties, as Dow’s Coolant Care Network does with approved service providers, are best placed for these contracts.
Pretreatment for Reclaimed, Desalinated and Groundwater Sources
Pretreatment and Filtration Equipment reaches USD 256.18 million by 2035. Virginia’s 2026 budget conference report would require new data centers in the Eastern Virginia Groundwater Management Area that file complete air permit applications after 1 January 2027 to use air cooling, closed loop cooling or 100% recycled or stormwater, and Gulf campuses in Saudi Arabia and the United Arab Emirates draw on desalinated or treated sewage effluent; each source needs filtration, softening or reverse osmosis before it reaches a tower.
How Much Does Data Center Water Treatment Cost per MW?
DC Market Insights estimates the 2025 cost of water treatment at USD 4,200 per evaporative-served MW a year, USD 18,000 of pretreatment equipment per new evaporative MW and USD 6,000 per liquid-cooled MW a year.
| Year | Evaporative programme (USD per MW a year) | Pretreatment equipment (USD per new evaporative MW) | Liquid loop treatment (USD per MW a year) | Closed chilled-water loop (USD per MW a year) |
|---|---|---|---|---|
| 2020 | 3,600 | 15,000 | 5,000 | 350 |
| 2025 | 4,200 | 18,000 | 6,000 | 400 |
| 2030 | 4,600 | 20,000 | 5,500 | 430 |
| 2035 | 4,900 | 21,000 | 5,000 | 450 |
The evaporative programme of USD 4,200 per MW in 2025 splits into USD 2,400 of chemicals, USD 800 of monitoring and USD 1,000 of testing and service; on NVIDIA’s 2.6 million gallons a year per MW, chemicals cost about USD 0.92 per 1,000 gallons of make-up water. Public anchors: the U.S. General Services Administration (GSA) measured installed costs of USD 20 to USD 151 per ton of cooling for alternative cooling tower treatment systems in federal buildings, with a two-to-three-year payback; the Environmental Protection Agency (EPA) WaterSense guide puts evaporation at about 1.8 gallons per ton-hour of cooling. Liquid loop treatment falls to USD 5,000 per MW a year by 2035 as larger loops spread sensor and service costs over more MW.
Which Water Rules and Standards Apply to Data Centers?
Nine rules and standards shape a USD 564.06 million market in 2026, from Legionella control to water reporting.
- ASHRAE Standard 188: the American Society of Heating, Refrigerating and Air-Conditioning Engineers standard that “establishes minimum requirements for legionellosis risk management” and sets out the water management programme.
- CDC cooling tower toolkit: asks operators to use a water management programme and automated disinfectant control, updated 3 January 2025.
- New York State 10 NYCRR Subpart 4-1: registration, inspection every 90 days in use and certification by 1 November each year, according to the New York State Department of Health.
- New York City cooling tower rules: Legionella testing every 31 days in operation from 8 May 2026, according to the New York City Department of Health and Mental Hygiene.
- Delegated Regulation (EU) 2024/1364: water input reporting for data centres with at least 500 kW of IT power, under Article 12 of the Energy Efficiency Directive (EU) 2023/1791.
- California AB 2469 and AB 2619: water use disclosure to local governments and water suppliers, signed 21 September 2026; the committee analysis of AB 2469 describes a water scarcity plan from 1 January 2028.
- Minnesota Statutes 103G.265 and 103G.271: Department of Natural Resources review for data centers likely to consume more than 100 million gallons a year.
- Utah HB 76: annual water use reporting for data centers withdrawing 75 acre-feet a year or more.
- Singapore Public Utilities Board (PUB) rules: mandatory water efficiency management plans for sites using at least 60,000 cubic metres a year and a sectoral median benchmark of 2.1 cubic metres per MWh for data centres.
Which Data Center Water Treatment Segment Is Largest?
Chemical Treatment Programs are the largest offering, at 41.4% of 2025 value or USD 191.15 million, and Evaporative Cooling Towers and Adiabatic Coolers are the largest cooling system, at 78.4%.
By Offering: Chemical Treatment Programs Lead with 41.4%
| Offering | 2025 (USD million) | Share 2025 | 2035 (USD million) | CAGR 2025-2035 |
|---|---|---|---|---|
| Chemical Treatment Programs | 191.15 | 41.4% | 697.05 | 13.81% |
| Pretreatment and Filtration Equipment | 128.13 | 27.7% | 256.18 | 7.17% |
| Water Management and Testing Services | 86.96 | 18.8% | 494.94 | 18.99% |
| Monitoring and Control Systems | 55.66 | 12.1% | 326.68 | 19.36% |
| Total | 461.89 | 100.0% | 1,774.85 | 14.41% |
Chemical programmes lead because inhibitors and biocides are consumed every day a tower or loop runs. Monitoring and Control Systems grow fastest because reporting rules and higher cycles of concentration both need online measurement.
By Cooling System: Evaporative Cooling Towers and Adiabatic Coolers Lead with 78.4%
| Cooling system | 2025 (USD million) | Share 2025 | 2035 (USD million) | CAGR 2025-2035 |
|---|---|---|---|---|
| Evaporative Cooling Towers and Adiabatic Coolers | 361.99 | 78.4% | 865.74 | 9.11% |
| Liquid Cooling Loops | 53.51 | 11.6% | 769.16 | 30.55% |
| Closed Chilled-Water Loops | 46.40 | 10.0% | 139.95 | 11.67% |
| Total | 461.89 | 100.0% | 1,774.85 | 14.41% |
Evaporative systems stay the largest cooling system in 2035, at 48.8% of value, because the evaporative-served base more than doubles even as new designs move to dry heat rejection.
By Data Center Type: Hyperscale and AI Data Centers Lead with 48.0%
| Data center type | 2025 (USD million) | Share 2025 | 2035 (USD million) | CAGR 2025-2035 |
|---|---|---|---|---|
| Hyperscale and AI Data Centers | 221.71 | 48.0% | 1,064.91 | 16.99% |
| Colocation Data Centers | 147.81 | 32.0% | 496.96 | 12.89% |
| Enterprise and Edge Data Centers | 92.38 | 20.0% | 212.98 | 8.71% |
| Total | 461.89 | 100.0% | 1,774.85 | 14.41% |
Hyperscale and AI operators grow fastest because they own most of the liquid-cooled capacity and sign multi-site treatment contracts.
DC Exclusive: Data Center Water Rule Timeline, 9 Rules From 2024 to 2028
DC Market Insights built this timeline from 9 inputs, each a dated rule or design decision, and paired each with its modelled effect on treatment spend; the effects are DC Market Insights estimates, not figures published by the rule makers.
| Date | Rule or design change | Who it covers | What it requires | Effect on treatment spend (DCMI estimate) |
|---|---|---|---|---|
| Aug 2024 | Microsoft zero-water cooling design | All new Microsoft datacenter designs | Closed-loop chip cooling, no evaporative water | Shifts spend from tower chemicals to coolant care |
| Sep 2024 | Delegated Regulation (EU) 2024/1364 | Data centres of 500 kW or more | Report total and potable water input | More metering and dosing control |
| May 2025 | Ecolab 3D TRASAR for direct-to-chip | Liquid cooling loops | Real-time coolant health monitoring | Sets a price for loop monitoring |
| Jun 2025 | Minnesota 103G.271 | Sites over 100 million gallons a year | Preapplication review and permit conditions | Favours higher cycles and reuse |
| Mar 2026 | Singapore PUB benchmark | Data centres | Median 2.1 cubic metres per MWh | Benchmarks tower efficiency |
| May 2026 | New York City 31-day testing | About 4,000 buildings with towers | Legionella test every 31 days | Adds sampling visits per tower |
| Sep 2026 | California AB 2469 and AB 2619 | New or expanded data centers | Water use disclosure | Metering and reporting services |
| Jan 2027 | Virginia budget Item 366 #7c | Eastern Virginia Groundwater Management Area | Air, closed loop or 100% recycled water | Reclaimed-water pretreatment |
| Jan 2028 | California water scarcity plans | New or expanded data centers | Plan before local approval | Drought-mode treatment designs |
The timeline shows why the market keeps growing while water use per kWh falls: five of the nine rules add measurement, testing or reuse, each of which is bought as treatment, while only the design changes at Microsoft and in Virginia remove evaporative water outright.
Which Region Spends the Most on Data Center Water Treatment?
North America leads with 46.0% of 2025 value, USD 212.47 million, and the Middle East and Africa grows fastest at 18.46% a year.
| Region | 2025 (USD million) | Share 2025 | 2035 (USD million) | CAGR 2025-2035 |
|---|---|---|---|---|
| North America | 212.47 | 46.0% | 745.44 | 13.37% |
| Asia Pacific | 124.71 | 27.0% | 567.95 | 16.37% |
| Europe | 78.52 | 17.0% | 230.73 | 11.38% |
| Middle East and Africa | 27.71 | 6.0% | 150.86 | 18.46% |
| Latin America | 18.48 | 4.0% | 79.87 | 15.77% |
| Total | 461.89 | 100.0% | 1,774.85 | 14.41% |
North America Leads with 46.0% Share
North America holds the largest evaporative-served base and the strictest Legionella regimes, led by New York, and its reclaimed water networks in Northern Virginia, where Loudoun Water prices reclaimed water at less than half the potable tier, create pretreatment demand.
Asia Pacific Holds 27.0% Share
Asia Pacific grows 16.37% a year as China, India and Australia add hyperscale campuses; Singapore’s PUB requires water efficiency management plans from sites using 60,000 cubic metres a year or more.
Europe Holds 17.0% Share
Europe grows slowest, at 11.38% a year, because cool climates allow more dry cooling, but every data centre of 500 kW or more must report its water input under Delegated Regulation (EU) 2024/1364.
Middle East and Africa Holds 6.0% Share
The Middle East and Africa is the fastest-growing region because DC Market Insights expects Saudi Arabian and Emirati AI campuses in desert climates to rely on desalinated or treated effluent make-up water, which needs more pretreatment per MW.
Latin America Holds 4.0% Share
Latin America grows 15.77% a year, led by Brazil, where DC Market Insights allocates most regional value to campuses around São Paulo that use evaporative cooling in a warm climate.
Which Countries Spend the Most on Data Center Water Treatment?
The United States is the largest country at USD 189.38 million in 2025, 41.0% of global value, and Saudi Arabia is the fastest-growing large country at 20.99% a year.
| Rank | Country | Region | 2025 (USD million) | 2035 (USD million) | CAGR 2025-2035 |
|---|---|---|---|---|---|
| 1 | United States | North America | 189.38 | 665.57 | 13.39% |
| 2 | China | Asia Pacific | 55.43 | 239.60 | 15.77% |
| 3 | Japan | Asia Pacific | 18.48 | 63.89 | 13.21% |
| 4 | Germany | Europe | 16.17 | 46.15 | 11.06% |
| 5 | India | Asia Pacific | 13.86 | 92.29 | 20.88% |
| 6 | United Kingdom | Europe | 13.86 | 42.60 | 11.88% |
| 7 | Canada | North America | 13.86 | 51.47 | 14.02% |
| 8 | Australia | Asia Pacific | 11.55 | 49.70 | 15.71% |
| 9 | Brazil | Latin America | 9.24 | 40.82 | 16.02% |
| 10 | Saudi Arabia | Middle East and Africa | 7.39 | 49.70 | 20.99% |
| 11 | Singapore | Asia Pacific | 6.93 | 28.40 | 15.15% |
| 12 | Ireland | Europe | 6.93 | 21.30 | 11.88% |
India grows almost as fast as Saudi Arabia, at 20.88% a year, because DC Market Insights expects new campuses in Mumbai and Chennai to use evaporative or hybrid cooling with municipal and recycled water.
How Could the 2035 Data Center Water Treatment Forecast Change?
The 2035 market ranges from USD 1.41 billion to USD 2.05 billion around the USD 1.77 billion base case, depending on how fast zero-water designs spread.
| Scenario | Assumption from 2027 | 2035 (USD million) | CAGR 2025-2035 |
|---|---|---|---|
| Low | Evaporative-served capacity 20% lower, liquid-cooled capacity 15% lower, prices 5% lower | 1,412.01 | 11.82% |
| Base | DC Market Insights base assumptions | 1,774.85 | 14.41% |
| High | Evaporative-served capacity 12% higher, liquid-cooled capacity 10% higher, prices 5% higher | 2,053.44 | 16.09% |
The low case reflects faster adoption of Microsoft-style closed loops and 45 °C dry cooling; the high case reflects more evaporative capacity on power-limited campuses, where evaporative heat rejection uses less electricity than dry coolers.
Who Are the Leading Data Center Water Treatment Companies?
Ecolab (Nalco Water) leads with about 24% of the USD 461.89 million market in 2025, and the top five suppliers hold about 55%, a DC Market Insights estimate based on disclosed data center reach, product launches and service networks.
- Ecolab (Nalco Water)
- Veolia
- Solenis
- ChemTreat (Veralto)
- Kurita Water Industries
- Xylem
- Suez
- Dow
- Buckman
- Chem-Aqua (NCH)
- Garratt-Callahan
- Culligan
- Ion Exchange (India)
- Organo
The basis for the 24% estimate: Ecolab says it already reaches more than 1,000 data centers, reported double-digit growth in its Global High-Tech unit in the fourth quarter of 2025, and puts that unit at close to USD 1.5 billion of 2026 annualised sales including microelectronics and the CoolIT cooling hardware it bought. Veolia targets more than EUR 1 billion a year of revenue from data centers and microelectronics combined by 2030, according to Veolia’s April 2026 announcement. Veralto, the owner of ChemTreat, reported 5.7% core sales growth in its Water Quality segment in the second quarter of 2026 without a data center figure.
Recent Developments
Six dated events in 2026 show suppliers and regulators converging on coolant care and water reporting.
- In September 2026, the governor of California signed AB 2469 and AB 2619 on data center water use (Source: Office of the Governor of California).
- In July 2026, Ecolab closed its acquisition of CoolIT Systems and set a USD 4 billion 2030 sales target for Global High-Tech (Source: Ecolab).
- In June 2026, Solenis became an approved service provider in Dow’s Coolant Care Network for direct-to-chip cooled data centers (Source: Solenis).
- In May 2026, New York City’s 31-day Legionella testing rule for cooling towers took effect (Source: New York City Department of Health and Mental Hygiene).
- In May 2026, Veolia reported its Data Center Resource 360 offer and its reclaimed water work with Amazon (Source: Veolia first-quarter 2026 results).
- In April 2026, Veolia set a target of more than EUR 1 billion of annual data center and microelectronics revenue by 2030 (Source: Veolia).
Methodology: How DC Market Insights Sizes the Data Center Water Treatment Market
DC Market Insights built the Data Center Water Treatment Market bottom-up from treated MW and treatment cost per MW, giving USD 461.89 million in 2025 and USD 1.77 billion in 2035.
The model in numbers. The evaporative-served installed base is 50%, 48%, 44% and 40% of an installed IT base of 80,000, 116,000, 196,000 and 311,000 MW in 2020, 2025, 2030 and 2035, the same path as the DC Market Insights cooling tower model; it is multiplied by chemicals (USD 2,100 to 2,700 per MW a year), monitoring (USD 700 to 900) and services (USD 800 to 1,300). Pretreatment equipment of USD 15,000 to 21,000 is applied to new evaporative-served MW (2,922 in 2020, 5,448 in 2025, 8,096 in 2030, 8,467 in 2035) plus a 3% yearly refresh of the base. Liquid-cooled capacity is 20%, 45%, 85% and 95% of installed AI capacity of 3,000, 12,350, 57,850 and 136,980 MW, at USD 5,000 to 6,000 per MW a year, plus a flush and fill of USD 7,000 to 8,000 per new liquid-cooled MW. Closed chilled-water loops add USD 350 to 450 per installed MW a year. Values are linear between anchor years. Offering, cooling system, data center type, regional and country splits are DC Market Insights allocations that sum to the total every year, following the DC Market Insights research methodology.
Bound checks. (1) Ceiling: if all 116,000 MW installed in 2025 were evaporative-served and all 12,000 MW of new capacity took pretreatment equipment, the market would be about USD 750 million, against USD 461.89 million in the model. (2) Ceiling: the 24% share given to Ecolab equals about USD 110.85 million in 2025, under one-tenth of the close to USD 1.5 billion of 2026 annualised sales of its Global High-Tech business, which also covers microelectronics and about USD 550 million of CoolIT hardware. (3) Floor: Ecolab’s reach of more than 1,000 data centers at an assumed minimum of USD 100,000 of treatment a year per site gives USD 100 million from one supplier, below the model total. Water volumes cross-check: LBNL reports an average site WUE of just over 0.36 L/kWh in the United States through 2023, rising to between 0.45 and 0.48 L/kWh in its projections; Google reports 10.9 billion gallons of water consumed across its data centers and offices in 2025, up 34% from 2024.
Table of contents
- 01Introduction
- 1.1Market Definition
- 1.2Historical Period, Base Year and Forecast Period
- 1.3Report Attributes
- 02Research Methodology
- 2.1The Treated-MW Model in Numbers
- 2.2Bound Checks: All-Evaporative Ceiling, Ecolab High-Tech Ceiling and Ecolab Reach Floor
- 03Executive Summary
- 3.1Market Snapshot, 2025, 2026 and 2035
- 3.2Key Market Statistics
- 3.3Key Takeaways
- 04What Does Data Center Water Treatment Include?
- 4.1Included: Cooling Tower Programmes, Pretreatment, Coolant Care and Testing
- 4.2Excluded: Water Bills, Cooling Hardware, Coolant Fluid and Utility Plants
- 4.3How the Segments Fit Together
- 05Why Do Data Center Water Treatment Market Estimates Differ?
- 5.1Scope Comparison: What Is In and Out
- 5.2Buyers Inside the Scope
- 06Market Drivers
- 6.1Liquid Cooling Loops Add a Second Treated Circuit to Every AI Hall
- 6.2Water Reporting Rules Turn Litres Into an Audited Number
- 6.3New York's 31-Day Legionella Test Sets the Compliance Bar
- 07Market Trends
- 7.1Reclaimed Water Replaces Drinking Water at Hyperscale Sites
- 7.2Higher Cycles of Concentration Need Real-Time Control
- 7.3Treatment Companies Buy Into Cooling Hardware
- 08Market Restraints
- 8.1Zero-Water Cooling Designs at Microsoft and NVIDIA
- 8.2Falling Water Use per Kilowatt-Hour at Hyperscale Operators
- 09Market Opportunities
- 9.1Coolant Care Contracts for Direct-to-Chip Loops
- 9.2Pretreatment for Reclaimed, Desalinated and Groundwater Sources
- 10Pricing Analysis: Data Center Water Treatment Cost per MW
- 10.1Treatment Cost per MW, 2020-2035
- 10.2Public Anchors: GSA Treatment Costs and EPA Evaporation Rate
- 11Standards and Regulation
- 11.1ASHRAE Standard 188
- 11.2CDC Cooling Tower Toolkit
- 11.3New York State 10 NYCRR Subpart 4-1
- 11.4New York City Cooling Tower Rules
- 11.5Delegated Regulation (EU) 2024/1364
- 11.6California AB 2469 and AB 2619
- 11.7Minnesota Statutes 103G.265 and 103G.271
- 11.8Utah HB 76
- 11.9Singapore PUB Water Efficiency Rules
- 12Data Center Water Treatment Market, By Offering
- 12.1Chemical Treatment Programs
- 12.2Pretreatment and Filtration Equipment
- 12.3Water Management and Testing Services
- 12.4Monitoring and Control Systems
- 13Data Center Water Treatment Market, By Cooling System
- 13.1Evaporative Cooling Towers and Adiabatic Coolers
- 13.2Liquid Cooling Loops
- 13.3Closed Chilled-Water Loops
- 14Data Center Water Treatment Market, By Data Center Type
- 14.1Hyperscale and AI Data Centers
- 14.2Colocation Data Centers
- 14.3Enterprise and Edge Data Centers
- 15DC Exclusive: Data Center Water Rule Timeline, 9 Rules From 2024 to 2028
- 15.1Timeline of Rules and Design Changes
- 15.2Modelled Effect on Treatment Spend
- 16Regional Insights
- 16.1North America
- 16.2Asia Pacific
- 16.3Europe
- 16.4Middle East and Africa
- 16.5Latin America
- 17Country Analysis
- 17.1United States
- 17.2China
- 17.3Japan
- 17.4Germany
- 17.5India
- 17.6United Kingdom
- 17.7Canada
- 17.8Australia
- 17.9Brazil
- 17.10Saudi Arabia
- 17.11Singapore
- 17.12Ireland
- 18Forecast Scenarios
- 18.1Low Case
- 18.2Base Case
- 18.3High Case
- 19Competitive Insights
- 19.1Ecolab (Nalco Water)
- 19.2Veolia
- 19.3Solenis
- 19.4ChemTreat (Veralto)
- 19.5Kurita Water Industries
- 19.6Xylem
- 19.7Suez
- 19.8Dow
- 19.9Buckman
- 19.10Chem-Aqua (NCH)
- 19.11Garratt-Callahan
- 19.12Culligan
- 19.13Ion Exchange (India)
- 19.14Organo
- 19.15Market Concentration
- 20Recent Developments
- 20.1Dated Events, April to September 2026
- Fig. 1Data Center Water Treatment Market Size, 2020-2035 (USD Million)
- Table 1Report Attributes
- Table 2Scope Comparison, In and Out of Scope
- Table 3Data Center Water Treatment Cost per MW, 2020-2035
- Table 4Market by Offering, 2025 and 2035
- Table 5Market by Cooling System, 2025 and 2035
- Table 6Market by Data Center Type, 2025 and 2035
- Table 7Data Center Water Rule Timeline, 2024-2028
- Table 8Market by Region, 2025 and 2035
- Table 9Top 12 Countries, 2025 and 2035
- Table 10Forecast Scenarios, 2035
About this report
Written by Amit Jain and reviewed by Deepti Agrawal, Senior Editor, Research. Figures are built top-down and bottom-up and reconciled before publication, with 2025 as the base year.
Read our methodologyHow we built this
- Historical period2020-2024
- Base year2025
- Forecast period2026-2035
- Sizing approachTop-down + bottom-up
Need more than the report?
Advisory on this market
Due diligence, site selection and market entry work, by the analysts who wrote this report.
See consulting servicesFrequently asked questions
USD 564.06 million in 2026, up 22.12% from USD 461.89 million in 2025, according to DC Market Insights estimates. The market is projected to reach USD 1.77 billion by 2035, a CAGR of 14.41% from 2025.
14.41% a year from 2025 to 2035, after 14.18% a year from 2020 to 2025. Growth holds because liquid cooling loops, growing 30.55% a year, offset slower spending on evaporative cooling towers as zero-water designs spread.
USD 461.89 million of 2025 spending covers chemicals, pretreatment and filtration equipment, monitoring and testing services that keep cooling tower water, chilled-water loops and liquid cooling coolant within quality limits. Water bills, cooling hardware and coolant fluid are excluded.
About USD 4,200 per evaporative-served MW a year in 2025, plus USD 18,000 of pretreatment equipment per new evaporative MW and USD 6,000 per liquid-cooled MW a year (DC Market Insights estimate).
41.4% of 2025 value, or USD 191.15 million, goes to chemical treatment programs. Monitoring and control systems grow fastest among offerings at 19.36% a year as operators run towers at higher cycles of concentration.
5,558 MW of liquid-cooled AI capacity in 2025 needs coolant monitoring, inhibitors and flushing, because corrosion or biological growth can block cold plates. DC Market Insights expects 130,131 MW by 2035, making liquid loops 43.3% of the market.
46.0% of 2025 value, or USD 212.47 million, is spent in North America. The Middle East and Africa grows fastest at 18.46% a year, and Saudi Arabia is the fastest-growing large country at 20.99% a year.
ASHRAE Standard 188 sets Legionella water management programs, New York City requires Legionella tests every 31 days from May 2026, and EU Delegated Regulation 2024/1364 makes data centres of 500 kW or more report water input.
About 24% of 2025 value is held by Ecolab (Nalco Water), and the top five suppliers hold about 55% (DC Market Insights estimate). Veolia, Solenis, ChemTreat, Kurita Water Industries and Xylem also compete.
USD 564.06 million in 2026 is the DC Market Insights figure for treatment only. Estimates that add water and sewer bills, cooling towers, coolant fluid or semiconductor ultrapure water are much larger.
Licences, delivery and payment
Which licence should I choose?
Single User is a view-only PDF for one person. Multi User adds a printable PDF and the Excel data for unlimited users at one location. Enterprise covers your whole company and includes 100 free analyst hours.
How and when will I receive the report?
By email, within 24–48 business hours of payment, in the formats of your licence.
How can I pay?
Securely through PayPal: with a PayPal account, a debit or credit card, or PayPal Pay Later where available. Prices are in US dollars.
Can I see a sample first?
Yes. Request a free sample and we will email it to you.
Can the report be tailored to my needs?
Yes. We can add countries, segments or data cuts. Talk to an analyst about the scope you need.
Can I get an invoice or pay against a purchase order?
Write to sales@dcmarketinsights.com and our team will help.