
Retail Colocation Market Size, Share & Forecast to 2035
Market at a glance
The Retail Colocation market was worth USD 25.87 billion in 2025 and is forecast to reach USD 57.98 billion by 2035, growing at a 8.4% CAGR.
 By Amit Jain, Senior Consultant, ICT & Emerging Technologies
 Reviewed by Deepti Agrawal
Last updated 30 Oct 2026
Base year 2025 PDF + Excel
Key findings
DORA Puts Colocation Providers Under Financial Supervision
Liquid-Cooled Inference Rooms Inside Retail Sites
Wholesale Campuses Take the Grid Connections
Private Suites for Inference Clusters: USD 18.51 Billion by 2035
What is inside the report
- 01Introduction
- 02Executive Summary
- 03Market Scope and Estimate Comparison
- 04Market Dynamics
- 05Pricing Analysis
- 06Standards and Regulation
- 07Market Segmentation by Offering
- 08Market Segmentation by End User
- 09Market Segmentation by Rack Density
- 10Market Segmentation by Organization Size
- 16chapters
- 2020-2024Historical period
- 2026-2035Forecast period
- —Companies profiled
Segmentation
Recent developments
Equinix reported USD 2.571 billion of third-quarter revenue, raised 2026 guidance and launched EPIC liquid-cooling environments and Inference Exchange (Source: Equinix, 28 October 2026).
Digital Realty booked a record USD 152 million in its 0-1 MW plus interconnection category (Source: Digital Realty, 29 October 2026).
American Tower reported 17.4% growth in data center revenue to USD 313 million for the third quarter (Source: American Tower, 27 October 2026).
the European Commission adopted the EU data centre rating scheme and opened a consultation on minimum performance standards (Source: European Commission, 21 September 2026).
NEXTDC reported 175.0 MW of billing utilisation, up 58% (Source: NEXTDC, 27 August 2026).
the European Commission referred four member states to the Court of Justice for not transposing NIS2 (Source: European Commission, 8 July 2026).
Full analysis
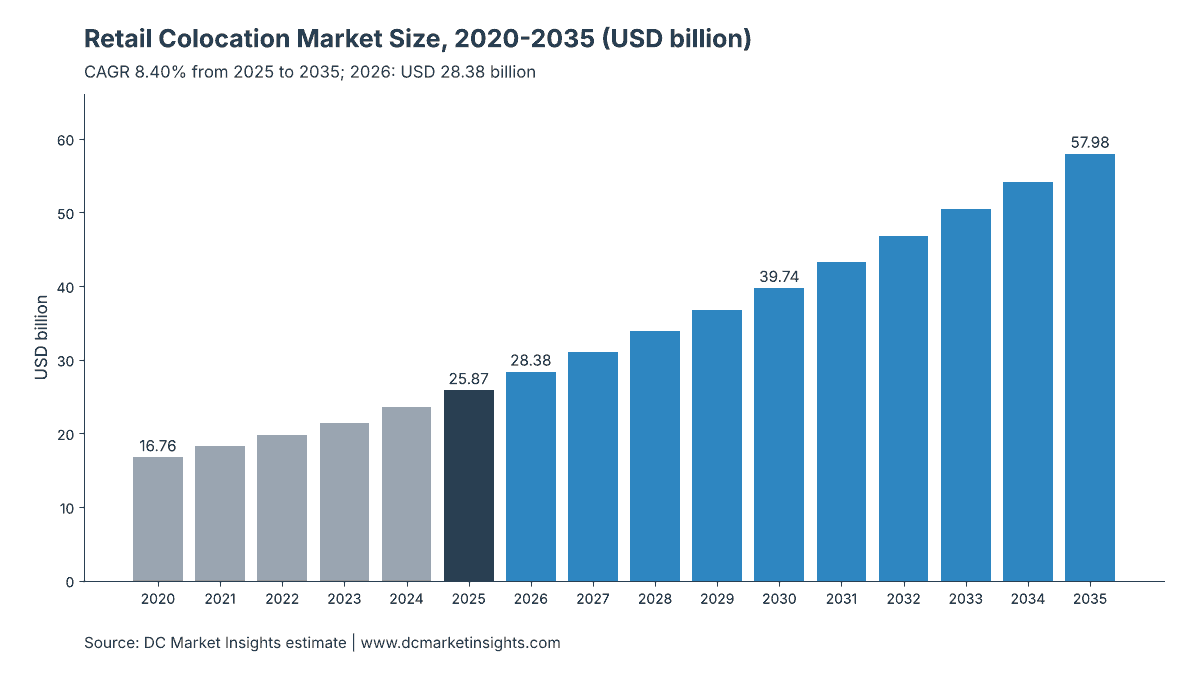
The Retail Colocation Market is valued at USD 28.38 billion in 2026 and is projected to reach USD 57.98 billion by 2035, up from USD 25.87 billion in 2025, a CAGR of 8.40% from 2025 to 2035 (DC Market Insights estimate). Retail colocation money follows the cross-connect: enterprises rent a rack, cage or private suite under 1 megawatt (MW) mainly to sit next to clouds, carriers and trading partners, and Equinix alone passed 500,000 interconnections and earned USD 1.66 billion of interconnection revenue in 2025 (Source: Equinix fourth-quarter 2025 results, 11 February 2026). Demand is now shifting from storage racks to inference racks: Digital Realty booked a record USD 152 million of annualised rent in its 0-1 MW plus interconnection category in the third quarter of 2026, up from USD 108 million one quarter earlier (Source: Digital Realty, 29 October 2026). The 2025 receipt is 6,300 MW of retail IT load in billing × USD 290 per kilowatt (kW) per month × 12 months = USD 21.92 billion of space and power rent, plus USD 3.95 billion of interconnection fees; racks above 30 kW grow fastest at 21.43% a year, and the Middle East and Africa is the fastest region at 15.33% because retail halls there start from a base of only USD 905.46 million.
Key Market Statistics: How Big Is the Retail Colocation Market in 2026?
The Retail Colocation Market is worth USD 28.38 billion in 2026, 9.70% above USD 25.87 billion in 2025, DC Market Insights estimates.
- Market size 2025: USD 25.87 billion
- Market size 2026: USD 28.38 billion
- Market size 2030: USD 39.74 billion
- Market size 2035: USD 57.98 billion
- CAGR 2025-2035: 8.40% (low case USD 48.12 billion, high case USD 68.99 billion in 2035)
- Largest offering: Rack and Cage Colocation, 61.86% of 2025 value
- Fastest end user: AI Inference Tenants, 16.89% a year
- Leading region: North America, 40.00% of 2025 value; fastest region: Middle East and Africa, 15.33%
- Largest country: United States, USD 9.31 billion in 2025
- Market leader: Equinix, with about 31% of 2025 retail colocation and interconnection revenue (DC Market Insights estimate)
Key Takeaways: What Moves Retail Colocation Revenue?
- Retail colocation revenue rises from USD 25.87 billion to USD 57.98 billion because retail IT load in billing grows from 6,300 MW to 11,600 MW.
- Average retail rent rises from USD 290 to USD 350 per kW-month because renewals reprice older contracts, as Digital Realty’s 11.8% cash renewal spread in the third quarter of 2026 shows.
- Private suites grow at 12.08% a year, faster than racks and cages at 6.56%, because inference clusters need a locked room of 200 to 900 kW rather than a few cabinets.
- Interconnection fees stay near 15% of retail colocation value because every new cloud on-ramp adds cross-connects, as Equinix’s 6,900 net interconnection additions in the third quarter of 2026 show.
Executive Summary: How Much Do Enterprises Spend on Retail Colocation?
The Global Retail Colocation Market size was valued at USD 16.76 billion in 2020, reached USD 25.87 billion in 2025, and is anticipated to reach USD 57.98 billion by 2035, at a CAGR of 8.40% during the forecast period.
| Report Attribute | Details |
|---|---|
| Historical Data | 2020-2024 |
| Base Year | 2025 |
| Forecast Period | 2026-2035 |
| Market Size 2025 | USD 25.87 billion |
| Market Size 2026 | USD 28.38 billion |
| CAGR 2025-2035 | 8.40% |
| Market Size 2035 | USD 57.98 billion |
| Segments Covered | Offering, End User, Rack Density, Organization Size |
| Regions Covered | North America, Europe, Asia Pacific, Latin America, Middle East and Africa |
Retail colocation grew 9.08% a year from 2020 to 2025 as retail IT load in billing rose from 4,700 MW to 6,300 MW and average rent from USD 255 to USD 290 per kW-month. Growth slows a little to 8.40% after 2025 because retail halls compete with wholesale campuses for the same grid connections, but the mix improves: racks above 30 kW rise from 9.00% to 28.00% of retail colocation value by 2035, and each of them pays far more rent per cabinet than a 5 kW storage rack. Equinix raised its 2026 revenue guidance to USD 10.325 to 10.365 billion on 28 October 2026, about 12% above its USD 9.217 billion of 2025 revenue (Source: Equinix third-quarter 2026 results), which shows retail leaders growing faster than the 9.70% DC Market Insights expects for the whole retail colocation market in 2026.
Market Scope: What Counts as Retail Colocation?
The Retail Colocation Market counts USD 25.87 billion of 2025 rent and interconnection fees paid for contracts under 1 MW of IT load in third-party multi-tenant data centers.
Included
- Rack and cage colocation: single cabinets, half racks and caged rows sold per kW or per cabinet with power included in the rent.
- Private suites: lockable rooms or small halls under 1 MW leased to one customer.
- Interconnection services: physical cross-connects, internet exchange ports and virtual cloud on-ramps sold by the colocation operator.
Excluded
- Wholesale leases of 1 MW or more, counted in the Wholesale Colocation Market.
- Hyperscale self-built campuses, public cloud, managed hosting and hybrid cloud services sold on top of the rack, and metered power pass-through billed above the contracted rent.
- Edge micro sites below 100 kW at cell towers and offices, and IT equipment owned by the tenant.
How the Segments Fit Together
Offering, end user, rack density, organization size, region and country are six views of the same USD 25.87 billion; each sums to the total every year.
Why Do Retail Colocation Market Estimates Differ?
Retail colocation estimates differ because the USD 28.38 billion for 2026 counts only rent and interconnection on contracts under 1 MW, while broader definitions add wholesale, power or managed services.
Estimates for the “colocation market” add wholesale leases, which DC Market Insights values at USD 38.88 billion in 2025 on their own, and some also add metered power pass-through, managed hosting, hybrid cloud services and hyperscale-owned capacity. Others leave out interconnection fees, which removes about USD 3.95 billion from 2025. Small and medium enterprises are in scope: they pay USD 8.28 billion, or 32.00%, of 2025 retail colocation value. The figures reconcile with the retail line of the Multi-Tenant Data Center Market (USD 25.87 billion in 2025).
| Element | In this report? | Why |
|---|---|---|
| Racks, cages and private suites under 1 MW | Yes, USD 21.92 billion in 2025 | Core retail contract |
| Cross-connects and cloud on-ramps | Yes, USD 3.95 billion in 2025 | Sold with the rack by the same operator |
| Wholesale leases of 1 MW or more | No | Separate market, USD 38.88 billion in 2025 |
| Metered power pass-through | No | Electricity cost, not rent |
| Managed hosting and cloud | No | Service layer above the rack |
Market Drivers: Why Are Enterprises Still Buying Retail Colocation?
Three drivers explain most of the USD 32.11 billion that retail colocation adds between 2025 and 2035: regulated buyers, inference racks and interconnection density.
DORA Puts Colocation Providers Under Financial Supervision
The European Union (EU) Digital Operational Resilience Act (DORA) has applied since 17 January 2025, and on 18 November 2025 the European Supervisory Authorities designated 19 critical information and communication technology (ICT) third-party providers, including Equinix (EMEA) B.V. and InterXion HeadQuarters B.V. (Source: ESMA list of designated critical providers). Banks and insurers now have to show exit plans and multi-site resilience, which keeps their core systems in retail cages they control. DC Market Insights values financial services firms at USD 4.14 billion of 2025 retail colocation spend, rising to USD 8.12 billion by 2035.
Record 0-1 MW Bookings at Digital Realty: USD 152 Million in One Quarter
Digital Realty signed USD 130 million of annualised rent from contracts under 1 MW and USD 22 million from interconnection in the third quarter of 2026, its first two quarters above USD 100 million in that category (Source: Digital Realty, 29 October 2026). At the DC Market Insights average rent of USD 290 per kW-month, USD 130 million a year equals about 37 MW of new retail load in a single quarter. Most of it is enterprise inference, which DC Market Insights puts at USD 2.07 billion in 2025, growing 16.89% a year.
Interconnection Density: 500,000 Cross-Connects at One Provider
Equinix added 9,700 net interconnections in the second quarter of 2026 and 6,900 in the third, after passing 500,000 at the end of 2025 (Source: Equinix, 29 July and 28 October 2026). Each cloud on-ramp a tenant adds pulls more of its network into the same building, so interconnection services grow from USD 3.95 billion to USD 9.26 billion between 2025 and 2035, 8.90% a year.
Market Trends: How Is Retail Colocation Demand Changing?
Retail colocation is moving to denser racks, larger private suites and higher rents: average rent climbs 20.69% from USD 290 to USD 350 per kW-month by 2035.
Liquid-Cooled Inference Rooms Inside Retail Sites
On 28 October 2026 Equinix announced EPIC, a network of production-ready liquid cooling environments, and Inference Exchange, both aimed at enterprises deploying AI inferencing in its retail sites (Source: Equinix, 28 October 2026). Racks above 30 kW grow from USD 2.33 billion to USD 16.23 billion of retail colocation value by 2035, 21.43% a year, while racks below 10 kW grow only 2.03% a year.
Renewal Spreads of 11.8% to 16%
Digital Realty renewed leases 11.8% higher on a cash basis in the third quarter of 2026, and Keppel DC REIT reported rental reversion of about 16% in the same quarter (Source: Keppel DC REIT third-quarter 2026 update, 23 October 2026). Old retail contracts signed at USD 200 to 250 per kW-month roll onto current prices, which lifts the average without any new floor space.
Australia’s Billing Utilisation Up 58%
NEXTDC reported 175.0 MW of billing utilisation at 30 June 2026, up 58% from 110.9 MW a year earlier, and A$496.5 million of revenue for financial year 2026 (Source: NEXTDC ASX release, 27 August 2026). Australia’s retail colocation value grows 10.30% a year in the DC Market Insights model, from USD 879.59 million in 2025.
Market Challenges: What Slows Retail Colocation Growth?
Two constraints hold retail colocation growth at 8.40% a year, below the 9.08% of 2020-2025: power competition with wholesale campuses and efficiency retrofits in Europe.
Wholesale Campuses Take the Grid Connections
Private data center construction spending in the United States reached USD 84.95 billion at a seasonally adjusted annual rate in August 2026, 73.2% above August 2025 (Source: U.S. Census Bureau, value of construction put in place), and most of it is for 100 MW+ campuses. The federal permitting order of July 2025 covers only projects above USD 500 million or 100 MW of new load (Source: Executive Order 14318), so multi-tenant retail sites in city centres gain nothing from it and wait in the same utility queues.
Germany’s 1.5 PUE Deadline for Older Retail Sites
Germany’s Energy Efficiency Act (EnEfG) section 11 requires existing data centers to reach a power usage effectiveness (PUE) of 1.5 or lower from 1 July 2027 and 1.3 from 1 July 2030, and new sites from 1 July 2026 must reach 1.2 (Source: EnEfG §11, gesetze-im-internet.de). Many retail sites in Frankfurt were built in the 2000s for 3 to 5 kW racks, and their owners must spend on cooling before they can raise rents, which keeps Germany’s growth at 7.80% a year.
Market Opportunities: Where Will New Retail Colocation Revenue Come From?
Two pools add USD 17.18 billion of retail colocation value between 2025 and 2035: USD 12.59 billion from private suites and USD 4.59 billion from India and the Middle East and Africa.
Private Suites for Inference Clusters: USD 18.51 Billion by 2035
Private suites grow from USD 5.92 billion in 2025 to USD 18.51 billion in 2035, 12.08% a year, because 8 to 20 inference racks at 40 kW or more fill a 300 to 900 kW room. Operators that can deliver liquid cooling in rooms under 1 MW capture this without competing in wholesale leasing.
India and the Middle East and Africa: USD 6.01 Billion by 2035
India’s retail colocation value grows 15.80% a year from USD 517.41 million in 2025 to USD 2.24 billion in 2035, and the Middle East and Africa grows 15.33% a year from USD 905.46 million to USD 3.77 billion. Banks, telecom operators and governments there buy retail space in country to meet data residency rules.
Pricing Analysis: How Much Does Retail Colocation Cost per kW?
Retail colocation costs about USD 290 per kW per month on average in 2025, power included, rising to USD 350 by 2035, DC Market Insights estimates.
| Year | Retail IT Load in Billing (MW) | Average Rent (USD per kW-month) | Interconnection Fees (% of Rent) | Market Size (USD million) |
|---|---|---|---|---|
| 2020 | 4,700 | 255 | 16.5% | 16,755.03 |
| 2025 | 6,300 | 290 | 18.0% | 25,870.32 |
| 2030 | 8,600 | 325 | 18.5% | 39,744.90 |
| 2035 | 11,600 | 350 | 19.0% | 57,976.80 |
Public price anchors: Digital Realty’s renewal rents rose 11.8% on a cash basis in the third quarter of 2026; Keppel DC REIT’s rental reversion was about 14% for the first nine months of 2026; and Equinix guided 2026 revenue about 12% above 2025, faster than the 9.70% DC Market Insights expects for the whole market. A 5 kW enterprise rack at USD 290 per kW-month costs about USD 1,450 a month before cross-connects; a 40 kW inference rack at the same rate costs USD 11,600.
Standards and Regulation: Which Rules Shape Retail Colocation Contracts?
Seven rules shape retail colocation contracts in 2026, most of them in Europe, where 27.00% of 2025 retail colocation value is earned.
- EU Delegated Regulation 2024/1364: data centers with 500 kW or more of installed IT power report PUE, water use and renewable shares by 15 May each year (Source: EUR-Lex, Regulation 2024/1364).
- EU data centre rating scheme, Delegated Regulation C(2026) 3472 of 21 September 2026: electronic labels from 15 August 2027, with sites under 500 kW free to join (Source: European Commission).
- EU consultation on minimum performance standards for data centres, open until 14 December 2026 with a proposal planned for the second quarter of 2027 (Source: European Commission, 21 September 2026).
- Germany EnEfG sections 11 and 12: PUE limits, 100% renewable electricity from 1 January 2027, and an energy management system for colocation IT operators from 500 kW (Source: gesetze-im-internet.de).
- DORA, Regulation 2022/2554, in application since 17 January 2025, with 19 critical ICT providers designated on 18 November 2025 (Source: EIOPA and ESMA).
- NIS2 Directive 2022/2555, transposition deadline 17 October 2024; the Commission referred Ireland, Spain, France and the Netherlands to the Court of Justice on 8 July 2026 (Source: European Commission).
- Singapore Green Data Centre Roadmap: at least 300 MW of new capacity in the near term and PUE of 1.3 or lower at full load within 10 years (Source: Infocomm Media Development Authority).
Market Segmentation: Which Offerings and Tenants Lead Retail Colocation?
Rack and cage colocation leads retail colocation with USD 16.00 billion in 2025, while private suites grow fastest at 12.08% a year.
By Offering
Racks and cages keep the largest share because most enterprises need fewer than 20 cabinets per metro.
| Offering | 2025 (USD million) | Share 2025 | 2035 (USD million) | CAGR 2025-2035 |
|---|---|---|---|---|
| Rack and Cage Colocation | 16,004.52 | 61.86% | 30,206.40 | 6.56% |
| Private Suites | 5,919.48 | 22.88% | 18,513.60 | 12.08% |
| Interconnection Services | 3,946.32 | 15.25% | 9,256.80 | 8.90% |
By End User
Enterprise IT departments pay the most retail colocation rent, and AI inference tenants grow fastest at 16.89% a year.
| End User | 2025 (USD million) | Share 2025 | 2035 (USD million) | CAGR 2025-2035 |
|---|---|---|---|---|
| Enterprise IT | 9,313.32 | 36.00% | 17,972.81 | 6.80% |
| Network and Content Providers | 5,174.06 | 20.00% | 9,856.06 | 6.66% |
| Cloud and IT Service Providers | 5,174.06 | 20.00% | 12,175.13 | 8.93% |
| Financial Services Firms | 4,139.25 | 16.00% | 8,116.75 | 6.97% |
| AI Inference Tenants | 2,069.63 | 8.00% | 9,856.06 | 16.89% |
By Rack Density
Racks above 30 kW rise from 9.00% to 28.00% of retail colocation value by 2035.
| Rack Density | 2025 (USD million) | Share 2025 | 2035 (USD million) | CAGR 2025-2035 |
|---|---|---|---|---|
| Below 10 kW | 14,228.68 | 55.00% | 17,393.04 | 2.03% |
| 10 to 30 kW | 9,313.32 | 36.00% | 24,350.26 | 10.09% |
| Above 30 kW | 2,328.33 | 9.00% | 16,233.50 | 21.43% |
By Organization Size
Small and medium enterprises grow 9.38% a year, faster than large enterprises at 7.92%, as they replace server rooms with a few rented racks.
| Organization Size | 2025 (USD million) | Share 2025 | 2035 (USD million) | CAGR 2025-2035 |
|---|---|---|---|---|
| Large Enterprises | 17,591.82 | 68.00% | 37,684.92 | 7.92% |
| Small and Medium Enterprises | 8,278.50 | 32.00% | 20,291.88 | 9.38% |
DC Exclusive: Retail Colocation Operator Scorecard, 9 Disclosures from 5 Operators, Q2-Q3 2026
The Retail Colocation Operator Scorecard is a DC Market Insights model built on 12 inputs: 9 operator disclosures from the second and third quarters of 2026 plus 3 model rates (USD 290 rent per kW-month, 18% interconnection share, 6,300 MW billed load).
| Operator | Metric | Value | Change or Detail |
|---|---|---|---|
| Equinix | Q3 2026 revenue | USD 2,571 million | +11% year over year |
| Equinix | Q3 2026 interconnection revenue | USD 465 million | +10%; 6,900 net additions |
| Equinix | Q2 2026 net interconnection additions | 9,700 | record quarter |
| Digital Realty | Q3 2026 0-1 MW plus interconnection bookings | USD 152 million | USD 130 million + USD 22 million |
| Digital Realty | Q2 2026 0-1 MW plus interconnection bookings | USD 108 million | first quarter above USD 100 million |
| Digital Realty | Q2 2026 interconnection and other revenue | USD 130.4 million | about USD 0.52 billion a year |
| American Tower (CoreSite) | Q3 2026 data center revenue | USD 313 million | +17.4% |
| NEXTDC | Billing utilisation, 30 June 2026 | 175.0 MW | +58% |
| Keppel DC REIT | Occupancy, 30 September 2026 | 93.0% | reversion about 16% in Q3 |
Read together, the scorecard shows three things. First, Digital Realty’s USD 130 million of quarterly 0-1 MW bookings equals about 37 MW of retail load at USD 290 per kW-month, so one operator alone booked about 0.6% of the 6,300 MW retail base in a quarter. Second, Equinix’s USD 1.66 billion of 2025 interconnection revenue is 41.94% of the USD 3.95 billion interconnection line, consistent with its lead in cross-connect count. Third, CoreSite’s 17.4% revenue growth and Keppel DC REIT’s 93.0% occupancy point to tight retail supply in both the United States and Asia Pacific, which supports the rent path from USD 290 to USD 350 per kW-month.
Regional Insights: Which Region Leads Retail Colocation?
North America leads retail colocation with 40.00% of 2025 value, and the Middle East and Africa grows fastest at 15.33% a year.
| Region | 2025 (USD million) | Share 2025 | 2035 (USD million) | CAGR 2025-2035 |
|---|---|---|---|---|
| North America | 10,348.13 | 40.00% | 20,871.65 | 7.27% |
| Europe | 6,984.99 | 27.00% | 13,914.43 | 7.13% |
| Asia Pacific | 6,726.28 | 26.00% | 16,813.27 | 9.59% |
| Latin America | 905.46 | 3.50% | 2,608.96 | 11.16% |
| Middle East and Africa | 905.46 | 3.50% | 3,768.49 | 15.33% |
North America
North America leads with USD 10.35 billion in 2025. American Tower’s data center segment, CoreSite, grew revenue 17.4% to USD 313 million in the third quarter of 2026 (Source: American Tower Q3 2026 results), helped by interconnection-heavy sites in Los Angeles, Northern Virginia and Chicago.
Europe
Europe holds USD 6.98 billion in 2025 and grows 7.13% a year. DORA keeps banks in Frankfurt, London, Amsterdam and Paris in controlled cages, while the EnEfG and EU reporting rules raise operating costs for older sites.
Asia Pacific
Asia Pacific grows 9.59% a year from USD 6.73 billion. NEXTDC’s billing utilisation rose 58% to 175.0 MW, and Singapore aims to add at least 300 MW of capacity under its Green Data Centre Roadmap.
Latin America
Latin America grows 11.16% a year from USD 905.46 million, led by Brazil at 12.40% as banks and payment firms in São Paulo add retail cages.
Middle East and Africa
The Middle East and Africa is the fastest region at 15.33% a year, from USD 905.46 million to USD 3.77 billion, as banks and government agencies in Saudi Arabia, the United Arab Emirates (UAE) and South Africa buy in-country retail space.
Country Analysis: Which Countries Spend Most on Retail Colocation?
The United States is the largest retail colocation country with USD 9.31 billion in 2025, and India is the fastest large country at 15.80% a year.
| Rank | Country | Region | 2025 (USD million) | 2035 (USD million) | CAGR 2025-2035 |
|---|---|---|---|---|---|
| 1 | United States | North America | 9,313.32 | 18,320.70 | 7.00% |
| 2 | United Kingdom | Europe | 1,603.96 | 3,495.03 | 8.10% |
| 3 | Japan | Asia Pacific | 1,552.22 | 3,742.65 | 9.20% |
| 4 | Germany | Europe | 1,448.74 | 3,070.28 | 7.80% |
| 5 | China | Asia Pacific | 1,397.00 | 3,493.82 | 9.60% |
| 6 | Singapore | Asia Pacific | 931.33 | 2,125.21 | 8.60% |
| 7 | Australia | Asia Pacific | 879.59 | 2,344.42 | 10.30% |
| 8 | Netherlands | Europe | 827.85 | 1,690.42 | 7.40% |
| 9 | France | Europe | 801.98 | 1,780.12 | 8.30% |
| 10 | Canada | North America | 776.11 | 1,771.01 | 8.60% |
| 11 | India | Asia Pacific | 517.41 | 2,243.46 | 15.80% |
| 12 | Brazil | Latin America | 413.93 | 1,332.25 | 12.40% |
The top 12 countries hold 79.10% of 2025 retail colocation value. The United Kingdom ranks second because London is Europe’s main interconnection hub, ahead of Japan and Germany.
Forecast Scenarios: How Big Could Retail Colocation Be by 2035?
Retail colocation reaches USD 57.98 billion by 2035 in the base case, within a range of USD 48.12 to 68.99 billion.
| Scenario | 2035 (USD million) | CAGR 2025-2035 | Assumption |
|---|---|---|---|
| Low | 48,120.74 | 6.40% | Retail load in billing reaches about 10,100 MW and rent stays near USD 335 per kW-month as wholesale campuses absorb grid capacity. |
| Base | 57,976.80 | 8.40% | 11,600 MW in billing at USD 350 per kW-month, interconnection 19% of rent. |
| High | 68,992.39 | 10.31% | Enterprise inference moves mostly into retail suites, lifting billed load to about 13,000 MW at USD 370 per kW-month. |
Key Players and Market Share: Who Leads Retail Colocation?
Equinix leads retail colocation with about 31% of 2025 value, and the top five operators hold about 52% (DC Market Insights estimates based on company revenue disclosures).
- Equinix
- Digital Realty
- NTT DATA
- American Tower (CoreSite)
- KDDI (Telehouse)
- Iron Mountain
- Centersquare
- DataBank
- Cologix
- Flexential
- Global Switch
- Colt Data Centre Services
- Keppel DC REIT
- NEXTDC
- ST Telemedia Global Data Centres
Equinix reported USD 9.217 billion of 2025 revenue, 5% above 2024, and raised its 2026 guidance to USD 10.325 to 10.365 billion (Source: Equinix). Digital Realty reported USD 1.9 billion of third-quarter 2026 revenue and a record USD 2.5 billion backlog (Source: Digital Realty). Iron Mountain’s data center revenue rose 38.8% to USD 262.9 million in the second quarter of 2026, mostly from wholesale leases (Source: Iron Mountain, 5 August 2026). Concentration is moderate: outside the top five, retail colocation is split among regional operators that serve one country or a few metros.
Recent Developments in Retail Colocation
Six dated events from July to October 2026 show retail colocation demand rising with AI inference and new EU rules.
- In October 2026, Equinix reported USD 2.571 billion of third-quarter revenue, raised 2026 guidance and launched EPIC liquid-cooling environments and Inference Exchange (Source: Equinix, 28 October 2026).
- In October 2026, Digital Realty booked a record USD 152 million in its 0-1 MW plus interconnection category (Source: Digital Realty, 29 October 2026).
- In October 2026, American Tower reported 17.4% growth in data center revenue to USD 313 million for the third quarter (Source: American Tower, 27 October 2026).
- In September 2026, the European Commission adopted the EU data centre rating scheme and opened a consultation on minimum performance standards (Source: European Commission, 21 September 2026).
- In August 2026, NEXTDC reported 175.0 MW of billing utilisation, up 58% (Source: NEXTDC, 27 August 2026).
- In July 2026, the European Commission referred four member states to the Court of Justice for not transposing NIS2 (Source: European Commission, 8 July 2026).
Research Methodology: How the Retail Colocation Model Works
DC Market Insights sizes retail colocation bottom-up as retail IT load in billing × average rent × 12 months, plus interconnection fees: 6,300 MW × USD 290 per kW-month × 12 = USD 21.92 billion, plus 18% = USD 3.95 billion, for USD 25.87 billion in 2025.
Retail IT load in billing rises from 4,700 MW in 2020 to 11,600 MW in 2035, about 5.4% of the 116 GW installed data center IT base in 2025 and 3.7% of 311 GW in 2035. Offering, end user, rack density, organization size, region and country splits are DC Market Insights shares that sum to the total every year. Three bound checks:
- Ceiling 1: retail plus wholesale colocation, USD 25.87 billion and USD 38.88 billion, equals USD 64.75 billion in 2025, below the DC Market Insights total colocation estimate of USD 74.46 billion, which also includes other hosted capacity.
- Ceiling 2: Equinix’s USD 9.217 billion of 2025 revenue, which also includes xScale, managed and other services, equals 35.63% of the market, so no single operator can exceed its disclosed revenue.
- Floor: interconnection revenue disclosed by Equinix (USD 1.66 billion in 2025) and Digital Realty (about USD 0.52 billion a year) plus American Tower’s data center revenue (about USD 1.05 billion in 2025) totals about USD 3.23 billion, well below USD 25.87 billion, as expected for three of more than 40 operators.
Sources are company filings, stock exchange releases and government documents listed in the fact ledger; the method is described in DC Market Insights research methodology. Related editions: Data Center Colocation Market and Internet Data Center (IDC) Market.
Table of contents
- 01Introduction
- 1.1Report Description
- 1.2Market Definition and Scope
- 1.3Research Methodology
- 02Executive Summary
- 2.1Market Snapshot, 2025, 2026 and 2035
- 2.2Key Market Statistics
- 2.3Key Takeaways
- 03Market Scope and Estimate Comparison
- 3.1Included and Excluded
- 3.2How the Segments Fit Together
- 3.3Why Estimates Differ
- 04Market Dynamics
- 4.1DORA Puts Colocation Providers Under Financial Supervision
- 4.2Record 0-1 MW Bookings at Digital Realty: USD 152 Million in One Quarter
- 4.3Interconnection Density: 500,000 Cross-Connects at One Provider
- 4.4Liquid-Cooled Inference Rooms Inside Retail Sites
- 4.5Renewal Spreads of 11.8% to 16%
- 4.6Australia's Billing Utilisation Up 58%
- 4.7Wholesale Campuses Take the Grid Connections
- 4.8Germany's 1.5 PUE Deadline for Older Retail Sites
- 4.9Private Suites for Inference Clusters: USD 18.51 Billion by 2035
- 4.10India and the Middle East and Africa: USD 6.01 Billion by 2035
- 05Pricing Analysis
- 5.1Average Rent per kW-Month, 2020-2035
- 5.2Public Price Anchors
- 06Standards and Regulation
- 6.1EU Delegated Regulation 2024/1364
- 6.2EU Data Centre Rating Scheme
- 6.3EU Minimum Performance Standards Consultation
- 6.4Germany Energy Efficiency Act Sections 11 and 12
- 6.5DORA Critical ICT Providers
- 6.6NIS2 Directive
- 6.7Singapore Green Data Centre Roadmap
- 07Market Segmentation by Offering
- 7.1Rack and Cage Colocation
- 7.2Private Suites
- 7.3Interconnection Services
- 08Market Segmentation by End User
- 8.1Enterprise IT
- 8.2Network and Content Providers
- 8.3Cloud and IT Service Providers
- 8.4Financial Services Firms
- 8.5AI Inference Tenants
- 09Market Segmentation by Rack Density
- 9.1Below 10 kW
- 9.210 to 30 kW
- 9.3Above 30 kW
- 10Market Segmentation by Organization Size
- 10.1Large Enterprises
- 10.2Small and Medium Enterprises
- 11DC Exclusive: Retail Colocation Operator Scorecard
- 11.1Nine Operator Disclosures, Q2-Q3 2026
- 11.2What the Scorecard Implies for Rent and Load
- 12Regional Insights
- 12.1North America
- 12.2Europe
- 12.3Asia Pacific
- 12.4Latin America
- 12.5Middle East and Africa
- 13Country Analysis
- 13.1United States
- 13.2United Kingdom
- 13.3Japan
- 13.4Germany
- 13.5China
- 13.6Singapore
- 13.7Australia
- 13.8Netherlands
- 13.9France
- 13.10Canada
- 13.11India
- 13.12Brazil
- 14Forecast Scenarios
- 14.1Low Case
- 14.2Base Case
- 14.3High Case
- 15Competitive Insights
- 15.1Equinix
- 15.2Digital Realty
- 15.3NTT DATA
- 15.4American Tower (CoreSite)
- 15.5KDDI (Telehouse)
- 15.6Iron Mountain
- 15.7Market Concentration
- 16Recent Developments
- 16.1Operator Results, July-October 2026
- 16.2EU Rules, July-September 2026
- Fig. 1Retail Colocation Market Size, 2020-2035 (USD Billion)
- Table 1Report Attributes
- Table 2Retail Colocation Scope Comparison
- Table 3Retail Colocation Pricing, 2020-2035
- Table 4Market by Offering, 2025 and 2035
- Table 5Market by End User, 2025 and 2035
- Table 6Market by Rack Density, 2025 and 2035
- Table 7Market by Organization Size, 2025 and 2035
- Table 8Retail Colocation Operator Scorecard
- Table 9Market by Region, 2025 and 2035
- Table 10Top 12 Countries, 2025 and 2035
- Table 11Forecast Scenarios, 2035
About this report
Written by Amit Jain and reviewed by Deepti Agrawal, Senior Editor, Research. Figures are built top-down and bottom-up and reconciled before publication, with 2025 as the base year.
Read our methodologyHow we built this
- Historical period2020-2024
- Base year2025
- Forecast period2026-2035
- Sizing approachTop-down + bottom-up
Need more than the report?
Advisory on this market
Due diligence, site selection and market entry work, by the analysts who wrote this report.
See consulting servicesFrequently asked questions
USD 28.38 billion in 2026, up 9.70% from USD 25.87 billion in 2025, according to DC Market Insights estimates. The market is projected to reach USD 57.98 billion by 2035, a CAGR of 8.40% from 2025.
8.40% a year from 2025 to 2035, after 9.08% a year from 2020 to 2025, as retail IT load in billing rises from 6,300 MW to 11,600 MW and average rent from USD 290 to USD 350 per kW-month.
USD 25.87 billion was paid in 2025 for racks, cages and private suites under 1 MW in third-party data centers, plus cross-connects. Wholesale leases of 1 MW or more, power pass-through and managed hosting are excluded.
About USD 290 per kW per month on average in 2025, power included, DC Market Insights estimates, rising to USD 350 by 2035. A 5 kW rack costs about USD 1,450 a month before cross-connects.
Retail colocation rents racks, cages and suites under 1 MW with interconnection, worth USD 25.87 billion in 2025; wholesale leases 1 MW or more on 10- to 25-year terms, worth USD 38.88 billion.
USD 3.95 billion in 2025, 15.25% of retail colocation value, growing 8.90% a year to USD 9.26 billion by 2035. Equinix earned USD 1.66 billion of interconnection revenue in 2025.
Racks above 30 kW grow fastest at 21.43% a year to USD 16.23 billion by 2035. By offering, private suites lead at 12.08%, and by end user, AI inference tenants at 16.89%.
North America, with USD 10.35 billion or 40.00% of 2025 value. The Middle East and Africa grows fastest at 15.33% a year, and India is the fastest large country at 15.80%.
Equinix leads with about 31% of 2025 value, and the top five hold about 52% (DC Market Insights estimate). Digital Realty, NTT DATA, American Tower (CoreSite), KDDI (Telehouse), Iron Mountain and DataBank also compete.
USD 28.38 billion in 2026 counts only rent and interconnection on contracts under 1 MW. Estimates that add wholesale leases, power pass-through, managed hosting or cloud come out much larger.
Get this report
How do I get the full report?
Request a quote; we reply by email within one business day.
How and when will I receive the report?
By email, within 24–48 business hours of payment.
How can I pay?
Once you accept the quote, we email you a secure payment link.
Can I see a sample first?
Yes. Request a free sample and we will email it to you.
Can the report be tailored to my needs?
Yes. We can add countries, segments or data cuts. Talk to an analyst about the scope you need.
Can I get an invoice or pay against a purchase order?
Write to sales@dcmarketinsights.com and our team will help.