
Manufacturing Data Center Market Size, Share & Forecast to 2035
Market at a glance
The Manufacturing Data Center market was worth USD 21.06 billion in 2025 and is forecast to reach USD 48.79 billion by 2035, growing at a 8.76% CAGR.
 By Amit Jain, Senior Consultant, ICT & Emerging Technologies
 Reviewed by Deepti Agrawal
Last updated 26 Oct 2026
Base year 2025 PDF + Excel
What is inside the report
- 01Introduction
- 02Executive Summary
- 03Market Scope
- 04Why Market Estimates Differ
- 05Market Drivers
- 06Market Trends
- 07Market Challenges and Restraints
- 08Market Opportunities
- 09Pricing Analysis
- 10Standards and Regulation
- 18chapters
- 2020-2024Historical period
- 2026-2035Forecast period
- 17Companies profiled
Segmentation
Companies profiled
- Dell Technologies
- Hewlett Packard Enterprise
- Lenovo
- Inspur
- Super Micro Computer
- NVIDIA
- Schneider Electric
- Vertiv
- Eaton
- ABB
- Rittal
- Siemens
- Equinix
- Digital Realty
- Deutsche Telekom
- NTT DATA
- Foxconn
Recent developments
China said it had built more than 13,000 advanced-level smart factories and reached 2,592 EFLOPS of smart computing power (Source: State Council of China).
ENISA reported that manufacturing took 25.2% of claimed ransomware deployments in the EU in 2025 (Source: ENISA annual threat report).
the EU opened its call for up to seven AI Gigafactories with up to EUR 10 billion of public funding (Source: European Commission).
Korea set a 20 trillion won budget for manufacturing AI transformation to 2030 (Source: Ministry of Science and ICT).
Deutsche Telekom launched its Munich Industrial AI Cloud with 10,000 NVIDIA GPUs, and Eli Lilly's 1,016-GPU LillyPod went live (Source: Deutsche Telekom; NVIDIA).
Samsung, SK Group and Hyundai Motor Group each announced AI factories of about 50,000 NVIDIA GPUs (Source: NVIDIA; Hyundai Motor Group).
Full analysis
The Manufacturing Data Center Market is valued at USD 23.29 billion in 2026 and is projected to reach USD 48.79 billion by 2035, up from USD 21.06 billion in 2025, a CAGR of 8.76% from 2025 to 2035 (DC Market Insights estimate). What moves this money is manufacturers buying their own GPU (graphics processing unit) capacity instead of renting it: on 31 October 2025 Hyundai Motor Group, Samsung Electronics and SK Group each announced an AI factory of about 50,000 NVIDIA GPUs, and Hyundai’s programme with NVIDIA and the Korean government alone is worth about USD 3 billion (Hyundai Motor Group, October 2025). Plants also keep data close because they are the first target of extortion: manufacturing drew 25.2% of claimed ransomware deployments in the European Union (EU) in 2025, more than any other sector (ENISA, September 2026). The build receipt: 5,200 megawatts (MW) of information technology (IT) load in use by manufacturers in 2025 x USD 4.05 million of spending per MW = USD 21.06 billion, of which USD 15.30 billion is IT hardware and USD 3.03 billion is colocation and hosting fees. Industrial AI training and inference is the fastest workload at 18.88% a year, and Asia Pacific is the fastest region at 10.29% because Korea’s chip and car makers are building the largest private GPU halls in the sector.
Key Market Statistics: How Big Is the Manufacturing Data Center Market in 2026?
DC Market Insights puts manufacturing data center spending at USD 23.29 billion in 2026, 10.59% more than in 2025, as the Korean AI factories, the Munich industrial AI cloud and ransomware-proof second sites add load faster than old server rooms are retired.
- Manufacturing data center market size 2025: USD 21.06 billion
- Market size 2026: USD 23.29 billion
- Market size 2030: USD 34.69 billion
- Market size 2035: USD 48.79 billion
- CAGR 2025-2035: 8.76% (low case 7.13%, high case 10.10%)
- Largest component: IT hardware, USD 15.30 billion or 72.7% of 2025 value
- Fastest workload: industrial AI training and inference, 18.88% a year to USD 16.45 billion by 2035
- Largest industry: electronics and semiconductors, USD 5.06 billion in 2025, also the fastest industry at 10.45%
- Leading region: Asia Pacific, USD 8.00 billion or 38.0% of 2025 value, and the fastest at 10.29%
- Largest country: United States, USD 5.58 billion in 2025; fastest large country: India at 14.46%
- Market leaders: Dell Technologies, Hewlett Packard Enterprise and Lenovo in factory and corporate servers, and Schneider Electric and Vertiv in power and cooling (DC Market Insights assessment)
Executive Summary: Manufacturing Data Center Market Size, 2020-2035
The Global Manufacturing Data Center Market size was valued at USD 14.63 billion in 2020, reached USD 21.06 billion in 2025, and is anticipated to reach USD 48.79 billion by 2035, at a CAGR of 8.76% during the forecast period. From 2020 to 2025 spending rose 7.56% a year as manufacturers added plant data rooms, engineering simulation clusters and recovery sites after ransomware attacks; the rate rises to 8.76% from 2025 because GPU racks lift spending per MW.
| Attribute | Value |
|---|---|
| Historical period | 2020-2024 |
| Base year | 2025 |
| Forecast period | 2026-2035 |
| Market size 2025 | USD 21.06 billion |
| Market size 2026 | USD 23.29 billion |
| CAGR 2025-2035 | 8.76% |
| Market size 2035 | USD 48.79 billion |
| Segments covered | Component, industry, workload, deployment model, region, 12 countries |
Growth comes in two steps. Up to 2027 the Korean and Taiwanese AI factories carry the rise: DC Market Insights counts 171,216 GPUs announced by eight manufacturers and their partners, about 325 MW of IT load. After 2028 the spread of digital twins and plant data platforms under the EU Data Act carries it, and plant edge rooms grow to USD 11.71 billion by 2035.
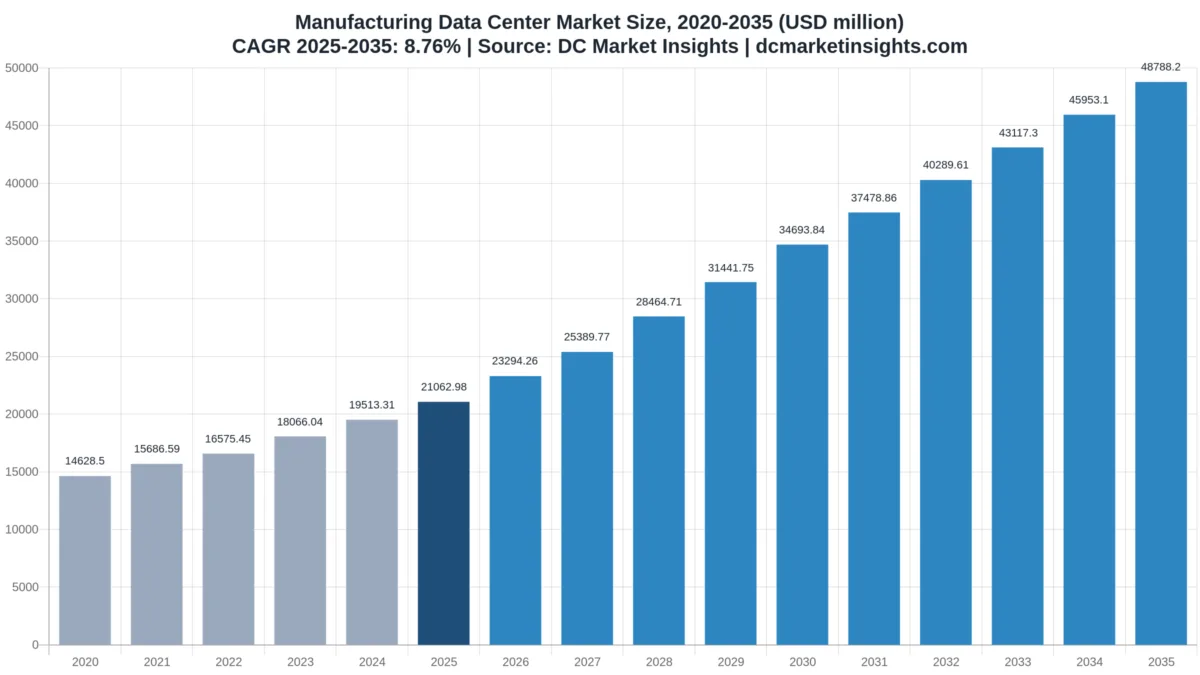
What Counts as Manufacturing Data Center Spending?
The market is the USD 21.06 billion that manufacturers spent in 2025 on data center capacity they own or lease for their own systems.
Included: servers, storage and network gear in manufacturers’ corporate data centers and plant rooms; GPU clusters owned by manufacturers (AI factories); colocation, wholesale and hosted private cloud capacity leased by manufacturers; electrical and mechanical plant (uninterruptible power supply or UPS, switchgear, cooling) in owned sites; construction, prefabricated enclosures and tenant fit-out. Buyers range from global groups to small and medium-sized enterprises (SMEs) with one plant room.
Excluded: public cloud service fees, manufacturing execution system (MES) and enterprise resource planning (ERP) software licences, operational technology (OT) such as controllers, robots and sensors, factory electricity bills, and GPU capacity a manufacturer rents by the hour from a public cloud.
How the segments fit together: the component split (USD 15.30 billion IT hardware, USD 3.03 billion colocation and hosting, USD 2.03 billion electrical and mechanical, USD 693.34 million construction) sums to USD 21.06 billion; the industry, workload, deployment-model, region and country splits each sum to the same total.
Why Do Manufacturing Data Center Market Estimates Differ?
DC Market Insights values the market at USD 23.29 billion in 2026 counting only data center capacity that manufacturers own or lease; broader estimates come out larger because they add services that sit outside the building.
Wider definitions add manufacturers’ public cloud bills, industrial internet of things (IIoT) platforms, MES and ERP software subscriptions, OT network equipment on the shop floor and the electricity that runs the halls. Some also count every server shipped to a manufacturing customer, even when it sits on a desk or a production line rather than in a data room. Those items are left out here because they are bought on different budgets and priced per user, per device or per kilowatt-hour, not per MW of data center load.
| Element | In this estimate | Why |
|---|---|---|
| Corporate and plant data center IT hardware | Yes, USD 15.30 billion | Bought per MW of data center load |
| Colocation and hosted private cloud leased by manufacturers | Yes, USD 3.03 billion | Priced per kilowatt (kW) per month |
| Power, cooling and buildings of owned sites | Yes, USD 2.73 billion | Capital spending on the site |
| Public cloud service fees | No | Usage-priced service, not capacity |
| MES, ERP and IIoT software | No | Priced per user or device |
| Robots, controllers and shop-floor OT networks | No | Plant equipment, not data center |
| Electricity for the halls | No | Operating cost of energy |
In scope are SMEs with a single plant room as well as global groups; out of scope are public cloud fees, MES licences, IIoT platforms, robots and electricity, even when a broader market name includes them.
Manufacturing Data Center Market Drivers: Why Are Factories Buying Compute?
Three forces add about USD 27.73 billion of yearly spending between 2025 and 2035: private AI factories, ransomware recovery and new rules on machine data.
Korea’s 150,000-GPU AI Factories at Samsung, SK and Hyundai
On 31 October 2025 NVIDIA said Korea’s government and industrial groups were adding more than 260,000 GPUs, and three manufacturers took 150,000 of them: Samsung Electronics is building a semiconductor AI factory with more than 50,000 GPUs, SK Group an AI factory with more than 50,000 GPUs whose first phase is due by late 2027, and Hyundai Motor Group a Blackwell factory with 50,000 GPUs (NVIDIA and company releases, October 2025). The Korean government then set a 20 trillion won public and private budget for manufacturing AI transformation (M.AX) to 2030 (Government of Korea, June 2026). DC Market Insights converts the three projects into about 285 MW of AI IT load, which is why AI racks rise from 312 MW in 2025 to 2,496 MW by 2035 and South Korea grows 10.05% a year.
Ransomware Makes Manufacturing the Most-Hit Sector in Europe
The European Union Agency for Cybersecurity (ENISA) recorded manufacturing as the most affected sector across all cybercrime incidents in 2025, at 14.4%, with 25.2% of claimed ransomware deployments; ransomware was 82.8% of financially motivated attacks on the sector. In the United States, the FBI Internet Crime Complaint Center (IC3) received more than 3,600 ransomware complaints in 2025 and named Critical Manufacturing first among the sectors hit by the top ten variants. Plants answer with isolated backup halls and second sites, which keeps backup, recovery and other workloads at USD 6.48 billion by 2035 and holds corporate data centers at USD 17.08 billion even as leasing grows.
EU Data Act and NIS2 Turn Machine Data Into a Regulated Asset
Since 12 September 2025 the EU Data Act gives users in industries such as manufacturing access to performance data from their industrial equipment (European Commission, September 2025). The Network and Information Security Directive (NIS2), due in national law from 17 October 2024, brings medium and large makers of computers, electronics, machinery and motor vehicles into scope. Both rules push plants to store machine data in places they control, which is why plant data and digital twins grow 10.05% a year to USD 8.78 billion by 2035 and Germany, Europe’s largest manufacturer with about USD 890 billion of value added in 2025 (World Bank), reaches USD 2.73 billion.
Manufacturing Data Center Market Trends: How Are Plants Changing Their Compute?
Manufacturers now share GPU halls, run AI on the plant floor and fold AI into national industrial plans; colocation and hosted private cloud rises from 27.0% of spending in 2025 to 41.0% in 2035.
Shared Industrial AI Clouds in Munich and Taipei
Deutsche Telekom installed 10,000 NVIDIA GPUs in its Munich data center for an Industrial AI Cloud open to customers from the first quarter of 2026, and BMW Group, Mercedes-Benz, Maserati and Schaeffler are named users (Deutsche Telekom and NVIDIA, 2025-2026). In Taiwan, Foxconn is investing USD 1.4 billion in a supercomputing center with 10,000 Blackwell Ultra GPUs, run by its subsidiary Big Innovation Company as an NVIDIA cloud partner with TSMC researchers as users (Foxconn, May and November 2025). Mid-sized plants that cannot fill a 70 MW hall rent racks in these shared halls, so colocation and hosting is the fastest component at 12.03% a year.
China’s 13,000 Smart Factories and 2,592 EFLOPS of AI Compute
China’s State Council reported on 20 October 2026 that the country has built more than 13,000 advanced-level smart factories and that its smart computing power reached 2,592 exaflops (EFLOPS) at the end of September 2026, up 146% in a year. The August 2025 AI Plus guideline targets more than 70% penetration of AI agents and intelligent terminals by 2027. China is the largest manufacturer, with about USD 4.82 trillion of value added in 2025 (World Bank), and DC Market Insights puts its manufacturing data center market at USD 3.16 billion in 2025, growing 9.80% a year.
Pharmaceutical Plants Get Their Own AI Factories
Eli Lilly’s LillyPod, a DGX SuperPOD with 1,016 Blackwell Ultra GPUs, went live on 26 February 2026 and will be used across clinical development and manufacturing (NVIDIA, February 2026). DC Market Insights counts such process-industry clusters in the chemicals and materials and other manufacturing segments, which together reach USD 13.90 billion by 2035.
Manufacturing Data Center Market Challenges: What Slows Factory Data Centers?
Energy reporting and thin AI skills slow the market; without them DC Market Insights’ high case of USD 55.13 billion by 2035 would be the base.
EU Energy Reporting Reaches In-House Halls Above 500 kW
Under Article 12 of the Energy Efficiency Directive (EED), every data centre with at least 500 kilowatts (kW) of installed IT power, in-house halls included, must publish its energy data; only 770 sites, about 36% of those covered, reported in the first round, and EU data centres used 68 terawatt-hours (TWh) in 2024 on a path to 114 TWh by 2030 (European Commission data centre energy report, September 2026). Germany applies a lower 300 kW threshold. Reporting costs and efficiency targets push European plants to close old server rooms rather than expand them, which keeps Europe’s growth at 7.32% a year, the slowest of the five regions.
Low AI Uptake Outside Electronics
Eurostat found that 20.0% of EU enterprises with 10 or more employees used AI in 2025, and the Joint Research Centre (JRC) reported in October 2026 that electronics firms rose from 12% to 30% between 2021 and 2025 while manufacturing overall stays low. Korea’s M.AX plan budgets for 30,000 trained specialists for the same reason. DC Market Insights holds food and beverage to 7.49% a year and chemicals and materials to 7.10%, against 10.45% for electronics and semiconductors.
Manufacturing Data Center Market Opportunities: Where Is the New Money?
Plant edge rooms and hosted GPU capacity add USD 22.02 billion of yearly spending between 2025 and 2035.
Plant Edge and Micro Data Centers for Vision Inspection and Digital Twins
Plant edge and micro data centers grow from USD 4.00 billion in 2025 to USD 11.71 billion by 2035, 11.33% a year. Sealed, ingress-protection-rated enclosures such as Schneider Electric’s EcoStruxure Micro Data Center R-Series (16U to 42U) and Siemens’ Industrial Edge platform put inference next to the line, where camera inspection and robot control cannot wait for a round trip to a distant cloud region. The plant share of manufacturing load rises from 19% to 24% (DC Market Insights estimate); the wider Edge Data Center Market covers all edge buyers.
Hosted GPU Capacity for Mid-Sized Manufacturers
Colocation and hosted private cloud spending by manufacturers rises from USD 5.69 billion to USD 20.00 billion by 2035. Telekom’s Munich cloud is aimed at industrial companies and SMEs, and the EU opened a call on 30 July 2026 for up to seven AI Gigafactories with up to EUR 10 billion of public money and industry among the intended users. Operators that sell sovereign, plant-adjacent GPU racks to automotive suppliers and machinery makers win this money; the Data Center Colocation Market gives the full operator picture.
Manufacturing Data Center Pricing: What Does One MW Cost a Manufacturer?
A manufacturer spent about USD 4.05 million per MW of IT load in 2025, rising to USD 5.08 million by 2035 as GPU racks take a larger share.
| Year | Manufacturing IT load in use (MW) | Total spend per MW | IT hardware per MW | Colocation and hosting rate (USD per kW-month) |
|---|---|---|---|---|
| 2020 | 4,400 | USD 3.32 million | USD 2.51 million | USD 165 |
| 2025 | 5,200 | USD 4.05 million | USD 2.94 million | USD 180 |
| 2030 | 7,100 | USD 4.89 million | USD 3.37 million | USD 192 |
| 2035 | 9,600 | USD 5.08 million | USD 3.51 million | USD 200 |
Public anchors: Foxconn’s USD 1.4 billion for a 10,000-GPU center works out at USD 140,000 per installed GPU including the building; at DC Market Insights’ conversion of 1.9 kW of IT load per Blackwell-class GPU that is about USD 74 million per MW, more than ten times the conventional rate. Hyundai’s programme with NVIDIA and the Korean government is about USD 3 billion. DC Market Insights uses USD 8.00 million of AI hardware per AI MW-year and USD 2.62 million per conventional MW-year in 2025.
Standards and Regulation for Manufacturing Data Centers
Eight rules and standards shape where a manufacturer puts its USD 21.06 billion of yearly data center spending.
EU Data Act
Applies from 12 September 2025; users of connected industrial machinery may access, use and share the raw data the machines generate.
NIS2 Directive
Brings medium and large makers of medical devices, computers and electronics, machinery and vehicles into EU cybersecurity duties; national transposition was due by 17 October 2024.
Energy Efficiency Directive Article 12
Data centres of at least 500 kW of IT power report energy data to the EU database every year by 15 May; Germany uses 300 kW.
ISA/IEC 62443
The international series for industrial automation and control system security, used to separate plant networks from corporate data halls.
ISO/IEC 27001
Information security management certification that automotive and electronics customers ask of their suppliers’ data centers.
ANSI/TIA-942 and Tier Ratings
Design standards for data center availability used when manufacturers build or lease second sites.
US Critical Manufacturing Sector
The Cybersecurity and Infrastructure Security Agency (CISA) lists Critical Manufacturing among 16 critical infrastructure sectors, covering primary metals, machinery, electrical equipment and transport equipment.
CHIPS and Science Act
Directs USD 39 billion of incentives to semiconductor plants and equipment and USD 11 billion to research, adding fabs whose process control and yield analytics need on-site compute (National Institute of Standards and Technology, NIST).
Manufacturing Data Center Market Segmentation: Which Segment Is Largest?
IT hardware is the largest component at USD 15.30 billion in 2025, electronics and semiconductors the largest industry at USD 5.06 billion, and industrial AI training and inference the fastest workload at 18.88% a year.
By Component
Colocation and hosting services grow fastest among components, at 12.03% a year to USD 9.45 billion, as mid-sized plants rent GPU racks rather than build halls.
| Component | 2025 (USD million) | Share 2025 | 2035 (USD million) | CAGR 2025-2035 |
|---|---|---|---|---|
| IT Hardware | USD 15,302.57 million | 72.7% | USD 33,661.44 million | 8.20% |
| Colocation and Hosting Services | USD 3,032.64 million | 14.4% | USD 9,446.40 million | 12.03% |
| Electrical and Mechanical Infrastructure | USD 2,034.43 million | 9.7% | USD 3,975.60 million | 6.93% |
| Construction and Fit-Out | USD 693.34 million | 3.3% | USD 1,704.76 million | 9.41% |
By Industry
Electronics and semiconductors hold 24.0% of 2025 spending and grow 10.45% a year because Samsung, SK hynix and Foxconn run the largest manufacturer GPU halls; automotive follows at USD 4.21 billion.
| Industry | 2025 (USD million) | Share 2025 | 2035 (USD million) | CAGR 2025-2035 |
|---|---|---|---|---|
| Electronics and Semiconductors | USD 5,055.10 million | 24.0% | USD 13,660.70 million | 10.45% |
| Automotive and Transportation Equipment | USD 4,212.60 million | 20.0% | USD 9,757.64 million | 8.76% |
| Industrial Machinery and Equipment | USD 3,370.08 million | 16.0% | USD 7,562.17 million | 8.42% |
| Chemicals and Materials | USD 2,948.82 million | 14.0% | USD 5,854.58 million | 7.10% |
| Food and Beverage | USD 1,895.67 million | 9.0% | USD 3,903.06 million | 7.49% |
| Other Manufacturing | USD 3,580.71 million | 17.0% | USD 8,050.05 million | 8.44% |
By Workload
ERP and business systems are the largest workload, ahead of engineering simulation and product lifecycle management (PLM), at USD 6.32 billion in 2025, but industrial AI training and inference overtakes them by 2035 at USD 16.45 billion.
| Workload | 2025 (USD million) | Share 2025 | 2035 (USD million) | CAGR 2025-2035 |
|---|---|---|---|---|
| ERP and Business Systems | USD 6,318.89 million | 30.0% | USD 10,245.52 million | 4.95% |
| Engineering Simulation and PLM | USD 3,580.71 million | 17.0% | USD 6,830.35 million | 6.67% |
| Industrial AI Training and Inference | USD 2,917.22 million | 13.8% | USD 16,451.38 million | 18.88% |
| Plant Data and Digital Twins | USD 3,370.08 million | 16.0% | USD 8,781.88 million | 10.05% |
| Backup Recovery and Other Workloads | USD 4,876.08 million | 23.2% | USD 6,479.07 million | 2.88% |
By Deployment Model
Corporate data centers hold 54.0% of 2025 spending; colocation and hosted private cloud grows fastest at 13.40% and becomes the largest model by 2035.
| Deployment Model | 2025 (USD million) | Share 2025 | 2035 (USD million) | CAGR 2025-2035 |
|---|---|---|---|---|
| Corporate Data Centers | USD 11,374.01 million | 54.0% | USD 17,075.87 million | 4.15% |
| Plant Edge and Micro Data Centers | USD 4,001.97 million | 19.0% | USD 11,709.17 million | 11.33% |
| Colocation and Hosted Private Cloud | USD 5,687.00 million | 27.0% | USD 20,003.16 million | 13.40% |
DC Exclusive: Manufacturer AI Factory Tracker, 8 Projects and 171,216 GPUs
This tracker is a DC Market Insights model built from 8 inputs, one per named project: 171,216 GPUs announced by manufacturers and their partners between 2019 and 2026, which DC Market Insights converts into about 325 MW of modelled IT load at 1.9 kW per GPU. 6 of the 8 are halls the manufacturer owns, one is a shared industrial cloud and one is built with a telecom partner. The modelled load equals 13% of the 2,496 MW of manufacturing AI racks DC Market Insights expects in 2035, so the tracker explains the first wave, not the whole forecast. GPU counts are the companies’ own figures; the MW column is a DC Market Insights estimate, not a disclosed number.
| Company | Project | Announced | GPUs | Modelled IT load (MW) | Type |
|---|---|---|---|---|---|
| Hyundai Motor Group | NVIDIA Blackwell AI factory for autonomous driving, smart factories and robotics, Korea | Oct 2025 | 50,000 | 95.0 | Own AI factory |
| Samsung Electronics | Semiconductor AI Megafactory across memory, logic, foundry and packaging | Oct 2025 | 50,000 | 95.0 | Own AI factory |
| SK Group (SK hynix) | AI factory plus Manufacturing AI Cloud at Icheon, later Yongin; phase 1 by late 2027 | Oct 2025 | 50,000 | 95.0 | Own AI factory |
| Foxconn (Hon Hai) | USD 1.4 billion supercomputing center, Taiwan; GPU cloud partner used by TSMC researchers | Nov 2025 | 10,000 | 19.0 | Own AI factory sold as cloud |
| Deutsche Telekom with NVIDIA | Industrial AI Cloud in Munich for BMW, Mercedes-Benz, Maserati and Schaeffler | Feb 2026 | 10,000 | 19.0 | Shared industrial cloud |
| Eli Lilly | LillyPod DGX SuperPOD, Indianapolis, for discovery, clinical development and manufacturing | Feb 2026 | 1,016 | 1.9 | Own AI factory |
| BMW Group | High Performance D3 data platform near Munich, 230 petabytes | Mar 2019 | 200 | 0.4 | Own data center |
| Toyota with NTT | Mobility AI Platform with distributed data centers, JPY 500 billion by 2030 | Oct 2024 | not disclosed | n/a | Partner-built data centers |
Reading the tracker: Korea holds 88% of the GPUs, Europe’s two entries total 10,200 GPUs, and no US manufacturer has yet disclosed a cluster of comparable size, which is one reason North America grows 7.62% a year against Asia Pacific’s 10.29%. Rack-scale AI halls themselves are sized in the AI Data Center Market.
Regional Insights: Which Region Leads the Manufacturing Data Center Market?
Asia Pacific leads with USD 8.00 billion or 38.0% of 2025 spending and is also the fastest region at 10.29% a year; North America follows with USD 6.32 billion.
| Region | 2025 (USD million) | Share 2025 | 2035 (USD million) | CAGR 2025-2035 |
|---|---|---|---|---|
| Asia Pacific | USD 8,003.94 million | 38.0% | USD 21,320.45 million | 10.29% |
| North America | USD 6,318.89 million | 30.0% | USD 13,172.81 million | 7.62% |
| Europe | USD 5,055.12 million | 24.0% | USD 10,245.52 million | 7.32% |
| Latin America | USD 947.83 million | 4.5% | USD 2,195.47 million | 8.76% |
| Middle East and Africa | USD 737.20 million | 3.5% | USD 1,853.95 million | 9.66% |
Asia Pacific
Asia Pacific grows from USD 8.00 billion to USD 21.32 billion. China, Korea, Japan, Taiwan and India hold most of the world’s electronics and battery output, and South Korea’s three 50,000-GPU factories make it one of the region’s fastest large markets at 10.05% a year.
North America
North America reaches USD 13.17 billion by 2035 at 7.62% a year. The latest World Bank figure puts US manufacturing value added at USD 2.50 trillion (2021), and the CHIPS Act’s USD 39 billion of incentives adds fabs that need on-site compute.
Europe
Europe grows 7.32% a year to USD 10.25 billion. The EU’s 19 AI Factories, the Munich industrial cloud and the Data Act raise demand, while EED energy reporting pushes plants toward shared halls instead of new rooms.
Latin America
Latin America grows from USD 947.83 million to USD 2.20 billion. Mexico, with about USD 366 billion of manufacturing value added in 2025, and Brazil, with USD 268 billion (World Bank), carry most of it as automotive and electronics plants near-shore to supply North America.
Middle East and Africa
The Middle East and Africa grows 9.66% a year to USD 1.85 billion, the second-fastest region, as petrochemical, metals and food plants in the Gulf states move control and planning systems into new national data centers.
Country Analysis: Top 12 Countries in the Manufacturing Data Center Market
The United States is the largest country at USD 5.58 billion in 2025 and China second at USD 3.16 billion; India is the fastest large country at 14.46% a year.
| Rank | Country | Region | 2025 (USD million) | Share 2025 | 2035 (USD million) | CAGR 2025-2035 |
|---|---|---|---|---|---|---|
| 1 | United States | North America | USD 5,581.69 million | 26.5% | USD 11,465.23 million | 7.46% |
| 2 | China | Asia Pacific | USD 3,159.45 million | 15.0% | USD 8,050.05 million | 9.80% |
| 3 | Japan | Asia Pacific | USD 1,474.41 million | 7.0% | USD 3,024.87 million | 7.45% |
| 4 | Germany | Europe | USD 1,369.09 million | 6.5% | USD 2,732.14 million | 7.15% |
| 5 | South Korea | Asia Pacific | USD 1,011.02 million | 4.8% | USD 2,634.56 million | 10.05% |
| 6 | Taiwan | Asia Pacific | USD 758.27 million | 3.6% | USD 2,049.10 million | 10.45% |
| 7 | India | Asia Pacific | USD 631.89 million | 3.0% | USD 2,439.41 million | 14.46% |
| 8 | United Kingdom | Europe | USD 484.45 million | 2.3% | USD 975.76 million | 7.25% |
| 9 | France | Europe | USD 463.39 million | 2.2% | USD 926.98 million | 7.18% |
| 10 | Canada | North America | USD 421.26 million | 2.0% | USD 926.98 million | 8.21% |
| 11 | Italy | Europe | USD 421.26 million | 2.0% | USD 829.40 million | 7.01% |
| 12 | Brazil | Latin America | USD 337.01 million | 1.6% | USD 780.61 million | 8.76% |
India’s manufacturing value added of about USD 533 billion in 2025 is now above South Korea’s USD 514 billion (World Bank), yet its manufacturing data center base is less than two-thirds of Korea’s, so DC Market Insights expects India to grow from USD 631.89 million to USD 2.44 billion.
Forecast Scenario Analysis: Manufacturing Data Center Market in 2035
The base case is USD 48.79 billion by 2035; the range runs from USD 41.96 billion to USD 55.13 billion.
| Scenario | 2035 size | CAGR 2025-2035 | Assumption |
|---|---|---|---|
| Low | USD 41.96 billion | 7.13% | Korean AI factories stop at phase 1 and AI rack share reaches 18% instead of 26% |
| Base | USD 48.79 billion | 8.76% | AI share 26%, leased share 41%, 9,600 MW in use by 2035 |
| High | USD 55.13 billion | 10.10% | EU AI Gigafactories and Korea’s M.AX programme double manufacturer GPU halls by 2030 |
Competitive Insights: Key Players in the Manufacturing Data Center Market
The five largest server suppliers to manufacturers hold about 48% of the USD 15.30 billion of IT hardware spending in 2025 (DC Market Insights estimate based on supplier shares of enterprise server shipments), while power, cooling and enclosure work is spread across more suppliers.
- Dell Technologies
- Hewlett Packard Enterprise
- Lenovo
- Inspur
- Super Micro Computer
- NVIDIA
- Schneider Electric
- Vertiv
- Eaton
- ABB
- Rittal
- Siemens
- Equinix
- Digital Realty
- Deutsche Telekom
- NTT DATA
- Foxconn
Vertiv reported 2025 net sales of USD 10.23 billion and a backlog of USD 15.0 billion, up 109%, and guided 2026 sales of USD 13.25 billion to USD 13.75 billion (Vertiv, February 2026). Schneider Electric’s 2025 revenue was EUR 40.15 billion, with strong demand from semiconductor, energy and chemicals customers (Schneider Electric, February 2026). ABB’s 2025 revenue rose 9% to USD 33.22 billion, led by data centers in Electrification (ABB, January 2026), and Rittal’s parent Friedhelm Loh Group earned EUR 3.2 billion. Among operators, Digital Realty’s 2025 annual report names manufacturing among its customer industries across more than 5,000 customers, and Equinix lists smart manufacturing among the workflows that depend on its interconnection across 280 data centers.
Recent Developments in the Manufacturing Data Center Market
Six dated moves from October 2025 to October 2026 shape the USD 23.29 billion market in 2026.
- In October 2026, China said it had built more than 13,000 advanced-level smart factories and reached 2,592 EFLOPS of smart computing power (Source: State Council of China).
- In September 2026, ENISA reported that manufacturing took 25.2% of claimed ransomware deployments in the EU in 2025 (Source: ENISA annual threat report).
- In July 2026, the EU opened its call for up to seven AI Gigafactories with up to EUR 10 billion of public funding (Source: European Commission).
- In June 2026, Korea set a 20 trillion won budget for manufacturing AI transformation to 2030 (Source: Ministry of Science and ICT).
- In February 2026, Deutsche Telekom launched its Munich Industrial AI Cloud with 10,000 NVIDIA GPUs, and Eli Lilly’s 1,016-GPU LillyPod went live (Source: Deutsche Telekom; NVIDIA).
- In October 2025, Samsung, SK Group and Hyundai Motor Group each announced AI factories of about 50,000 NVIDIA GPUs (Source: NVIDIA; Hyundai Motor Group).
Research Methodology: How DC Market Insights Sized the Manufacturing Data Center Market
The model multiplies 5,200 MW of manufacturing IT load in 2025 by spending per MW for each component, giving USD 21.06 billion.
Manufacturing IT load is about 11% of the roughly 46 gigawatts (GW) of enterprise and colocation capacity inside the 116 GW installed worldwide in 2025 (DC Market Insights capacity base). IT hardware = conventional MW x USD 2.62 million + AI MW (312) x USD 8.00 million = USD 15.30 billion. Colocation and hosting = 1,404 leased MW x USD 180 per kW-month x 12 = USD 3.03 billion. Owned sites add USD 2,034.43 million of electrical and mechanical work and USD 693.34 million of construction and fit-out. Industry, workload, deployment-model, region and country splits are DC Market Insights shares; every split sums to the total each year.
Bound checks: (1) the market is 3.7% of the USD 570.04 billion 2025 data center market in DC Market Insights’ global model, below the BFSI vertical’s 5.9% in the BFSI Data Center Market; (2) manufacturing colocation and hosting of USD 3.03 billion is 4.1% of the USD 74.46 billion colocation market in 2025; (3) as a ceiling, USD 21.06 billion is 0.12% of the USD 17.60 trillion of world manufacturing value added in 2025 (World Bank), and as a floor, China’s 13,000 advanced smart factories x USD 0.10 million a year of minimum plant data room upkeep = USD 1.30 billion, below the USD 3.16 billion China estimate. Full method: DC Market Insights research methodology.
Table of contents
- 01Introduction
- 1.1Report Description
- 1.2Key Market Statistics, 2025, 2026, 2030 and 2035
- 02Executive Summary
- 2.1Market Snapshot, 2025, 2026 and 2035
- 2.2Market Size Chart, 2020-2035
- 03Market Scope
- 3.1Included
- 3.2Excluded
- 3.3How the Segments Fit Together
- 04Why Market Estimates Differ
- 4.1Scope Table: In and Out of This Estimate
- 05Market Drivers
- 5.1Korea's 150,000-GPU AI Factories at Samsung, SK and Hyundai
- 5.2Ransomware Makes Manufacturing the Most-Hit Sector in Europe
- 5.3EU Data Act and NIS2 Turn Machine Data Into a Regulated Asset
- 06Market Trends
- 6.1Shared Industrial AI Clouds in Munich and Taipei
- 6.2China's 13,000 Smart Factories and 2,592 EFLOPS of AI Compute
- 6.3Pharmaceutical Plants Get Their Own AI Factories
- 07Market Challenges and Restraints
- 7.1EU Energy Reporting Reaches In-House Halls Above 500 kW
- 7.2Low AI Uptake Outside Electronics
- 08Market Opportunities
- 8.1Plant Edge and Micro Data Centers for Vision Inspection and Digital Twins
- 8.2Hosted GPU Capacity for Mid-Sized Manufacturers
- 09Pricing Analysis
- 9.1Spending per MW, 2020-2035
- 9.2Public Price and Size Anchors
- 10Standards and Regulation
- 10.1EU Data Act
- 10.2NIS2 Directive
- 10.3Energy Efficiency Directive Article 12
- 10.4ISA/IEC 62443
- 10.5ISO/IEC 27001
- 10.6ANSI/TIA-942 and Tier Ratings
- 10.7US Critical Manufacturing Sector
- 10.8CHIPS and Science Act
- 11Market Segmentation
- 11.1By Component
- 11.2IT Hardware
- 11.3Colocation and Hosting Services
- 11.4Electrical and Mechanical Infrastructure
- 11.5Construction and Fit-Out
- 11.6By Industry
- 11.7Electronics and Semiconductors
- 11.8Automotive and Transportation Equipment
- 11.9Industrial Machinery and Equipment
- 11.10Chemicals and Materials
- 11.11Food and Beverage
- 11.12Other Manufacturing
- 11.13By Workload
- 11.14ERP and Business Systems
- 11.15Engineering Simulation and PLM
- 11.16Industrial AI Training and Inference
- 11.17Plant Data and Digital Twins
- 11.18Backup Recovery and Other Workloads
- 11.19By Deployment Model
- 11.20Corporate Data Centers
- 11.21Plant Edge and Micro Data Centers
- 11.22Colocation and Hosted Private Cloud
- 12DC Exclusive: Manufacturer AI Factory Tracker
- 12.1Hyundai Motor Group
- 12.2Samsung Electronics
- 12.3SK Group (SK hynix)
- 12.4Foxconn (Hon Hai)
- 12.5Deutsche Telekom with NVIDIA
- 12.6Eli Lilly
- 12.7BMW Group
- 12.8Toyota with NTT
- 13Regional Insights
- 13.1Asia Pacific
- 13.2North America
- 13.3Europe
- 13.4Latin America
- 13.5Middle East and Africa
- 14Country Analysis
- 14.1United States
- 14.2China
- 14.3Japan
- 14.4Germany
- 14.5South Korea
- 14.6Taiwan
- 14.7India
- 14.8United Kingdom
- 14.9France
- 14.10Canada
- 14.11Italy
- 14.12Brazil
- 15Forecast Scenarios, 2035
- 15.1Low Scenario
- 15.2Base Scenario
- 15.3High Scenario
- 16Competitive Insights
- 16.1Dell Technologies
- 16.2Hewlett Packard Enterprise
- 16.3Lenovo
- 16.4Inspur
- 16.5Super Micro Computer
- 16.6NVIDIA
- 16.7Schneider Electric
- 16.8Vertiv
- 16.9Eaton
- 16.10ABB
- 16.11Rittal
- 16.12Siemens
- 16.13Equinix
- 16.14Digital Realty
- 16.15Deutsche Telekom
- 16.16NTT DATA
- 16.17Foxconn
- 16.18Server Supplier Concentration, 2025
- 17Recent Developments
- 17.1China Smart Factories and Computing Power, October 2026
- 17.2ENISA Manufacturing Ransomware Share, September 2026
- 17.3EU AI Gigafactories Call, July 2026
- 17.4Korea M.AX 20 Trillion Won Plan, June 2026
- 17.5Munich Industrial AI Cloud and LillyPod, February 2026
- 17.6Korean 50,000-GPU AI Factories, October 2025
- 18Research Methodology
- 18.1Model Inputs
- 18.2Bound Checks
- Fig. 1Manufacturing Data Center Market Size, 2020-2035 (USD million)
- Table 1Market Snapshot, 2025, 2026 and 2035
- Table 2Scope Table: In and Out of This Estimate
- Table 3Spending per MW, 2020-2035
- Table 4Market by Component, 2025 and 2035
- Table 5Market by Industry, 2025 and 2035
- Table 6Market by Workload, 2025 and 2035
- Table 7Market by Deployment Model, 2025 and 2035
- Table 8Manufacturer AI Factory Tracker, 2019-2026
- Table 9Market by Region, 2025 and 2035
- Table 10Top 12 Countries, 2025 and 2035
- Table 112035 Forecast Scenarios
About this report
Written by Amit Jain and reviewed by Deepti Agrawal, Senior Editor, Research. Figures are built top-down and bottom-up and reconciled before publication, with 2025 as the base year.
Read our methodologyHow we built this
- Historical period2020-2024
- Base year2025
- Forecast period2026-2035
- Sizing approachTop-down + bottom-up
Need more than the report?
Advisory on this market
Due diligence, site selection and market entry work, by the analysts who wrote this report.
See consulting servicesFrequently asked questions
USD 23.29 billion in 2026, up 10.59% from USD 21.06 billion in 2025, according to DC Market Insights estimates. The market is projected to reach USD 48.79 billion by 2035, a CAGR of 8.76% from 2025.
8.76% a year from 2025 to 2035, after 7.56% a year from 2020 to 2025, as manufacturing IT load in use rises from 5,200 MW to 9,600 MW and the AI rack share climbs from 6% to 26%.
Samsung Electronics, SK Group and Hyundai Motor Group each announced about 50,000 NVIDIA GPUs in October 2025; Foxconn is building a 10,000-GPU center and Eli Lilly runs a 1,016-GPU cluster. DC Market Insights tracks 171,216 GPUs across 8 projects.
Ransomware and machine-data rules: manufacturing drew 25.2% of claimed ransomware deployments in the EU in 2025 (ENISA), and the EU Data Act applies from 12 September 2025. Corporate sites still hold 54.0% of 2025 spending.
A sealed rack-scale room on the factory floor that runs vision inspection, robot control and digital twins next to the line. Plant edge and micro data centers grow 11.33% a year to USD 11.71 billion by 2035.
Industrial AI training and inference grows fastest at 18.88% a year to USD 16.45 billion by 2035; among deployment models, colocation and hosted private cloud leads at 13.40%.
Electronics and semiconductors, with USD 5.06 billion or 24.0% of 2025 spending, growing 10.45% a year; automotive and transportation equipment follows at USD 4.21 billion.
Asia Pacific, with USD 8.00 billion or 38.0% of 2025 value, and it is also the fastest region at 10.29% a year. The United States is the largest country at USD 5.58 billion; India grows fastest at 14.46%.
Dell Technologies, Hewlett Packard Enterprise and Lenovo lead servers, holding with two others about 48% of 2025 IT hardware spending (DC Market Insights estimate); Schneider Electric, Vertiv, Eaton, ABB and Rittal lead power, cooling and enclosures.
USD 23.29 billion in 2026 counts only data center capacity manufacturers own or lease. Estimates that add public cloud fees, MES and ERP software, shop-floor OT equipment or electricity come out larger.
Licences, delivery and payment
Which licence should I choose?
Single User is a view-only PDF for one person. Multi User adds a printable PDF and the Excel data for unlimited users at one location. Enterprise covers your whole company and includes 100 free analyst hours.
How and when will I receive the report?
By email, within 24–48 business hours of payment, in the formats of your licence.
How can I pay?
Securely through PayPal: with a PayPal account, a debit or credit card, or PayPal Pay Later where available. Prices are in US dollars.
Can I see a sample first?
Yes. Request a free sample and we will email it to you.
Can the report be tailored to my needs?
Yes. We can add countries, segments or data cuts. Talk to an analyst about the scope you need.
Can I get an invoice or pay against a purchase order?
Write to sales@dcmarketinsights.com and our team will help.