
Data Center Cold Plate Market Size, Share & Forecast to 2035
Market at a glance
The Data Center Cold Plate market was worth USD 1,160.0 million in 2025 and is forecast to reach USD 5,770.0 million by 2035, growing at a 17.35% CAGR.
 By Amit Jain, Senior Consultant, ICT & Emerging Technologies
 Reviewed by Deepti Agrawal
Last updated 29 Oct 2026
Base year 2025 PDF + Excel
Key findings
Accelerator Power Climbs from 700 W to 1,400 W and Toward 2,000 W
Jet Impingement and Split-Flow Plates Take Share from Plain Skived Fins
Copper at USD 14,850 per Tonne and a 50% United States Copper Tariff
Memory, VRM and Switch Plates: USD 116.45 million to USD 1.10 billion
What is inside the report
- 01Introduction
- 02Executive Summary
- 03Market Scope
- 04Why Market Estimates Differ
- 05Market Drivers
- 06Market Trends
- 07Market Challenges
- 08Market Opportunities
- 09Pricing Analysis
- 10Standards and Regulation
- 18chapters
- 2020-2024Historical period
- 2026-2035Forecast period
- 17Companies profiled
Segmentation
Companies profiled
- Asia Vital Components (AVC)
- Auras Technology
- Cooler Master
- Boyd Thermal (Eaton)
- CoolIT Systems (Ecolab)
- Delta Electronics
- Jentech Precision
- Motivair (Schneider Electric)
- JetCool Technologies (Flex)
- Accelsius
- ZutaCore
- Nidec
- Chilldyne (Daikin Applied)
- Alloy Enterprises
- Corintis
- Frore Systems
- Vertiv (cold plate design and integration)
Recent developments
Eaton completed its purchase of Boyd Thermal for USD 9.55 billion net of cash (Source: Eaton).
NVIDIA named four approved Vera Rubin cold plate suppliers at GTC 2026, reported as AVC, Cooler Master, Delta and Jentech (Source: TVBS News).
Vertiv acquired Strategic Thermal Labs, a cold plate design and thermal validation firm (Source: Vertiv).
AVC broke ground on a USD 600 million plant in Vietnam for liquid cooling equipment and water cooling plates (Source: TechNode Global).
Ecolab completed its USD 4.75 billion purchase of CoolIT Systems (Source: Ecolab).
Full analysis
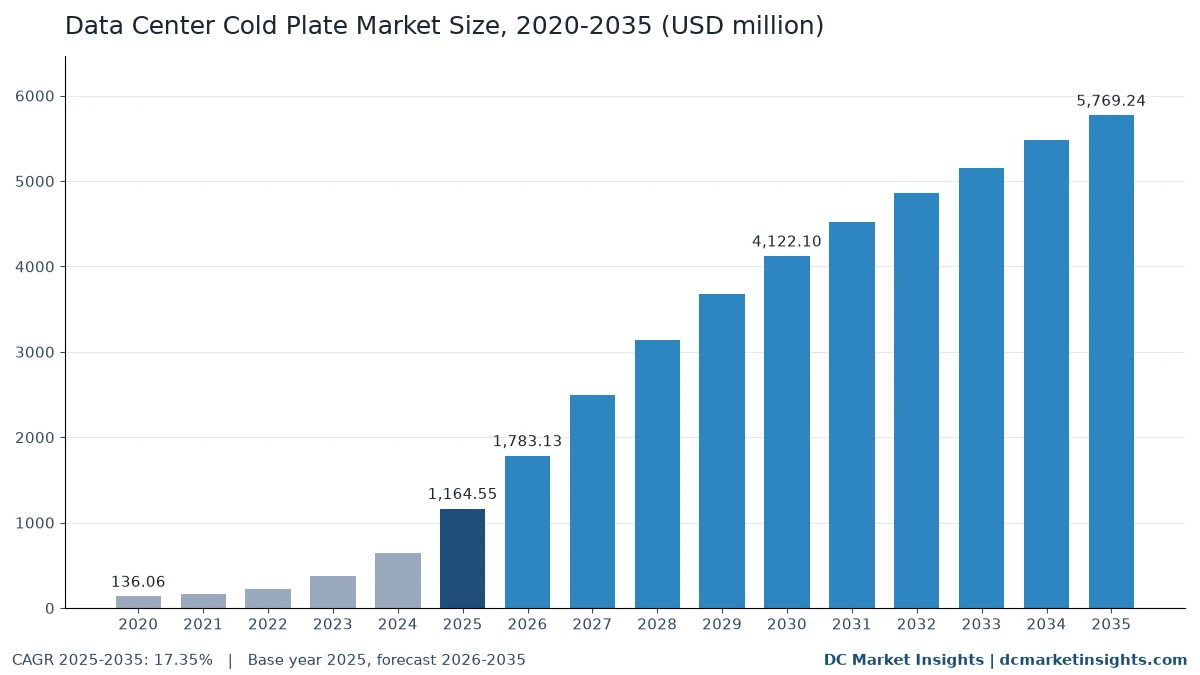
The Data Center Cold Plate Market is valued at USD 1.78 billion in 2026 and is projected to reach USD 5.77 billion by 2035, up from USD 1.16 billion in 2025, a CAGR of 17.35% from 2025 to 2035 (DC Market Insights estimate). The money moves with chip power: AMD rates its Instinct MI355X at 1,400 W of total board power and NVIDIA builds its GB300 NVL72 rack as fully liquid-cooled, so every accelerator in these racks carries a cold plate. Each kilowatt of liquid-cooled IT capacity built in 2025 carried about USD 261 of cold plates, and the 4,150 MW of new liquid-cooled capacity that year accounts for most of the 2025 value. Supply is concentrating around chip vendors’ approved lists: NVIDIA named four cold plate suppliers for Vera Rubin in March 2026, all of them Taiwanese. Two-phase cold plates are the fastest type at 30.34% a year, and Middle East and Africa is the fastest region at 20.37% a year as Gulf AI campuses are designed for direct-to-chip cooling from the start.
Key Market Statistics: How Much Is Spent on Data Center Cold Plates in 2026?
DC Market Insights values the Data Center Cold Plate Market at USD 1.78 billion in 2026, 53.12% above the USD 1.16 billion of 2025, as Blackwell Ultra and Vera Rubin racks that are liquid-cooled at the tray level replace air-cooled Hopper servers.
- Market size 2025: USD 1.16 billion; 2026: USD 1.78 billion; 2030: USD 4.12 billion; 2035: USD 5.77 billion.
- CAGR 2025-2035: 17.35% in the base case (28.76% to 2030, then 6.95% to 2035); the 2035 range runs from USD 4.66 billion (low, 14.88%) to USD 6.78 billion (high, 19.27%).
- Largest type: single-phase cold plates, USD 1,123.79 million or 96.5% of 2025 spend; fastest type: two-phase, 30.34% a year.
- Largest chip cooled: GPU and accelerators, USD 791.89 million in 2025; memory plates grow fastest at 27.27% a year.
- Leading region: North America, USD 521.72 million (44.8%) in 2025; fastest region: Middle East and Africa, 20.37% a year.
- Largest country: United States, USD 465.37 million in 2025; fastest large country: India, 23.36% a year.
- Market leaders: AVC, Auras, Cooler Master, Boyd Thermal (Eaton) and CoolIT Systems hold about 45% of 2025 value (DC Market Insights estimate).
How Has Cold Plate Spending Grown Since 2020?
The Global Data Center Cold Plate Market size was valued at USD 136.06 million in 2020, reached USD 1.16 billion in 2025, and is anticipated to reach USD 5.77 billion by 2035, at a CAGR of 17.35% during the forecast period.
| Attribute | Details |
|---|---|
| Historical period | 2020-2024 |
| Base year | 2025 |
| Forecast period | 2026-2035 |
| Market size 2025 | USD 1.16 billion |
| Market size 2026 | USD 1.78 billion |
| Market size 2030 | USD 4.12 billion |
| CAGR 2025-2035 | 17.35% |
| Market size 2035 | USD 5.77 billion |
Spending rose 8.56 times between 2020 and 2025, 53.63% a year, because cold plates moved from a niche in high-performance computing (HPC) clusters to the default for artificial intelligence (AI) accelerators: NVIDIA’s H200 graphics processing unit (GPU) in SXM form runs at up to 700 W, and the rack-scale GB200 NVL72 that followed was built around liquid cooling. The steepest part of the curve is now: the market adds USD 618.58 million in 2026 alone. Growth then cools to 6.95% a year between 2030 and 2035 as new liquid-cooled capacity levels off near 20,400 MW a year and content per kW stops rising, so the market reaches USD 5.77 billion in 2035.
What Counts as a Data Center Cold Plate?
The market covers USD 1.16 billion of liquid cold plates bought in 2025 for direct-to-chip cooling of data center servers, valued at the price paid by the server maker or the operator.
Included
- The cold plate itself: the metal heat exchanger mounted on a chip lid or die, with internal channels for the coolant, its retention bracket and any connectors supplied with it.
- Single-phase cold plates (water or water-glycol that does not boil) and two-phase cold plates (a dielectric refrigerant that boils inside the plate, also called an evaporator).
- All designs: microchannel and skived fin, jet impingement, and other designs such as pin fin, additively made and microfluidic plates.
- Plates on GPUs and accelerators, central processing units (CPUs), memory, and voltage regulator modules (VRMs), switches and other tray parts.
Excluded
- The rest of the liquid loop: in-rack and row manifolds, hoses, quick disconnects and fittings, coolant distribution units (CDUs), immersion tanks, rear-door heat exchangers and coolants.
- Air-cooling heat sinks, vapour chambers and heat pipes used without liquid, and cold plates in consumer PCs and workstations.
- Installation, commissioning and maintenance services.
How the Cold Plate Segments Add Up
Each of the five segment views (type, design, material, chip cooled and data center type) sums to USD 1.16 billion in 2025, USD 4.12 billion in 2030 and USD 5.77 billion in 2035. Regions and the top 12 countries are cut from the same total, and the total itself is a slice of the Data Center Liquid Cooling Market, so the two reports never count the same dollar twice.
Why Do Cold Plate Market Estimates Differ?
DC Market Insights puts the 2026 market at USD 1.78 billion because it counts the plate alone; counting the hardware around the plate gives USD 2.01 billion for 2025, 1.72 times the plate value, and the whole direct-to-chip loop with manifolds, hoses and CDUs gives USD 3.59 billion, 3.08 times (DC Market Insights values).
In the Data Center Liquid Cooling Market report, cold plates sit inside a component called “Cold Plates and In-Rack Hardware”, worth USD 2,007.85 million in 2025 and USD 9.01 billion in 2035. Cold plates are USD 1,164.55 million of that in 2025 (58.0%) and USD 5.77 billion in 2035 (64.0%). The remaining USD 843.30 million in 2025 and USD 3.25 billion in 2035 is in-rack manifolds, which the Data Center Liquid Cooling Manifolds Market report sizes at USD 461.26 million and USD 1.73 billion within its wider total of USD 935.61 million in 2025, plus hoses, quick disconnects, fittings, brackets and tray sensors.
| Element | In this estimate | 2025 (USD million) | 2035 (USD million) |
|---|---|---|---|
| Cold plates | Yes | USD 1,164.55 million | USD 5,769.24 million |
| In-rack manifolds | No, sized in the Manifolds report | USD 461.26 million | USD 1,730.64 million |
| Hoses, quick disconnects, fittings, brackets, tray sensors | No | USD 382.04 million | USD 1,514.55 million |
| Cold Plates and In-Rack Hardware (13048 component) | Parent view | USD 2,007.85 million | USD 9,014.43 million |
Why the cold plate share rises from 58.0% to 64.0%: more parts on each tray get a plate (memory, VRMs, network interface cards and switches), two-phase and jet impingement plates cost more per kW than a plain skived-fin plate, and manifold content per MW falls 3.6% a year as manifolds standardise. Outside this estimate, in prose too: CDUs, pumps, in-row and in-rack manifolds, quick disconnect couplings, hoses, immersion tanks, rear-door heat exchangers, coolants, heat sinks and vapour chambers, and installation services. In scope are all buyer groups: hyperscale operators, colocation providers, GPU and neocloud operators, HPC and research centres, and enterprise sites, including small and medium enterprises (SMEs) that buy liquid-cooled servers from original equipment makers.
Market Drivers: Why Are Cold Plate Orders Rising So Fast?
Three drivers take the market from USD 1.16 billion in 2025 to USD 4.12 billion in 2030: accelerator power that air cannot remove, trays where every chip is liquid-cooled, and thermal majors buying cold plate capacity.
Accelerator Power Climbs from 700 W to 1,400 W and Toward 2,000 W
NVIDIA lists up to 700 W for the H200 in SXM form, AMD’s MI355X reached 1,400 W of total board power in June 2025, and Taiwanese press reported 1,800 to 2,300 W per chip for Vera Rubin in April 2026. An Open Compute Project (OCP) white paper from February 2025 notes that accelerator thermal design power (TDP) grew about 2.5 times between 2020 and 2024 and calls 2,000 W by 2030 “not unlikely”. DC Market Insights therefore keeps GPU and accelerator plates at 68.0% of 2025 spend, growing from USD 791.89 million to USD 2.72 billion in 2030.
Fully Liquid-Cooled Trays Put Plates on Memory, VRMs and Switches
NVIDIA describes the GB300 NVL72 as a fully liquid-cooled rack-scale design, and in October 2025 it said the Vera Rubin NVL72 compute tray is 100% liquid-cooled with 45°C coolant. Supermicro’s DLC-2 stack, launched in May 2025, already carries cold plates for CPUs, GPUs, memory, PCIe switches and voltage regulators. Each step adds plates per tray: memory plates grow 27.27% a year and VRM and other plates 23.50% a year, against 16.64% for GPU plates.
Eaton and Ecolab Pay USD 14.3 Billion for Two Cold Plate Makers
Eaton closed its purchase of Boyd Thermal on 12 March 2026 for USD 9.55 billion net of cash, and Boyd had forecast USD 1.7 billion of 2026 sales, USD 1.5 billion of it in liquid cooling. Ecolab closed its USD 4.75 billion purchase of CoolIT Systems on 2 July 2026 and said in its March 2026 filing that CoolIT was expected to generate about USD 550 million of sales over the next 12 months. Buyers with this scale fund new skiving and brazing lines, which supports the 2026 jump of 53.12%.
Market Trends: Which Cold Plate Designs Are Gaining?
Three shifts reshape the USD 1.78 billion market of 2026: targeted-flow plates, two-phase plates leaving the lab, and cooling that moves into the chip package.
Jet Impingement and Split-Flow Plates Take Share from Plain Skived Fins
JetCool, part of Flex since November 2024, aims arrays of microjets at the hottest areas of a processor and sells its sealed SmartPlate system on Dell PowerEdge servers. CoolIT showed a 15 kW single-phase Split-Flow microchannel cold plate design in June 2026, almost four times its 4,000 W plate of March 2025. DC Market Insights expects jet impingement to rise from 9.0% of spend in 2025 to 18.0% in 2035, from USD 104.81 million to USD 1.04 billion, while microchannel and skived fin plates fall from 78.0% to 66.0%.
Two-Phase Cold Plates Move from Test Rigs to Funded Products
Accelsius reported cooling a 4,500 W GPU socket test vehicle and a 250 kW rack with two-phase plates in April 2025, ZutaCore raised a USD 100 million Series C in June 2026 for waterless two-phase cooling, and OCP issued Revision 1.1 of its guidelines for dielectric fluids in two-phase cold plate racks in March 2026. Two-phase plates grow from USD 40.76 million (3.5%) in 2025 to USD 576.92 million (10.0%) in 2035, 30.34% a year.
Microfluidic and Co-Packaged Cooling Moves Closer to the Silicon
Microsoft tested microfluidic channels etched into the back of a chip, designed with the Swiss firm Corintis, that removed heat up to three times better than cold plates in September 2025; Corintis raised USD 24 million the same month and says it has shipped over 10,000 cooling systems. Jentech is co-developing a microchannel lid with NVIDIA. These sit in other designs, which grow from USD 151.39 million to USD 923.08 million; DC Market Insights treats in-chip cooling as a risk to plate value after 2032 rather than a base-case substitute.
Market Challenges: What Could Slow Cold Plate Demand?
Two challenges sit behind the low case of USD 4.66 billion in 2035, 2.47 points a year below the base case: record copper costs and unsettled rules for two-phase fluids.
Copper at USD 14,850 per Tonne and a 50% United States Copper Tariff
Copper holds 86.0% of cold plate value. Chile’s state copper commission, Cochilco, recorded London Metal Exchange (LME) cash copper at a record USD 14,850 per tonne on 17 August 2026, and the United States Geological Survey (USGS) put the 2025 COMEX average at a record USD 4.80 per pound, 14% above 2024. Since 1 August 2025 the United States has applied a 50% tariff on semi-finished copper products and intensive copper derivatives. Plates for the American market are mostly made in Taiwan, China, Vietnam and Mexico, so buyers there pay the duty on copper-heavy parts; aluminium plates gain from 9.0% to 11.0% of spend partly for this reason.
PFAS and F-gas Rules Cloud the Two-Phase Fluid Choice
3M said in December 2022 that it would exit all per- and polyfluoroalkyl substances (PFAS) manufacturing, including fluorinated fluids, by the end of 2025, and the European Chemicals Agency (ECHA) published an updated universal PFAS restriction proposal on 20 August 2025 whose outcome is still open. The EU F-gas Regulation (EU) 2024/573, in force since 11 March 2024, phases out hydrofluorocarbons (HFCs) by 2050. Two-phase plates depend on such refrigerants, R-515B in the OCP demonstration, so the low case caps two-phase at 7% of 2035 spend instead of 10.0%.
Market Opportunities: Where Will New Cold Plate Revenue Come From?
Two pools add USD 1,515.86 million between 2025 and 2035: plates beyond the GPU and two-phase plates for chips above 2 kW.
Memory, VRM and Switch Plates: USD 116.45 million to USD 1.10 billion
Accelsius fitted plates to the switches, CPUs and GPUs of a retrofitted H100 server, and Supermicro’s DLC-2 covers memory and voltage regulators. Memory, VRM and other plates together grow from USD 116.45 million in 2025 to USD 1.10 billion in 2035, and their share of spend doubles from 10.0% to 19.0%. Makers that can supply a matched set of plates for one tray win the server maker’s whole bill of materials.
Two-Phase Plates for the Next Chip Generations: USD 40.76 million to USD 576.92 million
Hyperscalers told OCP EMEA in May 2025 that AI racks could pass 500 kW before 2030, and NVIDIA plans 800 V direct current power for racks of over 1 MW. Two-phase plates remove more heat per litre of flow, so DC Market Insights adds USD 227.18 million of two-phase spend by 2030 and a further USD 308.98 million by 2035, mostly in GPU and neocloud and hyperscale halls.
Pricing: What Do Cold Plates Cost per kW of IT Capacity?
Cold plates cost about USD 261 per kW of new liquid-cooled IT capacity in 2025, down from USD 323 in 2020, and settle near USD 252 by 2035 (DC Market Insights estimates).
| Year | New liquid-cooled IT capacity (MW) | Cold plate market (USD million) | New-build share | New-build cold plate spend (USD million) | Content per kW |
|---|---|---|---|---|---|
| 2020 | 400 | USD 136.06 million | 95% | USD 129.26 million | USD 323 |
| 2025 | 4,150 | USD 1,164.55 million | 93% | USD 1,083.03 million | USD 261 |
| 2030 | 15,250 | USD 4,122.10 million | 91% | USD 3,751.11 million | USD 246 |
| 2035 | 20,400 | USD 5,769.24 million | 89% | USD 5,134.62 million | USD 252 |
Content per kW fell from 2020 to 2025 as plates went from hand-built HPC parts to volume parts made in Taiwan and China, and as rack density rose faster than plate count. It dips to USD 246 in 2030 and rises a little to USD 252 in 2035, because two-phase and jet impingement plates and plates on memory and VRMs add value per kW. The 2020 and 2030 capacity figures are DC Market Insights estimates from the Manifolds model. Public cost anchors: the USGS COMEX copper average of USD 4.80 per pound in 2025, LME copper at USD 13,310 per tonne on 14 January 2026 and USD 14,850 on 17 August 2026, and the 50% United States copper tariff. No public list prices for data center cold plates exist; prices are set in supply contracts with server makers.
Standards and Regulation: Which Specifications Govern Cold Plates?
Eight specifications and rules shape the USD 1.78 billion market of 2026, most of them industry guidance rather than law.
- OCP Cold Plate Development and Qualification (October 2022): shock, vibration, thermal cycling and corrosion tests on samples from the production line, and a 0.15 V limit on galvanic potential between wetted metals (OCP white paper).
- OCP Single-Phase Direct-to-Chip Cold Plate Test Specification 1.0.0, effective 3 September 2026: vendor-neutral tests for leakage and pressure, thermal and flow, mechanical strength, reliability and cleanliness.
- OCP guidelines for dielectric heat transfer fluids in two-phase cold plate racks, Revision 1.1 (March 2026): low toxicity, non-flammable fluids with low global warming potential.
- American Society of Heating, Refrigerating and Air-Conditioning Engineers (ASHRAE) TC 9.9 facility water classes W17 to W+ (2021) and S-classes of 30°C to 50°C for coolant entering IT equipment (September 2024).
- ASHRAE TC 9.9 bulletin on technology cooling system (TCS) coolant integrity and readiness (May 2026), which warns that “it is too easy to violate” direct-to-chip warranty requirements (ASHRAE bulletin).
- EU F-gas Regulation (EU) 2024/573, applying from 11 March 2024 to refrigerants in two-phase loops.
- EU universal PFAS restriction proposal under REACH (Registration, Evaluation, Authorisation and Restriction of Chemicals), updated August 2025.
- United States Section 232 copper proclamation (July 2025): 50% duty on semi-finished copper products from 1 August 2025.
Market Segmentation: Which Cold Plate Segments Lead in 2030?
Single-phase plates lead by type with USD 3.85 billion in 2030, microchannel and skived fin plates by design with USD 2.97 billion, copper by material with USD 3.46 billion, GPU and accelerator plates by chip with USD 2.72 billion, and hyperscale data centers by buyer with USD 2.14 billion.
By Type
Single-phase plates hold 96.5% of 2025 spend because water-glycol loops are the installed base, but two-phase plates reach 6.5% by 2030 and 10.0% by 2035.
| Type | 2025 (USD million) | Share 2025 | 2030 (USD million) | Share 2030 | 2035 (USD million) | CAGR 2025-2035 |
|---|---|---|---|---|---|---|
| Single-Phase Cold Plates | USD 1,123.79 million | 96.5% | USD 3,854.16 million | 93.5% | USD 5,192.32 million | 16.54% |
| Two-Phase Cold Plates | USD 40.76 million | 3.5% | USD 267.94 million | 6.5% | USD 576.92 million | 30.34% |
By Design
Microchannel and skived fin plates are 78.0% of 2025 spend; jet impingement grows fastest at 25.78% a year, reaching USD 556.48 million in 2030.
| Design | 2025 (USD million) | Share 2025 | 2030 (USD million) | Share 2030 | 2035 (USD million) | CAGR 2025-2035 |
|---|---|---|---|---|---|---|
| Microchannel and Skived Fin | USD 908.35 million | 78.0% | USD 2,967.91 million | 72.0% | USD 3,807.70 million | 15.41% |
| Jet Impingement | USD 104.81 million | 9.0% | USD 556.48 million | 13.5% | USD 1,038.46 million | 25.78% |
| Other Designs | USD 151.39 million | 13.0% | USD 597.70 million | 14.5% | USD 923.08 million | 19.82% |
By Material
Copper keeps 84.0% of 2030 spend for its conductivity; aluminium and other materials, such as copper-clad, additively made and silicon parts, rise to 18.0% by 2035.
| Material | 2025 (USD million) | Share 2025 | 2030 (USD million) | Share 2030 | 2035 (USD million) | CAGR 2025-2035 |
|---|---|---|---|---|---|---|
| Copper | USD 1,001.51 million | 86.0% | USD 3,462.56 million | 84.0% | USD 4,730.78 million | 16.80% |
| Aluminium | USD 104.81 million | 9.0% | USD 412.21 million | 10.0% | USD 634.62 million | 19.73% |
| Other Materials | USD 58.23 million | 5.0% | USD 247.33 million | 6.0% | USD 403.85 million | 21.37% |
By Chip Cooled
GPU and accelerator plates take 68.0% of 2025 spend; CPU plates fall from 22.0% to 17.0% as each tray adds GPUs faster than CPUs.
| Chip cooled | 2025 (USD million) | Share 2025 | 2030 (USD million) | Share 2030 | 2035 (USD million) | CAGR 2025-2035 |
|---|---|---|---|---|---|---|
| GPU and Accelerators | USD 791.89 million | 68.0% | USD 2,720.59 million | 66.0% | USD 3,692.31 million | 16.64% |
| CPU | USD 256.20 million | 22.0% | USD 803.81 million | 19.5% | USD 980.77 million | 14.37% |
| Memory | USD 46.58 million | 4.0% | USD 267.94 million | 6.5% | USD 519.23 million | 27.27% |
| VRM and Other | USD 69.87 million | 6.0% | USD 329.77 million | 8.0% | USD 576.92 million | 23.50% |
By Data Center Type
Hyperscale data centers buy USD 617.21 million or 53.0% of 2025 plates; colocation grows 20.00% a year as tenants bring liquid-cooled racks, while HPC and research falls to 6.0% of spend.
| Data center type | 2025 (USD million) | Share 2025 | 2030 (USD million) | Share 2030 | 2035 (USD million) | CAGR 2025-2035 |
|---|---|---|---|---|---|---|
| Hyperscale Data Centers | USD 617.21 million | 53.0% | USD 2,143.49 million | 52.0% | USD 2,942.31 million | 16.90% |
| Colocation Data Centers | USD 186.33 million | 16.0% | USD 741.98 million | 18.0% | USD 1,153.85 million | 20.00% |
| GPU and Neocloud Data Centers | USD 192.15 million | 16.5% | USD 700.76 million | 17.0% | USD 980.77 million | 17.70% |
| HPC and Research Data Centers | USD 114.13 million | 9.8% | USD 321.52 million | 7.8% | USD 346.15 million | 11.73% |
| Enterprise Data Centers | USD 54.73 million | 4.7% | USD 214.35 million | 5.2% | USD 346.15 million | 20.25% |
Liquid Loop Bill of Materials: Where the Cold Plate Dollar Sits, 2025 and 2035
This DC Market Insights model, built on 9 inputs from the Liquid Cooling and Manifolds reports, splits the USD 5.80 billion liquid cooling bill of 2025 into seven parts: cold plates are 20.1% of it in 2025 and 21.1% in 2035.
| Part of the liquid loop | 2025 (USD million) | Share 2025 | 2035 (USD million) | Share 2035 | CAGR 2025-2035 |
|---|---|---|---|---|---|
| Cold plates (this market) | USD 1,164.55 million | 20.1% | USD 5,769.24 million | 21.1% | 17.35% |
| In-rack manifolds (Liquid Cooling Manifolds Market, 12351) | USD 461.26 million | 7.9% | USD 1,730.64 million | 6.3% | 14.14% |
| Hoses, quick disconnects, fittings, brackets and tray sensors | USD 382.04 million | 6.6% | USD 1,514.55 million | 5.5% | 14.77% |
| Coolant distribution units (CDUs) | USD 1,584.22 million | 27.3% | USD 7,233.46 million | 26.4% | 16.40% |
| Heat exchangers and tanks | USD 998.12 million | 17.2% | USD 3,370.13 million | 12.3% | 12.94% |
| Coolants and fluids | USD 336.57 million | 5.8% | USD 1,835.76 million | 6.7% | 18.49% |
| Services | USD 876.25 million | 15.1% | USD 5,945.68 million | 21.7% | 21.10% |
| Total liquid cooling (Data Center Liquid Cooling Market, 13048) | USD 5,803.01 million | 100.0% | USD 27,399.46 million | 100.0% | 16.79% |
Two readings matter. First, the plate is the single largest piece of hardware inside the server, worth more than in-rack manifolds, hoses and quick disconnects together in both years. Second, CDUs stay larger than cold plates, USD 1.58 billion in the Liquid Cooling model against USD 1.16 billion in 2025, because one CDU serves many racks (the CDU report counts a narrower scope at USD 1.46 billion); the Data Center Coolant Distribution Units Market and the Data Center Cooling CDU Pumps Market reports size that side of the loop.
Regional Insights: Which Region Buys the Most Cold Plates?
North America leads with USD 521.72 million or 44.8% of 2025 spend, and Middle East and Africa grows fastest at 20.37% a year, to USD 334.62 million in 2035.
| Region | 2025 (USD million) | Share 2025 | 2030 (USD million) | 2035 (USD million) | Share 2035 | CAGR 2025-2035 |
|---|---|---|---|---|---|---|
| North America | USD 521.72 million | 44.8% | USD 1,760.13 million | USD 2,342.31 million | 40.6% | 16.20% |
| Asia Pacific | USD 315.59 million | 27.1% | USD 1,185.11 million | USD 1,753.85 million | 30.4% | 18.71% |
| Europe | USD 223.59 million | 19.2% | USD 764.65 million | USD 1,032.69 million | 17.9% | 16.53% |
| Latin America | USD 51.24 million | 4.4% | USD 199.92 million | USD 305.77 million | 5.3% | 19.56% |
| Middle East and Africa | USD 52.41 million | 4.5% | USD 212.29 million | USD 334.62 million | 5.8% | 20.37% |
North America
North America spends USD 521.72 million in 2025 and USD 2.34 billion in 2035, 16.20% a year. Supply is moving closer to the buyer: Boyd is more than doubling its thermal campus in Juarez, Mexico, which makes CDUs and direct-to-chip cold plates, to about 460,000 square feet, and Accelsius makes two-phase heat transfer parts in a new facility in Austin, Texas.
Asia Pacific
Asia Pacific spends USD 315.59 million in 2025 and USD 1.75 billion in 2035, 18.71% a year, and is where most plates are made. AVC broke ground on a USD 600 million plant in Vietnam for liquid cooling equipment and water cooling plates in May 2026, and Delta said its installed liquid cooling base passed 3 GW the same month.
Europe
Europe spends USD 223.59 million in 2025 and USD 1.03 billion in 2035, 16.53% a year. The F-gas Regulation and the PFAS proposal weigh on two-phase plates here more than elsewhere.
Latin America
Latin America spends USD 51.24 million in 2025 and USD 305.77 million in 2035, 19.56% a year, led by Brazil with USD 24.24 million in 2025. Ascenty began building its Sumare 3 site in Brazil in March 2026, starting at 90 MW with room for another 90 MW and designed for direct-to-chip liquid cooling, with delivery slated for Q3 2027 (as announced, May 2026).
Middle East and Africa
Middle East and Africa is the fastest region, from USD 52.41 million in 2025 to USD 334.62 million in 2035, 20.37% a year, as Gulf AI campuses are designed for liquid from the start. Saudi AI developer HUMAIN issued an engineering, procurement and construction tender in October 2026 for a 100 MW AI data center in Riyadh whose high-density racks will use direct-to-chip liquid cooling loops with CDUs (MEED, October 2026).
Country Analysis: Which Countries Spend the Most on Cold Plates?
The United States leads with USD 465.37 million in 2025, 40.0% of global spend, and India is the fastest large country at 23.36% a year.
| Rank | Country | Region | 2025 (USD million) | 2030 (USD million) | 2035 (USD million) | CAGR 2025-2035 |
|---|---|---|---|---|---|---|
| 1 | United States | North America | USD 465.37 million | USD 1,560.36 million | USD 2,063.58 million | 16.06% |
| 2 | China | Asia Pacific | USD 124.66 million | USD 442.64 million | USD 617.36 million | 17.35% |
| 3 | Canada | North America | USD 56.35 million | USD 199.77 million | USD 278.74 million | 17.34% |
| 4 | Germany | Europe | USD 43.82 million | USD 151.01 million | USD 205.50 million | 16.71% |
| 5 | Japan | Asia Pacific | USD 43.55 million | USD 152.29 million | USD 208.71 million | 16.96% |
| 6 | United Kingdom | Europe | USD 41.14 million | USD 136.49 million | USD 178.66 million | 15.82% |
| 7 | India | Asia Pacific | USD 30.30 million | USD 140.43 million | USD 247.29 million | 23.36% |
| 8 | France | Europe | USD 27.06 million | USD 93.67 million | USD 128.05 million | 16.82% |
| 9 | Australia | Asia Pacific | USD 26.19 million | USD 100.14 million | USD 150.83 million | 19.13% |
| 10 | Brazil | Latin America | USD 24.24 million | USD 93.36 million | USD 140.96 million | 19.25% |
| 11 | South Korea | Asia Pacific | USD 23.35 million | USD 85.33 million | USD 122.77 million | 18.05% |
| 12 | Singapore | Asia Pacific | USD 21.78 million | USD 71.11 million | USD 89.45 million | 15.18% |
India grows fastest among the 12 countries, from USD 30.30 million in 2025 to USD 247.29 million in 2035, 23.36% a year; Yotta said in February 2026 it would deploy 20,736 NVIDIA Blackwell Ultra GPUs in a liquid-cooled cluster at its 60 MW D2 data center in Noida. In Japan, KDDI’s Osaka Sakai site runs NVIDIA GB200 NVL72 hardware with direct liquid cooling.
Forecast Scenarios: How Large Could the Cold Plate Market Be in 2035?
The base case reaches USD 5.77 billion in 2035; the low case USD 4.66 billion and the high case USD 6.78 billion.
| Scenario | 2035 (USD million) | CAGR 2025-2035 | Assumption |
|---|---|---|---|
| Low | USD 4,661.55 million | 14.88% | AI capacity slips two years, copper stays above USD 13,000 per tonne, PFAS rules hold two-phase at 7% of spend |
| Base | USD 5,769.24 million | 17.35% | New liquid-cooled capacity reaches 20,400 MW a year, cold plates rise to 64.0% of in-rack hardware |
| High | USD 6,784.63 million | 19.27% | Racks above 500 kW arrive before 2030, two-phase plates pass 12% of spend, memory and VRM plates become standard |
Competitive Insights: Who Makes Data Center Cold Plates?
The five largest makers, AVC, Auras, Cooler Master, Boyd Thermal (Eaton) and CoolIT Systems, hold about 45% of 2025 value on the DC Market Insights estimate, built from their reported liquid cooling and thermal revenue and set against the market’s upper and lower bounds; the rest is split among about a dozen specialists and server makers’ in-house teams.
- Asia Vital Components (AVC)
- Auras Technology
- Cooler Master
- Boyd Thermal (Eaton)
- CoolIT Systems (Ecolab)
- Delta Electronics
- Jentech Precision
- Motivair (Schneider Electric)
- JetCool Technologies (Flex)
- Accelsius
- ZutaCore
- Nidec
- Chilldyne (Daikin Applied)
- Alloy Enterprises
- Corintis
- Frore Systems
- Vertiv (cold plate design and integration)
Company facts: Auras reported Q1 2026 revenue of NT$8.55 billion, up 94%, with liquid cooling at 55% of revenue, above air cooling for the first time; AVC’s May 2026 revenue was NT$15.9 billion, up 61%, for the whole company; Boyd Thermal added 25% to Eaton’s Electrical Global sales in Q2 2026; and Ecolab said CoolIT’s year-to-date 2026 sales grew more than 100%.
Recent Developments: What Has Changed for Cold Plate Makers Since 2025?
Five dated moves between March and July 2026 show capital and chip vendors reshaping the supplier base.
- In March 2026, Eaton completed its purchase of Boyd Thermal for USD 9.55 billion net of cash (Source: Eaton).
- In March 2026, NVIDIA named four approved Vera Rubin cold plate suppliers at GTC 2026, reported as AVC, Cooler Master, Delta and Jentech (Source: TVBS News).
- In April 2026, Vertiv acquired Strategic Thermal Labs, a cold plate design and thermal validation firm (Source: Vertiv).
- In May 2026, AVC broke ground on a USD 600 million plant in Vietnam for liquid cooling equipment and water cooling plates (Source: TechNode Global).
- In July 2026, Ecolab completed its USD 4.75 billion purchase of CoolIT Systems (Source: Ecolab).
Methodology: How Did DC Market Insights Size the Cold Plate Market?
DC Market Insights built the USD 1.16 billion 2025 value inside its liquid cooling model from 14 inputs: the USD 5.80 billion liquid cooling total, the 58.0% cold plate share of the USD 2,007.85 million cold plates and in-rack hardware component, and a check against 4,150 MW of new liquid-cooled IT capacity at USD 261 per kW on the 93% new-build share.
- Total: Liquid Cooling component USD 2,007.85 million x cold plate share 58.0% = USD 1,164.55 million (2025); USD 9,014.43 million x 64.0% = USD 5,769.24 million (2035).
- Gap to the component: USD 843.30 million in 2025 = in-rack manifolds USD 461.26 million (Manifolds report) + hoses, quick disconnects, fittings, brackets and tray sensors USD 382.04 million.
- Segments: share paths for 2020, 2025, 2030 and 2035 for each of five dimensions, linear between those years; regions and countries keep the shares of the Liquid Cooling report.
- Ceiling 1: the cold plate value cannot exceed the USD 2,007.85 million cold plates and in-rack hardware component of the Liquid Cooling report in 2025; it is 58.0% of it.
- Ceiling 2: the whole USD 5.80 billion liquid cooling bill of 2025 caps it again; cold plates are 20.1% of that bill, below CDUs at 27.3%.
- Floor: Auras reported 2025 revenue of NT$23.3 billion (about USD 740 million) with liquid cooling at 55%, about USD 400 million from one maker across plates, manifolds and CDUs; even if half were plates, Auras alone would be about 17% of the USD 1.16 billion market, in line with a top five near 45%.
Segments, regions and countries sum to the total in every year, and CAGRs are computed from the end points. The full approach is described in the DC Market Insights research methodology.
Table of contents
- 01Introduction
- 1.1Report Description
- 1.2Key Market Statistics, 2025, 2026, 2030 and 2035
- 02Executive Summary
- 2.1Market Snapshot, 2025, 2026, 2030 and 2035
- 2.2Market Size Chart, 2020-2035
- 03Market Scope
- 3.1Included
- 3.2Excluded
- 3.3How the Cold Plate Segments Add Up
- 04Why Market Estimates Differ
- 4.1Scope Table: Cold Plates within Cold Plates and In-Rack Hardware
- 05Market Drivers
- 5.1Accelerator Power Climbs from 700 W to 1,400 W and Toward 2,000 W
- 5.2Fully Liquid-Cooled Trays Put Plates on Memory, VRMs and Switches
- 5.3Eaton and Ecolab Pay USD 14.3 Billion for Two Cold Plate Makers
- 06Market Trends
- 6.1Jet Impingement and Split-Flow Plates Take Share from Plain Skived Fins
- 6.2Two-Phase Cold Plates Move from Test Rigs to Funded Products
- 6.3Microfluidic and Co-Packaged Cooling Moves Closer to the Silicon
- 07Market Challenges
- 7.1Copper at USD 14,850 per Tonne and a 50% United States Copper Tariff
- 7.2PFAS and F-gas Rules Cloud the Two-Phase Fluid Choice
- 08Market Opportunities
- 8.1Memory, VRM and Switch Plates: USD 116.45 million to USD 1.10 billion
- 8.2Two-Phase Plates for the Next Chip Generations: USD 40.76 million to USD 576.92 million
- 09Pricing Analysis
- 9.1Cold Plate Content per kW, 2020, 2025, 2030 and 2035
- 9.2Copper Price and Tariff Anchors
- 10Standards and Regulation
- 10.1OCP Cold Plate Development and Qualification
- 10.2OCP Single-Phase Cold Plate Test Specification 1.0.0
- 10.3OCP Two-Phase Dielectric Fluid Guidelines Rev 1.1
- 10.4ASHRAE TC 9.9 Water Classes and S-Classes
- 10.5ASHRAE TC 9.9 Coolant Integrity Bulletin
- 10.6EU F-gas Regulation (EU) 2024/573
- 10.7EU PFAS Restriction Proposal
- 10.8US Section 232 Copper Proclamation
- 11Market Segmentation
- 11.1By Type
- 11.2Single-Phase Cold Plates
- 11.3Two-Phase Cold Plates
- 11.4By Design
- 11.5Microchannel and Skived Fin
- 11.6Jet Impingement
- 11.7Other Designs
- 11.8By Material
- 11.9Copper
- 11.10Aluminium
- 11.11Other Materials
- 11.12By Chip Cooled
- 11.13GPU and Accelerators
- 11.14CPU
- 11.15Memory
- 11.16VRM and Other
- 11.17By Data Center Type
- 11.18Hyperscale Data Centers
- 11.19Colocation Data Centers
- 11.20GPU and Neocloud Data Centers
- 11.21HPC and Research Data Centers
- 11.22Enterprise Data Centers
- 12DC Exclusive: Liquid Loop Bill of Materials
- 12.1Cold Plates
- 12.2In-Rack Manifolds
- 12.3Hoses, Quick Disconnects and Other In-Rack Hardware
- 12.4Coolant Distribution Units
- 12.5Heat Exchangers and Tanks
- 12.6Coolants and Fluids
- 12.7Services
- 13Regional Insights
- 13.1North America
- 13.2Asia Pacific
- 13.3Europe
- 13.4Latin America
- 13.5Middle East and Africa
- 14Country Analysis
- 14.1United States
- 14.2China
- 14.3Canada
- 14.4Germany
- 14.5Japan
- 14.6United Kingdom
- 14.7India
- 14.8France
- 14.9Australia
- 14.10Brazil
- 14.11South Korea
- 14.12Singapore
- 15Forecast Scenarios, 2035
- 15.1Low Scenario
- 15.2Base Scenario
- 15.3High Scenario
- 16Competitive Insights
- 16.1Asia Vital Components (AVC)
- 16.2Auras Technology
- 16.3Cooler Master
- 16.4Boyd Thermal (Eaton)
- 16.5CoolIT Systems (Ecolab)
- 16.6Delta Electronics
- 16.7Jentech Precision
- 16.8Motivair (Schneider Electric)
- 16.9JetCool Technologies (Flex)
- 16.10Accelsius
- 16.11ZutaCore
- 16.12Nidec
- 16.13Chilldyne (Daikin Applied)
- 16.14Alloy Enterprises
- 16.15Corintis
- 16.16Frore Systems
- 16.17Vertiv (cold plate design and integration)
- 17Recent Developments
- 17.1Eaton Completes Boyd Thermal Purchase, March 2026
- 17.2NVIDIA Approved Vera Rubin Cold Plate Suppliers, March 2026
- 17.3Vertiv Acquires Strategic Thermal Labs, April 2026
- 17.4AVC Vietnam Plant Groundbreaking, May 2026
- 17.5Ecolab Completes CoolIT Systems Purchase, July 2026
- 18Research Methodology
- 18.1Model Inputs
- 18.2Bound Checks
- Fig. 1Data Center Cold Plate Market Size, 2020-2035 (USD million)
- Table 1Market Snapshot, 2025, 2026, 2030 and 2035
- Table 2Scope Table: Cold Plates within Cold Plates and In-Rack Hardware
- Table 3Cold Plate Content per kW, 2020-2035
- Table 4Market by Type, 2025, 2030 and 2035
- Table 5Market by Design, 2025, 2030 and 2035
- Table 6Market by Material, 2025, 2030 and 2035
- Table 7Market by Chip Cooled, 2025, 2030 and 2035
- Table 8Market by Data Center Type, 2025, 2030 and 2035
- Table 9Liquid Loop Bill of Materials, 2025 and 2035
- Table 10Market by Region, 2025, 2030 and 2035
- Table 11Top 12 Countries, 2025, 2030 and 2035
- Table 122035 Forecast Scenarios
About this report
Written by Amit Jain and reviewed by Deepti Agrawal, Senior Editor, Research. Figures are built top-down and bottom-up and reconciled before publication, with 2025 as the base year.
Read our methodologyHow we built this
- Historical period2020-2024
- Base year2025
- Forecast period2026-2035
- Sizing approachTop-down + bottom-up
Need more than the report?
Advisory on this market
Due diligence, site selection and market entry work, by the analysts who wrote this report.
See consulting servicesFrequently asked questions
USD 1.78 billion in 2026, up 53.12% from USD 1.16 billion in 2025, according to DC Market Insights estimates. The market is projected to reach USD 5.77 billion by 2035, a CAGR of 17.35% from 2025.
USD 4.12 billion in 2030 in the base case, 3.54 times the 2025 value, after 28.76% a year from 2025. Growth then slows to 6.95% a year to 2035 as new liquid-cooled capacity levels off.
In 2030 single-phase plates hold 93.5% of value, microchannel and skived fin designs 72.0%, copper 84.0%, GPU and accelerator plates 66.0% and hyperscale data centers 52.0% (DC Market Insights estimates).
Single-phase plates pass water or water-glycol that warms without boiling; two-phase plates boil a dielectric refrigerant inside the plate. Two-phase plates grow from 3.5% of 2025 spend to 10.0% in 2035, 30.34% a year.
The cold plate takes heat from the chip; in-rack manifolds and quick disconnects carry coolant to it, and the coolant distribution unit (CDU) passes the heat to facility water. In 2025 cold plates were USD 1.16 billion against USD 1.58 billion for CDUs in the liquid cooling model.
About USD 261 per kW of new liquid-cooled IT capacity in 2025, down from about USD 323 in 2020, settling near USD 252 by 2035 as two-phase, jet impingement and memory plates add value (DC Market Insights estimates).
GPU and accelerator plates, with USD 791.89 million or 68.0% of 2025 spend. Memory plates grow fastest at 27.27% a year as fully liquid-cooled trays put plates on every hot part.
North America, with USD 521.72 million or 44.8% of 2025 spend. Middle East and Africa grows fastest at 20.37% a year, and India is the fastest large country at 23.36% a year.
AVC, Auras, Cooler Master, Boyd Thermal (Eaton) and CoolIT Systems (Ecolab) hold about 45% of 2025 value (DC Market Insights estimate). Eaton paid USD 9.55 billion for Boyd Thermal and Ecolab USD 4.75 billion for CoolIT in 2026.
USD 1.78 billion in 2026 is the DC Market Insights value of the plate alone. Counting the in-rack hardware around it gives USD 2.01 billion for 2025, and the whole direct-to-chip loop with manifolds, hoses and CDUs is about 3.08 times the plate value.
Licences, delivery and payment
Which licence should I choose?
Single User is a view-only PDF for one person. Multi User adds a printable PDF and the Excel data for unlimited users at one location. Enterprise covers your whole company and includes 100 free analyst hours.
How and when will I receive the report?
By email, within 24–48 business hours of payment, in the formats of your licence.
How can I pay?
Securely through PayPal: with a PayPal account, a debit or credit card, or PayPal Pay Later where available. Prices are in US dollars.
Can I see a sample first?
Yes. Request a free sample and we will email it to you.
Can the report be tailored to my needs?
Yes. We can add countries, segments or data cuts. Talk to an analyst about the scope you need.
Can I get an invoice or pay against a purchase order?
Write to sales@dcmarketinsights.com and our team will help.