
Education Data Center Market Size, Share & Forecast to 2035
Market at a glance
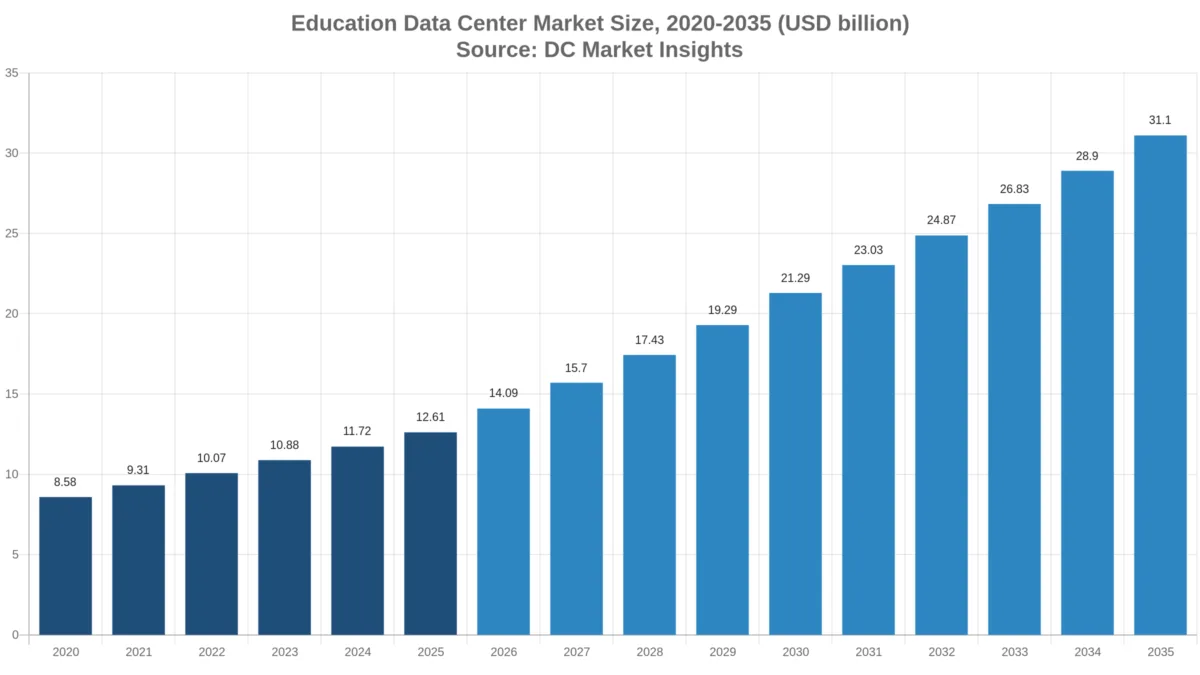
The Education Data Center market was worth USD 12.61 billion in 2025 and is forecast to reach USD 31.10 billion by 2035, growing at a 9.45% CAGR.
 By Amit Jain, Senior Consultant, ICT & Emerging Technologies
 Reviewed by Deepti Agrawal
Last updated 29 Oct 2026
Base year 2025 PDF + Excel
Key findings
NSF NAIRR Reaches 600 Research Teams as TACC Horizon Opens a 15-20 MW Hall
NC State, Yale and Cardiff Move Research Computing Off Campus
Shared Academic GPU Capacity: India Offers 38,000 GPUs at Under INR 100 an Hour
What is inside the report
- 01Introduction
- 02Executive Summary
- 03Market Scope
- 04Why Market Estimates Differ
- 05Market Drivers
- 06Market Trends
- 07Market Challenges and Restraints
- 08Market Opportunities
- 09Pricing Analysis
- 10Standards and Regulation
- 18chapters
- 2020-2024Historical period
- 2026-2035Forecast period
- —Companies profiled
Segmentation
Recent developments
NSF set up the NAIRR Operations Center led by the San Diego Supercomputer Center with TACC, after more than 800 pilot projects (Source: NSF).
the UK Department for Education updated its digital and technology standards for schools and colleges (Source: Department for Education).
EuroHPC signed a EUR 290 million contract for the IT4LIA AI factory system at CINECA (Source: EuroHPC Joint Undertaking).
the Harvard Kempner Institute added 424 H200 and 192 RTX PRO 6000 GPUs, taking its MGHPCC cluster to 1,144 GPUs (Source: Kempner Institute).
the Government of India said the IndiaAI Mission offers 38,000 GPUs at under INR 100 an hour (Source: Press Information Bureau).
the UK government committed GBP 36 million to expand Cambridge's Dawn sixfold (Source: GOV.UK).
Full analysis
The Education Data Center Market is valued at USD 14.09 billion in 2026 and is projected to reach USD 31.10 billion by 2035, up from USD 12.61 billion in 2025, a CAGR of 9.45% from 2025 to 2035 (DC Market Insights estimate). Money in this market moves on research grants and national AI programmes more than on enrollment: the U.S. National Science Foundation (NSF) says its National Artificial Intelligence Research Resource (NAIRR) pilot has served more than 600 research teams and 6,000 students in all 50 states since 2024 (NSF, March 2026), and the UK government plans to expand its AI Research Resource twenty-fold to 420 AI exaflops by 2030 (UK Department for Science, Innovation and Technology, July 2025). The 2025 receipt is 2,600 megawatts (MW) of information technology (IT) load used by schools, universities, research institutes and education technology (edtech) providers x USD 4.85 million of yearly spending per MW = USD 12.61 billion. AI training and inference is the fastest workload at 19.38% a year because universities now buy their own graphics processing unit (GPU) pods, and Asia Pacific is the fastest region at 11.26%, led by India’s shared GPU programme and Korean and Japanese national systems.
Key Market Statistics: How Big Is the Education Data Center Market in 2026?
DC Market Insights values education data center spending at USD 14.09 billion in 2026, 11.77% above 2025, as universities add GPU clusters and schools and colleges move student systems to cloud and shared sites.
- Education data center market size 2025: USD 12.61 billion
- Market size 2026: USD 14.09 billion
- Market size 2030: USD 21.29 billion
- Market size 2035: USD 31.10 billion
- CAGR 2025-2035: 9.45% (low case 7.60%, high case 11.20%)
- Largest component: cloud infrastructure services, USD 5.69 billion or 45.1% of 2025 value
- Fastest workload: AI training and inference, 19.38% a year to USD 9.64 billion by 2035
- Largest end user: higher education, USD 6.05 billion in 2025; fastest: research institutes and supercomputing centers at 13.29%
- Leading region: North America, USD 4.79 billion or 38.0% of 2025 value; fastest region: Asia Pacific at 11.26%
- Largest country: United States, USD 4.22 billion in 2025; fastest large country: India at 15.36%
- Market leaders: Amazon Web Services, Microsoft Azure and Google Cloud in hosted capacity, with Hewlett Packard Enterprise, Dell Technologies and NVIDIA in university AI systems (DC Market Insights assessment)
Executive Summary: Education Data Center Market Size, 2020-2035
The Global Education Data Center Market size was valued at USD 8.58 billion in 2020, reached USD 12.61 billion in 2025, and is anticipated to reach USD 31.10 billion by 2035, at a CAGR of 9.45% during the forecast period. Growth was 8.01% a year from 2020 to 2025, when remote learning pushed learning platforms and student systems onto cloud; from 2025 the mix shifts towards GPU capacity, whose share of education IT load rises from 9% to 30% by 2035.
| Attribute | Value |
|---|---|
| Historical period | 2020-2024 |
| Base year | 2025 |
| Forecast period | 2026-2035 |
| Market size 2025 | USD 12.61 billion |
| Market size 2026 | USD 14.09 billion |
| CAGR 2025-2035 | 9.45% |
| Market size 2035 | USD 31.10 billion |
| Segments covered | Component, deployment model, workload, end user, region, 12 countries |
Owned campus data centers grow only 6.63% a year to USD 9.13 billion in 2035, while public cloud spending rises to USD 15.98 billion and colocation grows fastest at 11.55% as universities move research clusters to shared, liquid-cooled halls.
Which Data Centers Count in the Education Data Center Market?
The Education Data Center Market counts USD 12.61 billion of 2025 spending on data center capacity that education buyers own, colocate or rent for their own services.
Included: campus data centers of universities and colleges; school district and ministry data centers; university and national research computing (high-performance computing, HPC) and AI supercomputers run for academic users; research and education network data centers; colocation that education buyers lease (for example Jisc’s shared data centre service at aql and VIRTUS for UK members); public cloud infrastructure that schools, universities and edtech providers rent; and the IT hardware, electrical and mechanical infrastructure and fit-out inside owned and colocated sites.
Excluded: classroom devices and campus Wi-Fi, learning software licences and edtech revenue, national weather and defence supercomputers with no academic allocation, and cloud capacity of the general platforms that education users reach as consumers (search, social and video). Electricity bills are excluded.
How the segments fit together: every segment table splits the same USD 12.61 billion for 2025 and USD 31.10 billion for 2035 in a different way: by component, by deployment model, by workload and by end user, then by five regions and 12 countries.
Why Do Education Data Center Market Estimates Differ?
The DC Market Insights estimate of USD 14.09 billion for 2026 counts only data center capacity used for education and academic research services. Broader definitions add the education technology software market, campus networks and student devices, or the full value of national supercomputers that serve industry and government users, and they come out several times larger. Narrower definitions count only owned campus server rooms and miss the cloud bills that now carry most student systems.
| Element | In this report | Why |
|---|---|---|
| Public cloud rented by schools, universities and edtech | Yes, USD 5.69 billion in 2025 | It replaces campus server rooms |
| University AI and HPC clusters | Yes, inside IT hardware and colocation | Built and run for academic users |
| Colocation leased by education buyers | Yes, USD 819.00 million in 2025 | Shared sites such as Jisc and MGHPCC |
| Learning software and edtech revenue | No | Software, not data center capacity |
| Student devices and campus networks | No | Outside the data center |
| National supercomputers for non-academic users | No | Counted in the government data center market |
Buyer groups inside the estimate include K-12 school districts and small colleges as well as large research universities: 99,297 U.S. public schools and 5,819 Title IV colleges and universities are potential buyers, according to the National Center for Education Statistics (NCES). Government research labs outside academia sit in the Government Data Center Market.
Market Drivers: Why Are Universities and Schools Buying More Data Center Capacity?
Three programmes explain most of the growth from USD 12.61 billion in 2025 to USD 31.10 billion in 2035: national AI research resources, university GPU purchases and shared European AI factories.
NSF NAIRR Reaches 600 Research Teams as TACC Horizon Opens a 15-20 MW Hall
The NAIRR pilot has supported more than 600 research teams and 6,000 students with 13 federal agencies and 28 private partners, according to NSF (March 2026), and in September 2026 NSF set up a NAIRR Operations Center led by the San Diego Supercomputer Center with the Texas Advanced Computing Center (TACC), after more than 800 projects. TACC’s Horizon system brings 4,000 GPUs into a new 15-20 MW liquid-cooled data center in Round Rock, Texas, from spring 2026, according to TACC (November 2025). DC Market Insights counts these academic allocations in research institutes and supercomputing centers, a segment that grows from USD 2.14 billion to USD 7.46 billion.
Isambard-AI’s 5,448 GH200 Chips Anchor a 420 AI Exaflop UK Target
The University of Bristol launched the GBP 225 million Isambard-AI in July 2025 with 5,448 NVIDIA GH200 superchips in a 5 MW direct-liquid-cooled facility, according to the University of Bristol. The UK government set aside GBP 1 billion for compute in the Spending Review and plans 420 AI exaflops by 2030, and in January 2026 it added GBP 36 million to make Cambridge’s Dawn six times more powerful. These awards make the United Kingdom the third-largest country market at USD 693.55 million in 2025.
19 EuroHPC AI Factories Put University Sites on an EUR 980 Million Call
The EuroHPC Joint Undertaking call for AI factory hosts carried up to EUR 800 million from the Digital Europe Programme plus up to EUR 180 million from Horizon Europe (EuroHPC Joint Undertaking, September 2024), and 19 sites had been selected by October 2025, including university-led hosts such as VSB-Technical University of Ostrava, Vilnius University and Cyfronet AGH. Europe’s education data center spending grows from USD 3.28 billion in 2025 to USD 7.46 billion in 2035.
Market Trends: How Are Universities Changing Where They Compute?
Education buyers are moving owned server rooms into colocation and cloud: colocation grows 11.55% a year and public cloud 10.67%, against 6.63% for owned sites.
NC State, Yale and Cardiff Move Research Computing Off Campus
North Carolina State University moved two campus data centers to colocation sites and avoided about USD 20 million of one-time power and cooling refresh costs, moving or retiring 1,545 devices between July 2022 and April 2023, according to its Office of Information Technology. Yale’s research computing is moving from its West Campus data center to the Massachusetts Green High Performance Computing Center (MGHPCC) in 2026, according to the Yale Center for Research Computing, and Cardiff University moved research computing to a Tier III third-party data centre between October and December 2025.
Edtech Platforms Run on Public Cloud, and Outages Reach the Classroom
Instructure hosts the Canvas learning platform on Amazon Web Services (AWS) in Virginia, Ohio and Oregon for 8,085 customers (Instructure 10-K, December 2023), Coursera’s production runs in the cloud for about 197 million registered learners (Coursera 10-K, 2025), and an AWS us-east-1 outage on 20 October 2025 took Duolingo offline for over 12 hours (Duolingo annual report on Form 10-K, 2026). Education technology providers spend USD 1.89 billion in 2025, almost all of it on rented capacity.
Universities Buy Their Own GPU Pods: 504 B200s at Florida and 760 H200s at Texas A&M
The University of Florida installed 504 NVIDIA B200 GPUs in 63 DGX nodes for USD 33 million in October 2025, and the Texas A&M University System bought a USD 45 million DGX SuperPOD with 760 Hopper GPUs in February 2025, according to both universities. DC Market Insights prices GPU capacity at USD 8.20 million per MW-year of servers against USD 2.40 million for conventional capacity, which is why GPU load of 9% in 2025 already drives 13.0% of spending.
Market Challenges and Restraints: What Holds Back Education Data Center Spending?
Security incidents and grant-driven budgets slow the market: administrative and student systems, USD 3.78 billion in 2025, grow only 4.56% a year.
One Compromised Credential Exposed PowerSchool Data on 880,000 Texas Students and Teachers
PowerSchool found unauthorized access to its student information system data through a compromised credential on 28 December 2024, according to the company’s customer notice, and the Texas Attorney General said in 2025 that the breach exposed data of more than 880,000 Texas students and teachers. The U.S. Federal Trade Commission’s amended Children’s Online Privacy Protection Act (COPPA) Rule, with a compliance date of 22 April 2026 (Federal Register, April 2025), adds retention and deletion duties, so districts spend on compliance before capacity.
Grant Cycles Decide When Campus Halls Are Refreshed
Research computing is bought in steps tied to awards: the University of Florida Board of Trustees approved USD 24 million for its upgrade in December 2024, and Georgia Tech’s Nexus system rests on a USD 20 million NSF grant, according to the two universities. Owned electrical and mechanical infrastructure therefore grows only 3.67% a year to USD 969.00 million in 2035.
Market Opportunities: Where Is the New Education Computing Demand?
Shared AI capacity and shared colocation are the two openings, worth USD 9.64 billion and USD 2.13 billion by 2035.
Shared Academic GPU Capacity: India Offers 38,000 GPUs at Under INR 100 an Hour
The IndiaAI Mission offers shared cloud access to 38,000 GPUs and 1,050 tensor processing units at under INR 100 an hour, and India’s National Supercomputing Mission has deployed more than 40 petaflops across Indian Institutes of Technology and research institutes (Press Information Bureau, Government of India, February 2026). India is the fastest large country, growing 15.36% a year from USD 327.86 million to USD 1.37 billion.
Tier III Shared Sites for Colleges, as Jisc Does in the UK
Jisc’s shared data centre service runs at aql in the north and VIRTUS in the south, built to Tier III with racks of 4 to 30 kilowatts (kW) and multiple 100 gigabit links to the Janet network, according to Jisc. DC Market Insights expects colocation services sold to education buyers to grow from USD 819.00 million in 2025 to USD 2.13 billion in 2035, a 10.03% CAGR; see the Data Center Colocation Market for the wider supply side.
How Much Does an Education Buyer Spend per MW of Data Center Capacity?
Education buyers spent USD 4.85 million per MW of IT load in use in 2025, DC Market Insights estimates, rising to USD 6.10 million in 2035 as GPU capacity takes a larger share.
| Year | IT load in use (MW) | Market size | Spending per MW in use |
|---|---|---|---|
| 2020 | 2,050 | USD 8.58 billion | USD 4.18 million |
| 2025 | 2,600 | USD 12.61 billion | USD 4.85 million |
| 2030 | 3,700 | USD 21.29 billion | USD 5.75 million |
| 2035 | 5,100 | USD 31.10 billion | USD 6.10 million |
Public price anchors: the University of Florida paid USD 33 million for 504 B200 GPUs, about USD 65,500 per GPU installed; the Texas A&M University System paid USD 45 million for 760 Hopper GPUs, about USD 59,200 per GPU; and Korea’s Ministry of Science and ICT funded 8,496 GPUs for the KISTI national supercomputer with KRW 382.5 billion. DC Market Insights uses USD 175 per kW-month for education colocation in 2025, a DC Market Insights estimate.
Which Rules and Standards Shape Education Data Centers?
Five rule sets shape where the USD 12.61 billion of 2025 spending goes: student privacy law, children’s privacy rules, school technology standards, cybersecurity funding and EU energy reporting.
- U.S. Family Educational Rights and Privacy Act (FERPA): governs student records that districts and colleges store in owned and cloud systems.
- FTC COPPA Rule as amended (Federal Register, 22 April 2025): effective 23 June 2025, with compliance due 22 April 2026 (Source: Federal Register).
- Federal Communications Commission Schools and Libraries Cybersecurity Pilot Program: up to USD 200 million over three years for selected schools and libraries (Source: FCC).
- UK Department for Education digital and technology standards: all schools and colleges should meet 6 core standards by 2030, with separate cloud and server standards; guidance updated 16 September 2026 (Source: Department for Education).
- EU Delegated Regulation 2024/1364: data centers of 500 kW and more, including university sites, report energy and water data each year (Source: European Commission).
Education Data Center Market Segmentation: Which Segment Spends Most?
The largest component is cloud infrastructure services at USD 5.69 billion in 2025, higher education the largest end user at USD 6.05 billion, and learning platforms and content delivery the largest workload at USD 4.04 billion.
By Component
Cloud infrastructure services hold 45.1% of 2025 value and grow fastest at 10.68% a year.
| Component | 2025 (USD million) | Share 2025 | 2035 (USD million) | CAGR 2025-2035 |
|---|---|---|---|---|
| Cloud Infrastructure Services | USD 5,686.83 million | 45.1% | USD 15,686.01 million | 10.68% |
| IT Hardware | USD 5,090.12 million | 40.4% | USD 11,654.04 million | 8.64% |
| Colocation Services | USD 819.00 million | 6.5% | USD 2,129.49 million | 10.03% |
| Electrical and Mechanical Infrastructure | USD 676.00 million | 5.4% | USD 969.00 million | 3.67% |
| Construction and Fit-Out | USD 338.00 million | 2.7% | USD 663.00 million | 6.97% |
By Deployment Model
Owned data centers hold 38.1% of 2025 value; colocation grows fastest at 11.55% a year as research clusters leave campus.
| Deployment Model | 2025 (USD million) | Share 2025 | 2035 (USD million) | CAGR 2025-2035 |
|---|---|---|---|---|
| Public Cloud | USD 5,798.37 million | 46.0% | USD 15,977.73 million | 10.67% |
| Owned Data Centers | USD 4,802.30 million | 38.1% | USD 9,129.04 million | 6.63% |
| Colocation | USD 2,009.28 million | 15.9% | USD 5,994.77 million | 11.55% |
By Workload
AI training and inference grows 19.38% a year and becomes the largest workload by 2035 with 31.0% of value.
| Workload | 2025 (USD million) | Share 2025 | 2035 (USD million) | CAGR 2025-2035 |
|---|---|---|---|---|
| Learning Platforms and Content Delivery | USD 4,035.18 million | 32.0% | USD 8,708.43 million | 8.00% |
| Administrative and Student Systems | USD 3,782.99 million | 30.0% | USD 5,909.29 million | 4.56% |
| Research HPC | USD 3,152.49 million | 25.0% | USD 6,842.34 million | 8.06% |
| AI Training and Inference | USD 1,639.29 million | 13.0% | USD 9,641.48 million | 19.38% |
By End User
Higher education holds 48.0% of 2025 value; research institutes and supercomputing centers grow fastest at 13.29% a year.
| End User | 2025 (USD million) | Share 2025 | 2035 (USD million) | CAGR 2025-2035 |
|---|---|---|---|---|
| Higher Education | USD 6,052.78 million | 48.0% | USD 13,684.67 million | 8.50% |
| K-12 Schools | USD 2,521.99 million | 20.0% | USD 4,976.25 million | 7.03% |
| Research Institutes and Supercomputing Centers | USD 2,143.69 million | 17.0% | USD 7,464.37 million | 13.29% |
| Education Technology Providers | USD 1,891.49 million | 15.0% | USD 4,976.25 million | 10.16% |
DC Exclusive: Academic AI Compute Tracker, 11 Systems and 29,290 GPUs
The Academic AI Compute Tracker is a DC Market Insights model built on 12 inputs from university, research-center and government releases; it counts 29,290 GPUs in 11 systems announced or delivered between 2024 and 2026, with TACC’s 4,000 Horizon GPUs counted inside the University of Texas total.
| System | GPUs and value | Date | Hosting |
|---|---|---|---|
| University of Texas at Austin (incl. TACC Horizon) | More than 5,000 NVIDIA GPUs; Horizon 4,000 GPUs in a 15-20 MW hall | Nov 2025 | Owned, Round Rock data center |
| Korea Institute of Science and Technology Information (KISTI) | 8,496 NVIDIA GPUs incl. GH200, KRW 382.5 billion | May 2025 | National research center |
| AIST ABCI 3.0, Japan | 6,128 NVIDIA H200 GPUs | 2025 | National open AI infrastructure for academia |
| University of Bristol Isambard-AI | 5,448 GH200 superchips, GBP 225 million, 5 MW | Jul 2025 | Owned, direct liquid cooling |
| Harvard Kempner Institute | 1,144 GPUs | Mar 2026 | Colocated at MGHPCC |
| University of Tokyo Miyabi | 1,120 GH200 nodes | 2025 | Owned |
| Texas A&M University System | 760 Hopper GPUs, USD 45 million | Feb 2025 | Owned |
| University of Florida HiPerGator | 504 B200 GPUs, USD 33 million | Oct 2025 | Owned |
| Princeton University | 300 H100 GPUs | 2024 | Owned |
| Arizona State University Sol | 262 A100 GPUs | May 2026 statement | Owned, new hall 4x the old campus site |
| Ohio Supercomputer Center Cardinal | 128 H100 GPUs | Feb 2024 | State center for Ohio universities |
At the University of Florida and Texas A&M prices of USD 59,200 to 65,500 per GPU, the 29,290 GPUs represent roughly USD 1.7 billion to 1.9 billion of hardware, which DC Market Insights spreads over 2024-2026 inside IT hardware and colocation. Seven of the 11 systems are owned by the university, one sits in shared colocation and three are national or state centers that sell time to universities, so owned sites still hold 38.1% of 2025 value.
Which Region Leads the Education Data Center Market?
North America leads with USD 4.79 billion or 38.0% of 2025 value, and Asia Pacific grows fastest at 11.26% a year.
| Region | 2025 (USD million) | Share 2025 | 2035 (USD million) | CAGR 2025-2035 |
|---|---|---|---|---|
| North America | USD 4,791.77 million | 38.0% | USD 10,574.53 million | 8.24% |
| Asia Pacific | USD 3,530.79 million | 28.0% | USD 10,263.51 million | 11.26% |
| Europe | USD 3,278.59 million | 26.0% | USD 7,464.37 million | 8.58% |
| Latin America | USD 630.50 million | 5.0% | USD 1,710.58 million | 10.50% |
| Middle East and Africa | USD 378.30 million | 3.0% | USD 1,088.55 million | 11.15% |
North America
North America reaches USD 10.57 billion by 2035 at 8.24% a year, carried by NSF programmes, state funding such as the USD 20 million the Texas Legislature appropriated for University of Texas AI infrastructure, and cloud-hosted edtech platforms.
Asia Pacific
Asia Pacific grows from USD 3.53 billion to USD 10.26 billion; China’s National Smart Education Platform had more than 164 million registered users and 61.3 billion page views by April 2025, according to the State Council, and Korea and Japan add national GPU systems for universities.
Europe
Europe grows 8.58% a year to USD 7.46 billion as EuroHPC signed a EUR 290 million contract for the IT4LIA AI factory system at CINECA in Bologna in April 2026, and UK universities move research computing into Tier III shared sites.
Latin America
Latin America holds USD 630.50 million in 2025 and grows 10.50% a year, with Brazil the largest country at USD 264.81 million as universities and state school systems buy cloud capacity.
Middle East and Africa
Middle East and Africa grows from USD 378.30 million to USD 1.09 billion, an 11.15% CAGR, as Gulf universities add research clusters and ministries move school platforms to in-country cloud regions (DC Market Insights estimate).
Top 12 Countries in the Education Data Center Market
The United States leads with USD 4.22 billion in 2025, and India is the fastest large country at 15.36% a year.
| Rank | Country | Region | 2025 (USD million) | 2035 (USD million) | CAGR 2025-2035 |
|---|---|---|---|---|---|
| 1 | United States | North America | USD 4,224.33 million | USD 9,174.95 million | 8.06% |
| 2 | China | Asia Pacific | USD 1,387.09 million | USD 4,198.71 million | 11.71% |
| 3 | United Kingdom | Europe | USD 693.55 million | USD 1,617.28 million | 8.84% |
| 4 | Germany | Europe | USD 655.72 million | USD 1,492.87 million | 8.58% |
| 5 | Japan | Asia Pacific | USD 605.28 million | USD 1,430.67 million | 8.98% |
| 6 | France | Europe | USD 453.96 million | USD 1,026.35 million | 8.50% |
| 7 | Canada | North America | USD 403.52 million | USD 933.05 million | 8.74% |
| 8 | India | Asia Pacific | USD 327.86 million | USD 1,368.47 million | 15.36% |
| 9 | Australia | Asia Pacific | USD 290.03 million | USD 684.23 million | 8.96% |
| 10 | South Korea | Asia Pacific | USD 277.42 million | USD 746.44 million | 10.40% |
| 11 | Brazil | Latin America | USD 264.81 million | USD 730.89 million | 10.69% |
| 12 | Italy | Europe | USD 239.59 million | USD 559.83 million | 8.86% |
The 12 countries hold 77.9% of 2025 value. China grows 11.71% a year to USD 4.20 billion, and South Korea 10.40% as the KISTI system enters service.
Forecast Scenarios: How Large Could the Education Data Center Market Be in 2035?
The 2035 Education Data Center Market ranges from USD 26.23 billion in the low case to USD 36.46 billion in the high case, around the USD 31.10 billion base case.
| Scenario | 2035 market size | CAGR 2025-2035 | Assumption |
|---|---|---|---|
| Low | USD 26.23 billion | 7.60% | GPU share reaches 22% of education IT load; national AI programmes slip |
| Base | USD 31.10 billion | 9.45% | GPU share 30%; IT load 5,100 MW |
| High | USD 36.46 billion | 11.20% | GPU share 38%; national AI resources meet 2030 targets |
Low Scenario
USD 26.23 billion by 2035 (7.60% a year) if research budgets stay flat after current awards and schools keep spending on security before capacity.
Base Scenario
USD 31.10 billion by 2035 (9.45% a year), with education IT load rising from 2,600 MW to 5,100 MW.
High Scenario
USD 36.46 billion by 2035 (11.20% a year) if the UK 420 AI exaflop target and EuroHPC AI factories are matched by U.S. and Asian university programmes.
Key Players and Market Share: Who Supplies Education Data Centers?
Amazon Web Services, Microsoft Azure and Google Cloud hold about 70% of the USD 5.69 billion cloud segment in 2025, a DC Market Insights estimate based on the providers named in edtech filings and university cloud programmes; owned-site hardware is less concentrated.
- Amazon Web Services
- Microsoft Azure
- Google Cloud
- Oracle Cloud Infrastructure
- Alibaba Cloud
- Dell Technologies
- Hewlett Packard Enterprise
- Lenovo
- Supermicro
- NVIDIA
- AMD
- Intel
- Equinix
- Digital Realty
- Vertiv
- Schneider Electric
Supplier Facts, 2023-2026
Hewlett Packard Enterprise built Isambard-AI for the University of Bristol and holds the KRW 382.5 billion KISTI contract, according to the two institutions; Dell Technologies and Intel built Cambridge’s Dawn in 2023, according to the University of Cambridge; AMD MI355X GPUs come with the January 2026 Dawn expansion, according to the UK government; and NVIDIA supplies the GPUs in all 11 tracked systems. Hosted capacity for edtech platforms sits with AWS and Google Cloud, according to Duolingo and Instructure filings.
Recent Developments in the Education Data Center Market
Six dated events from 2025 and 2026 moved the Education Data Center Market, which reaches USD 14.09 billion in 2026.
- In September 2026, NSF set up the NAIRR Operations Center led by the San Diego Supercomputer Center with TACC, after more than 800 pilot projects (Source: NSF).
- In September 2026, the UK Department for Education updated its digital and technology standards for schools and colleges (Source: Department for Education).
- In April 2026, EuroHPC signed a EUR 290 million contract for the IT4LIA AI factory system at CINECA (Source: EuroHPC Joint Undertaking).
- In March 2026, the Harvard Kempner Institute added 424 H200 and 192 RTX PRO 6000 GPUs, taking its MGHPCC cluster to 1,144 GPUs (Source: Kempner Institute).
- In February 2026, the Government of India said the IndiaAI Mission offers 38,000 GPUs at under INR 100 an hour (Source: Press Information Bureau).
- In January 2026, the UK government committed GBP 36 million to expand Cambridge’s Dawn sixfold (Source: GOV.UK).
Research Methodology: How DC Market Insights Sized the Education Data Center Market
The USD 12.61 billion 2025 value is a bottom-up DC Market Insights model of 2,600 MW of education IT load in use, about 5.7% of the roughly 46 gigawatts (GW) of enterprise and colocation-class capacity plus the cloud capacity education buyers rent, priced component by component; see the DC Market Insights research methodology.
Model Inputs
Education IT load in use of 2,050, 2,600, 3,700 and 5,100 MW in 2020, 2025, 2030 and 2035; owned share 62%, 52%, 44% and 38%; colocated share 12%, 15%, 17% and 18%; public cloud the remainder; GPU share 3%, 9%, 22% and 30%. Servers cost USD 2.40 million per conventional MW-year and USD 8.20 million per GPU MW-year; cloud USD 5.80 million and USD 15.00 million per MW-year; colocation USD 175 per kW-month; owned electrical and mechanical upkeep USD 0.50 million per owned MW-year; construction and fit-out USD 0.13 million per MW in use. For 2025: hardware USD 5.09 billion + cloud USD 5.69 billion + colocation USD 819.00 million + electrical and mechanical USD 676.00 million + construction USD 338.00 million = USD 12.61 billion.
Bound Checks
- Ceiling: USD 12.61 billion is 2.2% of the DC Market Insights global data center market of USD 570.04 billion in 2025, below the healthcare share of 2.7% and the government share of 3.4% (see the Healthcare Data Center Market and Media and Entertainment Data Center Market for sibling verticals).
- Floor: five named academic purchases (University of Florida USD 33 million, Texas A&M USD 45 million, Isambard-AI GBP 225 million, KISTI KRW 382.5 billion and IT4LIA EUR 290 million) add up to about USD 0.97 billion, below the USD 2.14 billion research institutes segment for 2025 alone.
- Per-buyer check: the U.S. value of USD 4.22 billion spread over 5,819 Title IV institutions and 13,303 regular school districts is about USD 0.22 million per buyer a year, in line with one small server room or a cloud contract per district.
Table of contents
- 01Introduction
- 1.1Report Description
- 1.2Key Market Statistics, 2025, 2026, 2030 and 2035
- 02Executive Summary
- 2.1Market Snapshot, 2025, 2026 and 2035
- 2.2Market Size Chart, 2020-2035
- 03Market Scope
- 3.1Included
- 3.2Excluded
- 3.3How the Segments Fit Together
- 04Why Market Estimates Differ
- 4.1Scope Table: In and Out of the DC Market Insights Estimate
- 05Market Drivers
- 5.1NSF NAIRR Reaches 600 Research Teams as TACC Horizon Opens a 15-20 MW Hall
- 5.2Isambard-AI's 5,448 GH200 Chips Anchor a 420 AI Exaflop UK Target
- 5.319 EuroHPC AI Factories Put University Sites on an EUR 980 Million Call
- 06Market Trends
- 6.1NC State, Yale and Cardiff Move Research Computing Off Campus
- 6.2Edtech Platforms Run on Public Cloud, and Outages Reach the Classroom
- 6.3Universities Buy Their Own GPU Pods: 504 B200s at Florida and 760 H200s at Texas A&M
- 07Market Challenges and Restraints
- 7.1One Compromised Credential Exposed PowerSchool Data on 880,000 Texas Students and Teachers
- 7.2Grant Cycles Decide When Campus Halls Are Refreshed
- 08Market Opportunities
- 8.1Shared Academic GPU Capacity: India Offers 38,000 GPUs at Under INR 100 an Hour
- 8.2Tier III Shared Sites for Colleges, as Jisc Does in the UK
- 09Pricing Analysis
- 9.1Spending per MW, 2020-2035
- 9.2Public Price Anchors
- 10Standards and Regulation
- 10.1FERPA and the Amended COPPA Rule
- 10.2FCC Schools and Libraries Cybersecurity Pilot Program
- 10.3UK Department for Education Digital and Technology Standards
- 10.4EU Delegated Regulation 2024/1364
- 11Market Segmentation
- 11.1By Component: Cloud Infrastructure Services, IT Hardware, Colocation Services, Electrical and Mechanical Infrastructure, Construction and Fit-Out
- 11.2By Deployment Model: Public Cloud, Owned Data Centers, Colocation
- 11.3By Workload: Learning Platforms and Content Delivery, Administrative and Student Systems, Research HPC, AI Training and Inference
- 11.4By End User: Higher Education, K-12 Schools, Research Institutes and Supercomputing Centers, Education Technology Providers
- 12DC Exclusive: Academic AI Compute Tracker
- 12.1University of Texas at Austin (incl. TACC Horizon)
- 12.2Korea Institute of Science and Technology Information (KISTI)
- 12.3AIST ABCI 3.0, Japan
- 12.4University of Bristol Isambard-AI
- 12.5Harvard Kempner Institute
- 12.6University of Tokyo Miyabi
- 12.7Texas A&M University System
- 12.8University of Florida HiPerGator
- 12.9Princeton University
- 12.10Arizona State University Sol
- 12.11Ohio Supercomputer Center Cardinal
- 13Regional Insights
- 13.1North America
- 13.2Asia Pacific
- 13.3Europe
- 13.4Latin America
- 13.5Middle East and Africa
- 14Country Analysis
- 14.1United States
- 14.2China
- 14.3United Kingdom
- 14.4Germany
- 14.5Japan
- 14.6France
- 14.7Canada
- 14.8India
- 14.9Australia
- 14.10South Korea
- 14.11Brazil
- 14.12Italy
- 15Forecast Scenarios
- 15.1Low Scenario
- 15.2Base Scenario
- 15.3High Scenario
- 16Competitive Insights
- 16.1Cloud Provider Concentration, 2025
- 16.2Amazon Web Services
- 16.3Microsoft Azure
- 16.4Google Cloud
- 16.5Oracle Cloud Infrastructure
- 16.6Alibaba Cloud
- 16.7Dell Technologies
- 16.8Hewlett Packard Enterprise
- 16.9Lenovo
- 16.10Supermicro
- 16.11NVIDIA
- 16.12AMD
- 16.13Intel
- 16.14Equinix
- 16.15Digital Realty
- 16.16Vertiv
- 16.17Schneider Electric
- 16.18Supplier Facts, 2023-2026
- 17Recent Developments
- 17.1Dated Events, January 2026 to September 2026
- 18Research Methodology
- 18.1Model Inputs
- 18.2Bound Checks
- Fig. 1Education Data Center Market Size, 2020-2035
- Table 1Executive Summary Attributes
- Table 2Scope Table: In and Out of the Estimate
- Table 3Spending per MW, 2020-2035
- Table 4Market by Component, 2025 and 2035
- Table 5Market by Deployment Model, 2025 and 2035
- Table 6Market by Workload, 2025 and 2035
- Table 7Market by End User, 2025 and 2035
- Table 8Academic AI Compute Tracker, 11 Systems
- Table 9Market by Region, 2025 and 2035
- Table 10Top 12 Countries, 2025 and 2035
- Table 11Forecast Scenarios, 2035
About this report
Written by Amit Jain and reviewed by Deepti Agrawal, Senior Editor, Research. Figures are built top-down and bottom-up and reconciled before publication, with 2025 as the base year.
Read our methodologyHow we built this
- Historical period2020-2024
- Base year2025
- Forecast period2026-2035
- Sizing approachTop-down + bottom-up
Need more than the report?
Advisory on this market
Due diligence, site selection and market entry work, by the analysts who wrote this report.
See consulting servicesFrequently asked questions
USD 14.09 billion in 2026, up 11.77% from USD 12.61 billion in 2025, according to DC Market Insights estimates. The market is projected to reach USD 31.10 billion by 2035, a CAGR of 9.45% from 2025.
9.45% a year from 2025 to 2035, after 8.01% a year from 2020 to 2025, as education IT load in use rises from 2,600 MW to 5,100 MW and GPU capacity climbs from 9% to 30% of it.
USD 12.61 billion in 2025 was spent on capacity that schools, universities, research institutes and edtech providers own, colocate or rent from cloud providers for their own services: student systems, learning platforms, research HPC and AI. Student devices and learning software are not counted.
38.1% of 2025 spending, USD 4.80 billion, goes to owned sites, but colocation grows fastest at 11.55% a year. NC State moved two campus data centers to colocation and avoided about USD 20 million of refresh costs.
29,290 GPUs in 11 tracked academic systems, a DC Market Insights count: the University of Texas at Austin has more than 5,000, Isambard-AI at Bristol 5,448 GH200 chips and KISTI in Korea 8,496.
AI training and inference grows fastest at 19.38% a year to USD 9.64 billion by 2035; among end users, research institutes and supercomputing centers lead at 13.29%, and cloud infrastructure services lead components at 10.68%.
North America, with USD 4.79 billion or 38.0% of 2025 value. Asia Pacific grows fastest at 11.26% a year, and India is the fastest large country at 15.36%.
USD 59,200 to 65,500 per GPU installed, based on the Texas A&M System’s USD 45 million for 760 Hopper GPUs and the University of Florida’s USD 33 million for 504 B200 GPUs.
22 April 2026 was the compliance date of the amended U.S. COPPA Rule; FERPA governs student records, and UK schools should meet 6 core Department for Education technology standards by 2030.
USD 14.09 billion in 2026 counts only data center capacity used for education and academic research. Estimates that add edtech software, campus networks, student devices or whole national supercomputers come out several times larger.
Licences, delivery and payment
Which licence should I choose?
Single User is a view-only PDF for one person. Multi User adds a printable PDF and the Excel data for unlimited users at one location. Enterprise covers your whole company and includes 100 free analyst hours.
How and when will I receive the report?
By email, within 24–48 business hours of payment, in the formats of your licence.
How can I pay?
Securely through PayPal: with a PayPal account, a debit or credit card, or PayPal Pay Later where available. Prices are in US dollars.
Can I see a sample first?
Yes. Request a free sample and we will email it to you.
Can the report be tailored to my needs?
Yes. We can add countries, segments or data cuts. Talk to an analyst about the scope you need.
Can I get an invoice or pay against a purchase order?
Write to sales@dcmarketinsights.com and our team will help.