
Government Data Center Market Size, Share & Forecast to 2035
Market at a glance
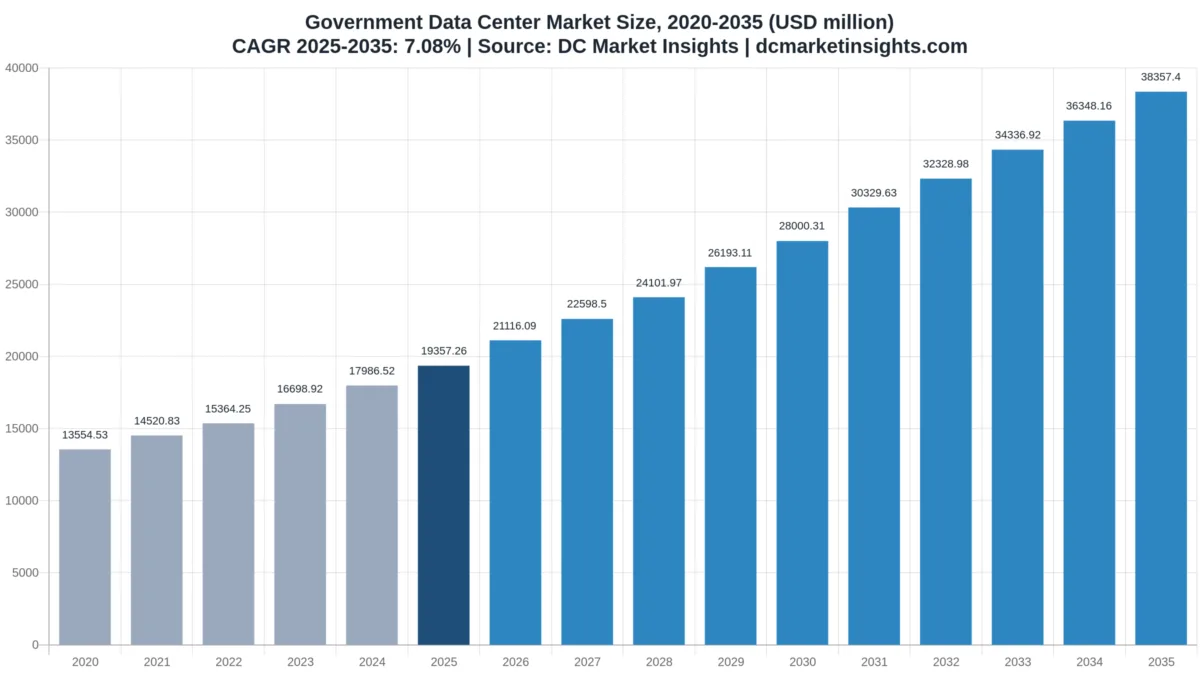
The Government Data Center market was worth USD 19.36 billion in 2025 and is forecast to reach USD 38.36 billion by 2035, growing at a 7.08% CAGR.
 By Amit Jain, Senior Consultant, ICT & Emerging Technologies
 Reviewed by Deepti Agrawal
Last updated 22 Oct 2026
Base year 2025 PDF + Excel
What is inside the report
- 01Introduction
- 02Executive Summary
- 03Market Scope
- 04Why Market Estimates Differ
- 05Market Drivers
- 06Market Trends
- 07Market Challenges and Restraints
- 08Market Opportunities
- 09Pricing Analysis
- 10Standards and Regulation
- 18chapters
- 2020-2024Historical period
- 2026-2035Forecast period
- 18Companies profiled
Segmentation
Companies profiled
- Ark Data Centres (Crown Hosting Data Centres)
- Iron Mountain Data Centers
- Equinix
- Digital Realty
- QTS Data Centers
- NTT DATA
- General Dynamics Information Technology
- Leidos
- Booz Allen Hamilton
- SAIC
- Hewlett Packard Enterprise
- Dell Technologies
- NVIDIA
- AMD
- Oracle
- Amazon Web Services
- Schneider Electric
- Vertiv
Recent developments
MOIS set a one-hour recovery target for top-grade systems, redundancy for 13 key Daejeon systems by the first half of 2027 and the move of 50 systems to private cloud (Source: Korea Policy Briefing).
DOE selected Brookfield to build a 1.8 GW AI and HPC campus at its Paducah site, with NextEra supplying power (Source: US Department of Energy).
the National Nuclear Security Administration (NNSA) selected Amentum for a 1 GW data center with about 2 GW of on-site generation at the Savannah River Site (Source: NNSA).
Japan's Digital Agency reported that 10,013 of 34,366 municipal systems (29.1%) would move to the Government Cloud after the fiscal 2025 target (Source: Digital Agency).
MOIS completed recovery of all 709 systems hit by the NIRS Daejeon fire (Source: Ministry of the Interior and Safety).
DOE announced Solstice, with 100,000 NVIDIA Blackwell GPUs, and Equinox, with 10,000 GPUs, at Argonne National Laboratory (Source: US Department of Energy).
Full analysis
The Government Data Center Market is valued at USD 21.12 billion in 2026 and is projected to reach USD 38.36 billion by 2035, up from USD 19.36 billion in 2025, a CAGR of 7.08% from 2025 to 2035 (DC Market Insights estimate). Government data center money now follows failure and sovereignty rather than closure targets: on 26 September 2025 a battery fire at South Korea’s National Information Resources Service (NIRS) in Daejeon took 709 government systems offline, and full recovery took until 30 December 2025 (Ministry of the Interior and Safety, December 2025). Saudi Arabia counted more than 400 fragmented government data centers and now lets only government-owned cloud providers build new ones, while the US Office of Management and Budget (OMB) said in 2019 that closures had reached diminishing returns. The build receipt: 4,600 megawatts (MW) of IT load in use by central, defence, state, local and research bodies in 2025 x USD 4.21 million of spending per MW = USD 19.36 billion, of which USD 14.13 billion is IT hardware and USD 3.04 billion is colocation and hosting fees. HPC and AI research computing is the fastest government data center workload at 14.46% a year, and the Middle East and Africa is the fastest region at 9.92% because Gulf states are concentrating ministries into national sovereign clouds.
Key Market Statistics: How Big Is the Government Data Center Market in 2026?
DC Market Insights puts government data center spending at USD 21.12 billion in 2026, 9.09% more than in 2025, as second sites after the Daejeon fire, national-laboratory AI systems and leased sovereign halls are added faster than agency server rooms close.
- Government data center market size 2025: USD 19.36 billion
- Market size 2026: USD 21.12 billion
- Market size 2030: USD 28.00 billion
- Market size 2035: USD 38.36 billion
- CAGR 2025-2035: 7.08% (low case 5.35%, high case 8.49%)
- Largest component: IT hardware, USD 14.13 billion or 73.0% of 2025 value
- Fastest workload: HPC and AI research computing, 14.46% a year to USD 10.87 billion by 2035
- Largest buyer level: federal and central government, USD 7.36 billion in 2025
- Leading region: North America, USD 8.52 billion or 44.0% of 2025 value; fastest region: Middle East and Africa at 9.92%
- Largest country: United States, USD 7.74 billion in 2025; fastest large country: India at 14.76%
- Market leader in leased government capacity: Ark Data Centres through Crown Hosting in the UK and Iron Mountain in the US, among five providers that hold about 27% of government colocation and hosting spending (DC Market Insights estimate)
Executive Summary: Government Data Center Market Size, 2020-2035
The Global Government Data Center Market size was valued at USD 13.55 billion in 2020, reached USD 19.36 billion in 2025, and is anticipated to reach USD 38.36 billion by 2035, at a CAGR of 7.08% during the forecast period. From 2020 to 2025 government data center spending rose 7.39% a year as pandemic-era benefit systems, defence networks and national supercomputers added load faster than consolidation removed it.
| Attribute | Value |
|---|---|
| Historical period | 2020-2024 |
| Base year | 2025 |
| Forecast period | 2026-2035 |
| Market size 2025 | USD 19.36 billion |
| Market size 2026 | USD 21.12 billion |
| CAGR 2025-2035 | 7.08% |
| Market size 2035 | USD 38.36 billion |
Government IT load in use rises from 4,600 MW in 2025 to 7,500 MW in 2035 in the DC Market Insights model, and the share of it on accelerator racks climbs from 6% to 23%. Growth stays near 7.08% a year because ministries in the UK, Singapore and Japan move citizen systems to commercial cloud, which this estimate leaves out. An AI MW carries about USD 8.1 million a year of hardware against USD 2.75 million for a conventional government MW, so national-laboratory and defence AI lift value faster than load.
What Counts as Government Data Center Spending?
The government data center market covers USD 19.36 billion of 2025 spending by central and federal ministries, defence and intelligence agencies, state, provincial and local governments and public research laboratories on data center capacity they own or lease.
Included: servers, storage, network switches and graphics processing unit (GPU) systems installed in government-owned, shared-government or colocated halls; colocation, wholesale and sovereign hosting fees (for example Crown Hosting in the UK); uninterruptible power supply (UPS) systems, switchgear, batteries, chillers and other electrical and mechanical equipment for owned sites; construction, renovation and tenant fit-out.
Excluded: public cloud services bought by agencies (including Joint Warfighting Cloud Capability task orders), government software licences, IT staff and outsourcing labour, electricity bills, and PCs and network gear outside the data center.
How the segments fit together: component, government level, workload and deployment model each split the same government data center total. Region and country values are spending where the hall sits.
Why Do Government Data Center Market Estimates Differ?
Government data center estimates differ by more than 1.5 times because broader figures add cloud and outsourcing bills, while DC Market Insights counts USD 21.12 billion in 2026 of owned and leased capacity only.
Wider definitions fold in government cloud consumption, defence cloud contracts, IT outsourcing and managed services, e-government software and even electricity for agency server rooms. Those additions can more than double the headline. They describe public-sector IT spending in general rather than data center capacity. Smaller buyers are in scope: municipalities, counties and small agencies that rent a few racks in retail colocation are counted in the USD 2.32 billion retail colocation segment, and local and municipal government holds 10.0% of 2025 value.
| Element | In this report | Why |
|---|---|---|
| IT hardware in owned, shared and leased government halls | Yes, USD 14.13 billion (2025) | Capacity the agency controls |
| Colocation, wholesale and sovereign hosting fees | Yes, USD 3.04 billion | Rent for dedicated data center capacity |
| Electrical, mechanical and construction works | Yes, USD 2.19 billion | Site spending for owned halls |
| Public cloud services, including defence cloud task orders | No | Shared hyperscale capacity, counted in cloud markets |
| Government software licences | No | Software, not capacity |
| IT outsourcing labour and electricity | No | Operating costs, not capacity |
Government Data Center Market Drivers: What Pushes Spending Up?
Three government-specific drivers add about USD 19.00 billion to annual government data center spending between 2025 and 2035: resilience rules after the Daejeon fire, sovereign hosting mandates and national-laboratory AI systems.
Daejeon NIRS Fire: 709 Systems Down and a One-Hour Recovery Target
The battery fire at the NIRS Daejeon center at about 20:15 on 26 September 2025 disrupted 709 government systems, 40 of them rated grade 1; 676 (95.3%) were back by 6 November and all 709 by 30 December 2025, according to the Ministry of the Interior and Safety (MOIS). The government then surveyed 1,459 public information-system facilities, found 56 with lithium batteries not separated to standard, set a target of service recovery within one hour after a disaster, and plans to close the Daejeon center by 2030 and relocate its 693 systems. NIRS operations carry KRW 313.4 billion in the 2026 budget. DC Market Insights expects government backup and disaster recovery capacity to grow from USD 2.32 billion in 2025 to USD 4.60 billion by 2035.
Sovereign Hosting Mandates in Saudi Arabia, the UK and Australia
Saudi Arabia’s Cloud First Policy, from the Ministry of Communications and Information Technology (MCIT), records more than 400 government data centers with low utilisation and bars civilian entities from buying or building new data center infrastructure; only government-owned cloud providers such as the National Information Center may build (MCIT Cloud First Policy). The UK’s Crown Hosting Data Centres joint venture with Ark Data Centres was renewed as a seven-year framework from October 2022 for sites at least 15 km apart, and Australia’s Hosting Certification Framework has applied to new contracts since 30 June 2022. These rules move money from scattered server rooms into shared government data centers, worth USD 2.90 billion in 2025 and USD 5.75 billion in 2035.
National-Laboratory AI and Exascale Systems
Public research and national laboratories are the fastest-growing government level at 11.17% a year, from USD 2.13 billion in 2025 to USD 6.14 billion in 2035, because each exascale or AI system brings tens of MW of new load. Oak Ridge National Laboratory needed about 40 MW of power and cooling for the Frontier data center, with a plant that can grow to 70 MW; Lawrence Livermore’s El Capitan, bought under a USD 600 million contract, was dedicated in January 2025 at 2.79 exaflops peak; and the US Department of Energy (DOE) announced in October 2025 that Argonne’s Solstice will carry 100,000 NVIDIA Blackwell GPUs, the largest AI system in its laboratory complex.
Government Data Center Market Trends: Where Is Capacity Moving?
Government data center capacity is moving out of agency basements: agency-owned sites fall from 56.0% of 2025 value to 42.0% by 2035, while wholesale and build-to-suit grows at 11.73% a year.
Federal Consolidation Hits Diminishing Returns
OMB memorandum M-19-19 of June 2019 said that after eight years of closures the US government should not expect continued dramatic savings or large-scale closures, and it asked agencies to meter power use effectiveness (PUE) for every remaining data center over 100 kilowatts (kW) (OMB M-19-19); M-21-05 extended those rules to 30 September 2022. US government data center spending still reaches USD 7.74 billion in 2025 because the remaining sites are larger and denser.
Germany and the EU Pool Ministries Into Fewer Halls
Germany’s federal IT service provider ITZBund says about 200 federal authorities keep data in several hundred data centers and server rooms, and its consolidation runs in four waves to the end of 2028; the Deutsche Verwaltungscloud, with more than 30 cloud services from nine public IT providers, went into production in 2025. The European Commission runs more than 1,400 information systems from more than 30 local data rooms in two Tier IV data centers in Luxembourg. European government data center spending grows 6.15% a year to USD 8.44 billion.
Japan’s Municipal Systems Move to the Government Cloud
Japan’s Digital Agency set fiscal 2025 as the target for moving local-government systems to standard systems on the Government Cloud, aiming for at least a 30% cost cut against fiscal 2018; at the end of March 2026, 10,013 of 34,366 systems (29.1%) had been given extended timelines (Digital Agency). Japan’s government data center spending grows only 6.15% a year to USD 1.27 billion as municipal server rooms close.
Government Data Center Market Challenges: What Holds Spending Back?
Two constraints cut about 1.73 percentage points a year from the base government data center growth path in the low case: commercial cloud mandates take load out of scope, and legacy systems absorb budgets.
Cloud First Rules Move Citizen Systems Out of Government Halls
The UK has had a Cloud First policy since 2013, mandatory for central government; Singapore’s GovTech had moved about 78% of government systems to commercial cloud by mid-2024; and the US Department of Defense awarded the Joint Warfighting Cloud Capability (JWCC) contracts to AWS, Google, Microsoft and Oracle in December 2022, each with a USD 9 billion ceiling running to June 2028 (Department of Defense contract notice). This is why citizen services and case management grow only 4.42% a year, and tax, benefits and finance systems 3.81%.
Legacy Systems Hold Budgets Before New Capacity
The UK National Audit Office (NAO) found that departments ran at least 228 legacy IT systems in March 2024, 28% of them red-rated, and lacked fully funded plans for 53% of them. Money spent keeping old estates running delays new halls, so agency-owned sites grow just 4.04% a year from USD 10.84 billion in 2025.
Government Data Center Market Opportunities: Where Is New Money?
The two largest government data center openings are wholesale and build-to-suit sovereign halls, worth USD 9.97 billion by 2035, and India’s national data center build-out, which grows 14.76% a year.
Build-to-Suit Sovereign Halls for Relocated Systems
The 693 systems leaving Daejeon by 2030, the more than 400 Saudi government data centers to be consolidated and Germany’s four ITZBund waves all need new secure halls. Wholesale and build-to-suit grows from USD 3.29 billion in 2025 to USD 9.97 billion in 2035, and retail colocation from USD 2.32 billion to USD 6.52 billion, together adding USD 10.88 billion for providers that pass national security accreditation.
India’s National Data Centres and State Data Centres
India’s National Informatics Centre (NIC) runs National Data Centres in Delhi, Pune, Hyderabad and Bhubaneswar plus 37 small state data centres; the national centres hold about 100 petabytes (PB) on around 5,000 servers, and a Tier III centre of 200 racks, expandable to 400, is being built in Guwahati (Press Information Bureau, December 2024). DC Market Insights expects India’s government data center spending to rise from USD 387.15 million in 2025 to USD 1.53 billion in 2035.
Government Data Center Pricing: What Does One MW Cost an Agency?
Government data center spending averaged USD 4.21 million per MW of IT load in 2025, up from USD 3.48 million in 2020, because AI racks and leased sovereign capacity carry higher yearly costs than an owned agency hall.
| Year | Government IT load (MW) | Leased share | Colocation and hosting rate per kW-month | IT hardware per conventional MW-year | IT hardware per AI MW-year | Total spending per MW |
|---|---|---|---|---|---|---|
| 2020 | 3,900 | 22% | USD 172 | USD 2.55 million | USD 6.60 million | USD 3.48 million |
| 2025 | 4,600 | 29% | USD 190 | USD 2.75 million | USD 8.10 million | USD 4.21 million |
| 2030 | 5,800 | 37% | USD 203 | USD 2.72 million | USD 7.20 million | USD 4.83 million |
| 2035 | 7,500 | 43% | USD 211 | USD 2.68 million | USD 6.30 million | USD 5.11 million |
Public price and size anchors: NIC’s Hyderabad National Data Centre holds 220 racks with 481 servers and 16 PB of storage; the planned Guwahati centre has 200 racks; NIRS operations cost KRW 313.4 billion in 2026; and JWCC sets a USD 9 billion ceiling per cloud provider. Frontier’s hall needed about 40 MW of power and cooling, so one exascale system equals almost 1% of 2025 government IT load. Rates rise from USD 190 to USD 211 per kW-month by 2035 in the DC Market Insights model as secure halls add liquid cooling for AI.
Standards and Regulation for Government Data Centers
Eight rules decide where government data center capacity sits and how fast it must recover, and they govern all USD 19.36 billion of 2025 spending.
US Data Center Optimization Initiative (OMB M-19-19)
M-19-19 set closure and optimisation targets and PUE metering for sites over 100 kW; M-21-05 moved its sunset to 30 September 2022.
FedRAMP Authorisation
The Federal Risk and Authorization Management Program (FedRAMP) listed 547 certified services, plus 33 under FedRAMP 20x, on its website in 2026.
NIS2 Directive
The EU’s Network and Information Security Directive (NIS2) covers central and regional public administration entities, with measures applying from 18 October 2024.
UK Government Cloud First Policy and Crown Hosting
Cloud First is mandatory for UK central government; Crown Hosting provides secure premises for government data at all security classifications.
Australia Hosting Certification Framework
The framework applies to contracts from 30 June 2022; its Strategic level is for providers that let government set ownership and control conditions, and new registrations were paused from 3 November 2025.
Saudi Arabia Cloud First Policy
Civilian government entities may not build new data center infrastructure; only government-owned cloud providers may.
South Korea Post-Fire Rules
After the NIRS fire, MOIS set a one-hour recovery target and battery-separation checks across 1,459 public facilities.
ANSI/TIA-942 and Tier Ratings
Government buyers specify redundancy with ANSI/TIA-942 rating levels; India’s Guwahati National Data Centre is specified as Tier III and the European Commission’s Luxembourg sites as Tier IV.
Government Data Center Market Segmentation: Which Segment Is Largest?
IT hardware is the largest government data center component at USD 14.13 billion in 2025, and HPC and AI research computing is the fastest workload at 14.46% a year.
By Component
Colocation and hosting services grow fastest among components, at 10.38% a year to USD 8.17 billion.
| Component | 2025 (USD million) | Share 2025 | 2035 (USD million) | CAGR 2025-2035 |
|---|---|---|---|---|
| IT Hardware | USD 14,126.60 million | 73.0% | USD 26,344.50 million | 6.43% |
| Colocation and Hosting Services | USD 3,041.52 million | 15.7% | USD 8,165.70 million | 10.38% |
| Electrical and Mechanical Infrastructure | USD 1,610.92 million | 8.3% | USD 2,673.65 million | 5.20% |
| Construction and Fit-Out | USD 578.22 million | 3.0% | USD 1,173.55 million | 7.33% |
By Government Level
Federal and central government holds 38.0% of 2025 government data center spending; public research and national laboratories grow fastest at 11.17%.
| Government Level | 2025 (USD million) | Share 2025 | 2035 (USD million) | CAGR 2025-2035 |
|---|---|---|---|---|
| Federal and Central Government | USD 7,355.76 million | 38.0% | USD 13,041.52 million | 5.89% |
| Defense and Intelligence | USD 4,645.74 million | 24.0% | USD 9,589.35 million | 7.52% |
| State and Provincial Government | USD 3,290.73 million | 17.0% | USD 6,137.18 million | 6.43% |
| Local and Municipal Government | USD 1,935.73 million | 10.0% | USD 3,452.17 million | 5.96% |
| Public Research and National Laboratories | USD 2,129.30 million | 11.0% | USD 6,137.18 million | 11.17% |
By Workload
Citizen services and case management is the largest workload at USD 5.23 billion, but HPC and AI research computing overtakes it before 2035.
| Workload | 2025 (USD million) | Share 2025 | 2035 (USD million) | CAGR 2025-2035 |
|---|---|---|---|---|
| Citizen Services and Case Management | USD 5,226.47 million | 27.0% | USD 8,055.06 million | 4.42% |
| Tax Benefits and Finance Systems | USD 2,903.59 million | 15.0% | USD 4,219.31 million | 3.81% |
| HPC and AI Research Computing | USD 2,816.48 million | 14.5% | USD 10,866.65 million | 14.46% |
| Mission and Defense Systems | USD 3,290.73 million | 17.0% | USD 6,137.18 million | 6.43% |
| Backup and Disaster Recovery | USD 2,322.87 million | 12.0% | USD 4,602.89 million | 7.08% |
| Records Archives and Other Workloads | USD 2,797.12 million | 14.4% | USD 4,476.31 million | 4.81% |
By Deployment Model
Agency-owned sites still hold 56.0% of government data center value in 2025; wholesale and build-to-suit grows fastest at 11.73%.
| Deployment Model | 2025 (USD million) | Share 2025 | 2035 (USD million) | CAGR 2025-2035 |
|---|---|---|---|---|
| Agency-Owned Sites | USD 10,840.07 million | 56.0% | USD 16,110.11 million | 4.04% |
| Shared Government Data Centers | USD 2,903.59 million | 15.0% | USD 5,753.61 million | 7.08% |
| Retail Colocation | USD 2,322.87 million | 12.0% | USD 6,520.76 million | 10.87% |
| Wholesale and Build-to-Suit | USD 3,290.73 million | 17.0% | USD 9,972.92 million | 11.73% |
DC Exclusive: Government Data Center Consolidation and Sovereign Hosting Tracker, 15 Named Programmes
The DC Market Insights Government Data Center Consolidation and Sovereign Hosting Tracker is a DC Market Insights model built on 15 inputs, one per named programme from government and company sources: 6 to shared government sites, 4 to government-owned sites, 3 to private campuses on government land, 2 to colocation.
The pattern explains the deployment split: scattered agency rooms close into shared government or sovereign sites, citizen systems leave for commercial cloud and drop out of this count, and research AI arrives as new owned capacity. DC Market Insights reads this as the agency-owned share falling from 56.0% to 42.0% by 2035.
| Government or agency | Scale | Date | From | To | Destination type |
|---|---|---|---|---|---|
| UK Cabinet Office (Crown Hosting I) | Ark 75%, government 25% | Mar 2015 | Departmental server rooms | Crown Hosting Data Centres | Colocation |
| European Commission (DIGIT) | 1,400+ systems, 30+ data rooms | Dec 2016 | Local data rooms | Two Tier IV sites in Luxembourg | Shared government site |
| Saudi Arabia (MCIT Cloud First) | 400+ government data centers | Oct 2020 | Entity-owned sites | Government-owned cloud providers only | Shared government site |
| Oak Ridge National Laboratory (Frontier) | 40 MW power and cooling, plant to 70 MW | Sep 2021 | New capacity | Own laboratory data center | Government-owned site |
| UK Crown Commercial Service (Crown Hosting II) | 3+ sites at least 15 km apart, 7 years | Oct 2022 | Crown Hosting I | Ark Data Centres | Colocation |
| Korea NIRS Daegu center | 35,675 m2 floor area | Jun 2024 | New capacity | Third national government data center | Shared government site |
| India NIC Guwahati National Data Centre | 200 racks, expandable to 400 | Dec 2024 | New capacity | Tier III national data centre | Government-owned site |
| Lawrence Livermore National Laboratory (El Capitan) | USD 600 million, 2.79 exaflops peak | Jan 2025 | New capacity | Own laboratory data center | Government-owned site |
| Germany ITZBund consolidation | About 200 federal authorities | Four waves to 2028 | Several hundred rooms | Federal shared data centers | Shared government site |
| US Department of Energy federal land sites | 4 sites: INL, Oak Ridge, Paducah, Savannah River | Jul 2025 | Federal land | Private AI campuses on leases | Private campus on government land |
| Korea NIRS Daejeon recovery | 709 systems disrupted | Sep-Dec 2025 | Daejeon center after fire | Restored, part moved to Daegu | Shared government site |
| Argonne National Laboratory (Solstice and Equinox) | 110,000 NVIDIA Blackwell GPUs | Oct 2025 | New capacity | Laboratory site, public-private | Government-owned site |
| NNSA Savannah River Site | 1 GW data center, about 2 GW generation | Jul 2026 | Federal land | Amentum-led campus | Private campus on government land |
| DOE Paducah Site | 1.8 GW AI and HPC campus | Jul 2026 | Federal land | Brookfield campus, NextEra power | Private campus on government land |
| Korea NIRS Daejeon closure | 693 systems to relocate | By 2030 | Daejeon center | Phased relocation | Shared government site |
Regional Insights: Which Region Leads the Government Data Center Market?
North America leads the government data center market with USD 8.52 billion or 44.0% of 2025 value, and the Middle East and Africa grows fastest at 9.92% a year to USD 1.99 billion.
North America
US federal, defence, state and national-laboratory halls make North America the largest region; its government data center spending rises from USD 8.52 billion to USD 15.34 billion, 6.06% a year. DOE selected four federal sites for private AI data centers in July 2025, and in July 2026 picked Brookfield for a 1.8 GW campus at Paducah and Amentum for a 1 GW data center at Savannah River; those leased campuses are counted only where agencies rent capacity in them.
Europe
NIS2 duties for public administration and German and EU consolidation keep European government data center spending growing 6.15% a year, from USD 4.65 billion in 2025.
Asia Pacific
Asia Pacific grows 8.93% a year to USD 10.93 billion, led by India at 14.76%, China at 9.05% and South Korea at 8.88% as NIRS rebuilds outside Daejeon.
Latin America
Latin America’s government data center spending rises from USD 774.29 million in 2025 to USD 1.65 billion by 2035, 7.86% a year, with Brazil at USD 271.00 million in 2025.
Middle East and Africa
The UAE’s Telecommunications and Digital Government Regulatory Authority (TDRA) hosts more than 35 federal entities on its sovereign cloud, and Saudi Arabia is consolidating more than 400 sites, lifting Middle East and Africa government data center spending from USD 774.29 million to USD 1.99 billion.
Country Analysis: Top 12 Countries in the Government Data Center Market
The United States accounts for USD 7.74 billion of 2025 government data center spending, 40.0% of the world total, while India is the fastest large country at 14.76% a year.
| Rank | Country | Region | 2025 (USD million) | 2035 (USD million) | CAGR 2025-2035 |
|---|---|---|---|---|---|
| 1 | United States | North America | USD 7,742.90 million | USD 13,808.66 million | 5.96% |
| 2 | China | Asia Pacific | USD 1,355.01 million | USD 3,222.02 million | 9.05% |
| 3 | Japan | Asia Pacific | USD 696.86 million | USD 1,265.79 million | 6.15% |
| 4 | Germany | Europe | USD 658.15 million | USD 1,189.08 million | 6.09% |
| 5 | United Kingdom | Europe | USD 638.79 million | USD 1,150.72 million | 6.06% |
| 6 | Canada | North America | USD 542.00 million | USD 1,035.65 million | 6.69% |
| 7 | France | Europe | USD 464.57 million | USD 843.86 million | 6.15% |
| 8 | South Korea | Asia Pacific | USD 425.86 million | USD 997.29 million | 8.88% |
| 9 | India | Asia Pacific | USD 387.15 million | USD 1,534.30 million | 14.76% |
| 10 | Australia | Asia Pacific | USD 329.07 million | USD 652.08 million | 7.08% |
| 11 | Saudi Arabia | Middle East and Africa | USD 271.00 million | USD 805.51 million | 11.51% |
| 12 | Brazil | Latin America | USD 271.00 million | USD 575.36 million | 7.82% |
China (USD 1.36 billion) and Japan (USD 696.86 million) follow the United States; Saudi Arabia grows 11.51% a year as its Cloud First Policy moves ministries into national sites.
Forecast Scenario Analysis: Government Data Center Market in 2035
The 2035 government data center market ranges from USD 32.60 billion in the low scenario to USD 43.73 billion in the high scenario, around a base of USD 38.36 billion.
| Scenario | 2035 (USD million) | CAGR 2025-2035 | Assumption |
|---|---|---|---|
| Low | USD 32,603.79 million | 5.35% | Faster citizen-system moves to commercial cloud; austerity delays second sites |
| Base | USD 38,357.40 million | 7.08% | Government IT load 7,500 MW in 2035, 23% on AI racks, 43% leased |
| High | USD 43,727.44 million | 8.49% | More countries copy one-hour recovery rules; sovereign AI systems built in government halls |
Competitive Insights: Key Players in the Government Data Center Market
The five largest providers hold about 27% of the USD 3.04 billion government colocation and hosting spending in 2025 (DC Market Insights estimate, based on named government contracts and campus capacity), so the government data center market is fragmented.
- Ark Data Centres (Crown Hosting Data Centres)
- Iron Mountain Data Centers
- Equinix
- Digital Realty
- QTS Data Centers
- NTT DATA
- General Dynamics Information Technology
- Leidos
- Booz Allen Hamilton
- SAIC
- Hewlett Packard Enterprise
- Dell Technologies
- NVIDIA
- AMD
- Oracle
- Amazon Web Services
- Schneider Electric
- Vertiv
Ark owns 75% of Crown Hosting Data Centres, the UK government joint venture set up in 2015, and projects 446 MW of capacity by 2030. General Dynamics reported USD 13.47 billion of 2025 revenue in its Technologies segment, which includes General Dynamics Information Technology (GDIT); Leidos reported USD 16.7 billion for 2024, Booz Allen Hamilton USD 11.2 billion and SAIC USD 7.26 billion for fiscal 2026, much of it from running agency IT estates. Hewlett Packard Enterprise built El Capitan with AMD, Dell Technologies and NVIDIA supply the Doudna system at Berkeley Lab, and Oracle partners with NVIDIA on Argonne’s Solstice. Amazon announced up to USD 50 billion for nearly 1.3 GW of AI and supercomputing capacity in its Top Secret, Secret and GovCloud regions, breaking ground in 2026; that cloud capacity sits outside this estimate but competes with agency halls. Schneider Electric and Vertiv supply power and cooling to owned sites.
Recent Developments in the Government Data Center Market
Six dated events from 2025 and 2026 show government data center demand moving toward resilient, sovereign and AI-ready capacity.
- In October 2026, MOIS set a one-hour recovery target for top-grade systems, redundancy for 13 key Daejeon systems by the first half of 2027 and the move of 50 systems to private cloud (Source: Korea Policy Briefing).
- In July 2026, DOE selected Brookfield to build a 1.8 GW AI and HPC campus at its Paducah site, with NextEra supplying power (Source: US Department of Energy).
- In July 2026, the National Nuclear Security Administration (NNSA) selected Amentum for a 1 GW data center with about 2 GW of on-site generation at the Savannah River Site (Source: NNSA).
- In March 2026, Japan’s Digital Agency reported that 10,013 of 34,366 municipal systems (29.1%) would move to the Government Cloud after the fiscal 2025 target (Source: Digital Agency).
- In December 2025, MOIS completed recovery of all 709 systems hit by the NIRS Daejeon fire (Source: Ministry of the Interior and Safety).
- In October 2025, DOE announced Solstice, with 100,000 NVIDIA Blackwell GPUs, and Equinox, with 10,000 GPUs, at Argonne National Laboratory (Source: US Department of Energy).
Research Methodology: How DC Market Insights Sized the Government Data Center Market
The government data center model multiplies 4,600 MW of government IT load in 2025 by spending per MW for each component, giving USD 19.36 billion.
Government IT load is about 10% of the roughly 46 gigawatts (GW) of enterprise and colocation capacity inside the 116 GW installed worldwide in 2025 (DC Market Insights capacity base). IT hardware = conventional MW x USD 2.75 million + AI MW (276) x USD 8.10 million = USD 14.13 billion. Colocation and hosting = 1,334 leased MW x USD 190 per kW-month x 12 = USD 3.04 billion. Owned sites add USD 1,610.92 million of electrical and mechanical work and USD 578.22 million of construction and fit-out. Splits by government level, workload, deployment model, region and country are DC Market Insights shares; every split sums to the total each year.
Bound checks: (1) the government data center market is 3.4% of the USD 570.04 billion 2025 data center market in DC Market Insights’ global model, below the BFSI vertical’s 5.9% in the BFSI Data Center Market; (2) government colocation and hosting of USD 3.04 billion is 4.1% of the USD 74.46 billion Data Center Colocation Market in 2025; (3) as a floor, Saudi Arabia’s more than 400 government data centers and India’s 41 NIC centres alone imply that government sites number in the thousands worldwide, and 3,000 sites x USD 2 million a year of minimum refresh and upkeep = USD 6.00 billion, below the USD 7.36 billion federal and central segment. Sovereign compute built for national AI programmes is covered in the Sovereign AI Infrastructure Market, and GPU halls in the AI Data Center Market. Full method: DC Market Insights research methodology.
Table of contents
- 01Introduction
- 1.1Report Description
- 1.2Key Market Statistics, 2025, 2026, 2030 and 2035
- 02Executive Summary
- 2.1Market Snapshot, 2025, 2026 and 2035
- 2.2Market Size Chart, 2020-2035
- 03Market Scope
- 3.1Included
- 3.2Excluded
- 3.3How the Segments Fit Together
- 04Why Market Estimates Differ
- 4.1Scope Table: In and Out of This Estimate
- 05Market Drivers
- 5.1Daejeon NIRS Fire: 709 Systems Down and a One-Hour Recovery Target
- 5.2Sovereign Hosting Mandates in Saudi Arabia, the UK and Australia
- 5.3National-Laboratory AI and Exascale Systems
- 06Market Trends
- 6.1Federal Consolidation Hits Diminishing Returns
- 6.2Germany and the EU Pool Ministries Into Fewer Halls
- 6.3Japan's Municipal Systems Move to the Government Cloud
- 07Market Challenges and Restraints
- 7.1Cloud First Rules Move Citizen Systems Out of Government Halls
- 7.2Legacy Systems Hold Budgets Before New Capacity
- 08Market Opportunities
- 8.1Build-to-Suit Sovereign Halls for Relocated Systems
- 8.2India's National Data Centres and State Data Centres
- 09Pricing Analysis
- 9.1Spending per MW, 2020-2035
- 9.2Public Price and Size Anchors
- 10Standards and Regulation
- 10.1US Data Center Optimization Initiative (OMB M-19-19)
- 10.2FedRAMP Authorisation
- 10.3NIS2 Directive
- 10.4UK Government Cloud First Policy and Crown Hosting
- 10.5Australia Hosting Certification Framework
- 10.6Saudi Arabia Cloud First Policy
- 10.7South Korea Post-Fire Rules
- 10.8ANSI/TIA-942 and Tier Ratings
- 11Market Segmentation
- 11.1By Component
- 11.2IT Hardware
- 11.3Colocation and Hosting Services
- 11.4Electrical and Mechanical Infrastructure
- 11.5Construction and Fit-Out
- 11.6By Government Level
- 11.7Federal and Central Government
- 11.8Defense and Intelligence
- 11.9State and Provincial Government
- 11.10Local and Municipal Government
- 11.11Public Research and National Laboratories
- 11.12By Workload
- 11.13Citizen Services and Case Management
- 11.14Tax Benefits and Finance Systems
- 11.15HPC and AI Research Computing
- 11.16Mission and Defense Systems
- 11.17Backup and Disaster Recovery
- 11.18Records Archives and Other Workloads
- 11.19By Deployment Model
- 11.20Agency-Owned Sites
- 11.21Shared Government Data Centers
- 11.22Retail Colocation
- 11.23Wholesale and Build-to-Suit
- 12DC Exclusive: Government Data Center Consolidation and Sovereign Hosting Tracker
- 12.1UK Cabinet Office (Crown Hosting I)
- 12.2European Commission (DIGIT)
- 12.3Saudi Arabia (MCIT Cloud First)
- 12.4Oak Ridge National Laboratory (Frontier)
- 12.5UK Crown Commercial Service (Crown Hosting II)
- 12.6Korea NIRS Daegu center
- 12.7India NIC Guwahati National Data Centre
- 12.8Lawrence Livermore National Laboratory (El Capitan)
- 12.9Germany ITZBund consolidation
- 12.10US Department of Energy federal land sites
- 12.11Korea NIRS Daejeon recovery
- 12.12Argonne National Laboratory (Solstice and Equinox)
- 12.13NNSA Savannah River Site
- 12.14DOE Paducah Site
- 12.15Korea NIRS Daejeon closure
- 13Regional Insights
- 13.1North America
- 13.2Europe
- 13.3Asia Pacific
- 13.4Latin America
- 13.5Middle East and Africa
- 14Country Analysis
- 14.1United States
- 14.2China
- 14.3Japan
- 14.4Germany
- 14.5United Kingdom
- 14.6Canada
- 14.7France
- 14.8South Korea
- 14.9India
- 14.10Australia
- 14.11Saudi Arabia
- 14.12Brazil
- 15Forecast Scenarios, 2035
- 15.1Low Scenario
- 15.2Base Scenario
- 15.3High Scenario
- 16Competitive Insights
- 16.1Ark Data Centres (Crown Hosting Data Centres)
- 16.2Iron Mountain Data Centers
- 16.3Equinix
- 16.4Digital Realty
- 16.5QTS Data Centers
- 16.6NTT DATA
- 16.7General Dynamics Information Technology
- 16.8Leidos
- 16.9Booz Allen Hamilton
- 16.10SAIC
- 16.11Hewlett Packard Enterprise
- 16.12Dell Technologies
- 16.13NVIDIA
- 16.14AMD
- 16.15Oracle
- 16.16Amazon Web Services
- 16.17Schneider Electric
- 16.18Vertiv
- 16.19Colocation Concentration, 2025
- 17Recent Developments
- 17.1MOIS One-Hour Recovery Plan, October 2026
- 17.2DOE Paducah 1.8 GW Campus, July 2026
- 17.3NNSA Savannah River 1 GW Data Center, July 2026
- 17.4Japan Government Cloud Migration Status, March 2026
- 17.5NIRS Recovery of 709 Systems, December 2025
- 17.6Argonne Solstice and Equinox, October 2025
- 18Research Methodology
- 18.1Model Inputs
- 18.2Bound Checks
- Fig. 1Government Data Center Market Size, 2020-2035 (USD million)
- Table 1Market Snapshot, 2025, 2026 and 2035
- Table 2Scope Table: In and Out of This Estimate
- Table 3Spending per MW, 2020-2035
- Table 4Market by Component, 2025 and 2035
- Table 5Market by Government Level, 2025 and 2035
- Table 6Market by Workload, 2025 and 2035
- Table 7Market by Deployment Model, 2025 and 2035
- Table 8Government Data Center Consolidation and Sovereign Hosting Tracker, 2015-2030
- Table 9Top 12 Countries, 2025 and 2035
- Table 102035 Forecast Scenarios
About this report
Written by Amit Jain and reviewed by Deepti Agrawal, Senior Editor, Research. Figures are built top-down and bottom-up and reconciled before publication, with 2025 as the base year.
Read our methodologyHow we built this
- Historical period2020-2024
- Base year2025
- Forecast period2026-2035
- Sizing approachTop-down + bottom-up
Need more than the report?
Advisory on this market
Due diligence, site selection and market entry work, by the analysts who wrote this report.
See consulting servicesFrequently asked questions
USD 21.12 billion in 2026, up 9.09% from USD 19.36 billion in 2025, according to DC Market Insights estimates. The market is projected to reach USD 38.36 billion by 2035, a CAGR of 7.08% from 2025.
7.08% a year from 2025 to 2035, after 7.39% a year from 2020 to 2025, as government IT load in use rises from 4,600 MW to 7,500 MW and the AI rack share climbs from 6% to 23%.
A battery fire at the NIRS Daejeon center on 26 September 2025 disrupted 709 government systems; all were restored by 30 December 2025, and the government plans to close Daejeon by 2030 and relocate 693 systems.
Yes, but more slowly: OMB said in 2019 that US closures had reached diminishing returns. Agency-owned sites fall from 56.0% of 2025 value to 42.0% by 2035 as Germany, Saudi Arabia and the UK pool systems into shared sites.
Public research and national laboratories grow 11.17% a year to USD 6.14 billion by 2035. Frontier’s hall needed about 40 MW, and Argonne’s Solstice will carry 100,000 NVIDIA Blackwell GPUs.
HPC and AI research computing grows fastest at 14.46% a year to USD 10.87 billion by 2035; among deployment models, wholesale and build-to-suit leads at 11.73%.
North America, with USD 8.52 billion or 44.0% of 2025 value. The Middle East and Africa grows fastest at 9.92% a year, and India is the fastest large country at 14.76%.
No. Saudi Arabia’s Cloud First Policy bars civilian government entities from buying or building new data center infrastructure; only government-owned cloud providers such as the National Information Center may build them.
Ark Data Centres (through Crown Hosting), Iron Mountain, Equinix, Digital Realty and QTS lead leased government capacity, holding about 27% of USD 3.04 billion in government colocation and hosting spending in 2025 (DC Market Insights estimate).
USD 21.12 billion in 2026 counts only owned and leased data center capacity. Estimates that add government cloud services, defence cloud contracts, IT outsourcing or electricity come out larger.
Licences, delivery and payment
Which licence should I choose?
Single User is a view-only PDF for one person. Multi User adds a printable PDF and the Excel data for unlimited users at one location. Enterprise covers your whole company and includes 100 free analyst hours.
How and when will I receive the report?
By email, within 24–48 business hours of payment, in the formats of your licence.
How can I pay?
Securely through PayPal: with a PayPal account, a debit or credit card, or PayPal Pay Later where available. Prices are in US dollars.
Can I see a sample first?
Yes. Request a free sample and we will email it to you.
Can the report be tailored to my needs?
Yes. We can add countries, segments or data cuts. Talk to an analyst about the scope you need.
Can I get an invoice or pay against a purchase order?
Write to sales@dcmarketinsights.com and our team will help.