
Media and Entertainment Data Center Market Size, Share & Forecast to 2035
Market at a glance
The Media and Entertainment Data Center market was worth USD 11.66 billion in 2025 and is forecast to reach USD 27.57 billion by 2035, growing at a 8.99% CAGR.
 By Amit Jain, Senior Consultant, ICT & Emerging Technologies
 Reviewed by Deepti Agrawal
Last updated 29 Oct 2026
Base year 2025 PDF + Excel
Key findings
Roblox Doubles Peak Players and Adds USD 186.3 Million of Infrastructure Cost
Spotify, Weta FX and Netflix Show the All-Cloud Model
GPU Rendering and Virtual Production
What is inside the report
- 01Introduction
- 02Executive Summary
- 03Market Scope
- 04Why Market Estimates Differ
- 05Market Drivers
- 06Market Trends
- 07Market Challenges and Restraints
- 08Market Opportunities
- 09Pricing Analysis
- 10Standards and Regulation
- 18chapters
- 2020-2024Historical period
- 2026-2035Forecast period
- —Companies profiled
Segmentation
Recent developments
NVIDIA announced a new RTX 5080-powered GeForce NOW server in Toronto (Source: NVIDIA)
Roblox reported more than 400 AI models running at over 1.5 million inferences per second (Source: Roblox)
the European Broadcasting Union published version 2.0 of its Dynamic Media Facility reference architecture (Source: European Broadcasting Union)
Netflix reported USD 45.2 billion of 2025 revenue and more than 325 million paid memberships (Source: Netflix)
Xbox Cloud Gaming launched in India, reaching 29 countries (Source: Microsoft)
Roblox peak concurrent players reached 30.6 million, more than double April's 13.9 million (Source: Roblox)
Full analysis
The Media and Entertainment Data Center Market is valued at USD 13.08 billion in 2026 and is projected to reach USD 27.57 billion by 2035, up from USD 11.66 billion in 2025, a CAGR of 8.99% from 2025 to 2035 (DC Market Insights estimate). What sets the money apart in this market is the own-or-rent split between the two largest buyer groups: Roblox runs more than 150,000 servers in 25 regional data centers it manages itself (Roblox annual report on Form 10-K, February 2026), while Netflix runs the vast majority of its computing on Amazon Web Services (AWS) and delivers video from its own Open Connect caches (Netflix annual report on Form 10-K, January 2026). That split puts 49.7% of 2025 spending, USD 5.79 billion, into public cloud bills rather than owned halls. The 2025 value rests on 2,300 megawatts (MW) of information technology (IT) load that media companies use x USD 5.07 million of yearly spending per MW = USD 11.66 billion. AI and recommendation is the fastest workload at 19.98% a year, because studios, streamers and game platforms now run inference on every title and every session; Asia Pacific is the fastest region at 10.99%, led by game platforms in China, South Korea and India.
Key Market Statistics: How Big Is the Media and Entertainment Data Center Market in 2026?
DC Market Insights values media and entertainment data center spending at USD 13.08 billion in 2026, 12.14% above 2025, as game platforms add servers for record player peaks and streamers add AI inference to cloud bills.
- Media and entertainment data center market size 2025: USD 11.66 billion
- Market size 2026: USD 13.08 billion
- Market size 2030: USD 19.10 billion
- Market size 2035: USD 27.57 billion
- CAGR 2025-2035: 8.99% (low case 7.13%, high case 10.49%)
- Largest component: cloud infrastructure services, USD 5.79 billion or 49.7% of 2025 value
- Fastest workload: AI and recommendation, 19.98% a year to USD 10.73 billion by 2035
- Largest end user: video games and interactive entertainment, USD 3.62 billion in 2025; fastest: film and TV production and visual effects (VFX) at 11.88%
- Leading region: North America, USD 4.55 billion or 39.0% of 2025 value; fastest region: Asia Pacific at 10.99%
- Largest country: United States, USD 3.85 billion in 2025; fastest large country: India at 14.70%
- Market leaders: Amazon Web Services, Google Cloud and Microsoft Azure in hosted capacity, with Dell Technologies, Hewlett Packard Enterprise, Supermicro and NVIDIA in owned servers (DC Market Insights assessment)
Executive Summary: Media and Entertainment Data Center Market Size, 2020-2035
The Global Media and Entertainment Data Center Market size was valued at USD 7.50 billion in 2020, reached USD 11.66 billion in 2025, and is anticipated to reach USD 27.57 billion by 2035, at a CAGR of 8.99% during the forecast period. Growth was 9.23% a year from 2020 to 2025, when streaming services scaled to hundreds of millions of members and game platforms moved to always-online play; from 2025 the mix shifts towards GPU capacity, which costs about 2.5 times more per MW-year than conventional servers.
| Attribute | Value |
|---|---|
| Historical period | 2020-2024 |
| Base year | 2025 |
| Forecast period | 2026-2035 |
| Market size 2025 | USD 11.66 billion |
| Market size 2026 | USD 13.08 billion |
| CAGR 2025-2035 | 8.99% |
| Market size 2035 | USD 27.57 billion |
| Segments covered | Component, deployment model, workload, end user, region, 12 countries |
Owned media data centers grow only 6.32% a year to USD 7.28 billion in 2035, while public cloud spending rises to USD 15.64 billion and colocation to USD 4.65 billion. The chart shows the DC Market Insights series year by year.
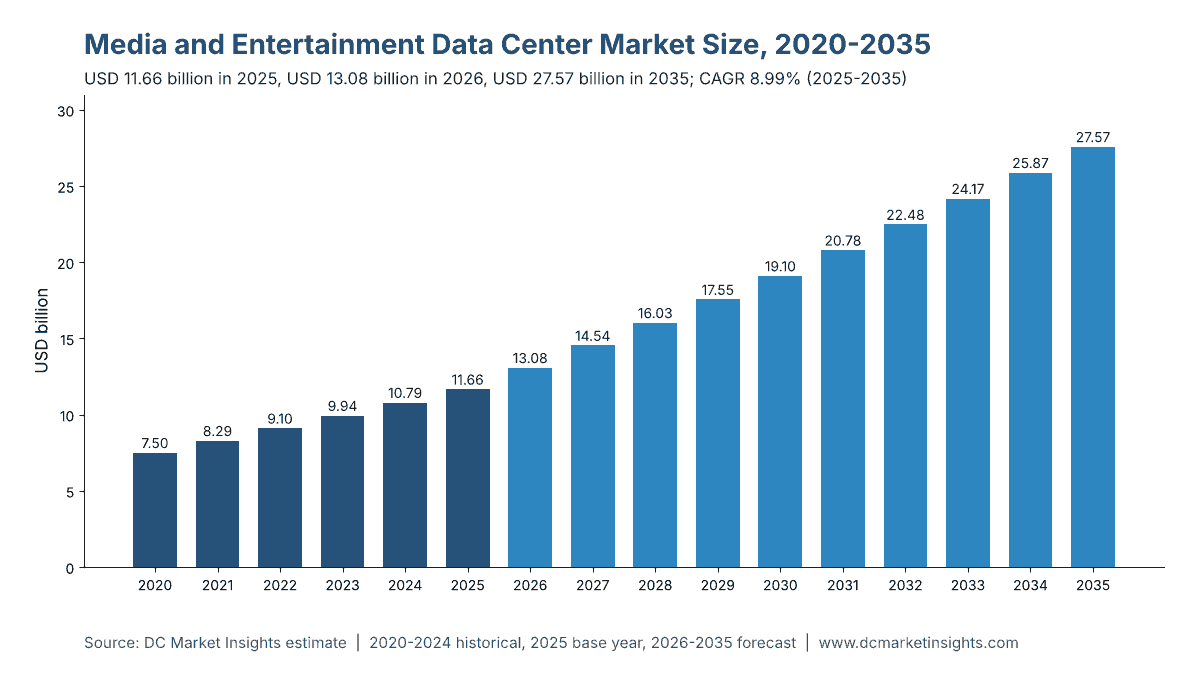
Which Data Centers Count in the Media and Entertainment Market?
USD 11.66 billion in 2025: the data center capacity that streaming services, broadcasters, film and TV studios, VFX and animation houses, game publishers and platforms, music services and publishers own, colocate or rent from cloud providers to run their own services.
Included: public cloud infrastructure that media companies pay for (USD 5.79 billion); servers, storage and networking in owned and colocated sites (USD 4.20 billion); colocation and edge hosting fees (USD 839.04 million); power and cooling equipment in owned sites (USD 529.00 million); and construction and fit-out (USD 299.00 million). Content delivery caches placed inside internet service provider (ISP) networks, game servers, render farms, playout and transcoding systems, recommendation engines and corporate IT all count.
Excluded: social networks and search platforms whose video services sit inside hyperscale fleets, advertising technology, cinema projection and set-top boxes, consumer devices, the telecom networks that carry the traffic, and content production spending that is not computing.
How the segments fit together: every split (component, deployment model, workload, end user, region) sums to USD 11.66 billion in 2025 and USD 27.57 billion in 2035. The model counts 2,300 MW in use in 2025: 1,058 MW owned, 368 MW colocated and 874 MW in public cloud, of which 161 MW is GPU capacity and 506 MW sits at edge sites close to viewers and players.
Why Do Media and Entertainment Data Center Market Estimates Differ?
Published figures differ by several times because some studies add the hyperscale video fleets of social and search platforms; the DC Market Insights value of USD 13.08 billion in 2026 covers only media companies’ own computing.
Broader definitions add three things. First, the video capacity of platforms such as YouTube inside Google’s fleet or short-video apps inside social networks, which would multiply the total because those fleets are built for advertising businesses. Second, the content delivery network (CDN) capacity that providers such as Akamai sell to all industries, not only media. Third, total media technology spending, including software licences, cameras and broadcast equipment. Some studies also count telecom IPTV platforms, which DC Market Insights places in the Telecom Data Center Market report. Small and mid-sized publishers, regional broadcasters and independent game studios are in scope, mostly through cloud spending.
| Element | In the DC Market Insights estimate | Why |
|---|---|---|
| Public cloud capacity rented by media companies | Yes, USD 5.79 billion (2025) | Capacity the company pays for |
| Servers, storage and networking in owned or colocated sites | Yes, USD 4.20 billion | Capacity the company buys and runs |
| Colocation, power, cooling and construction | Yes, USD 1.67 billion | Facility layer of that capacity |
| Video fleets of social and search platforms | No | Built for advertising businesses |
| CDN capacity sold to all industries | No, unless run by a media company | Belongs to network services |
| Broadcast equipment, cameras, software licences | No | Not data center capacity |
Market Drivers: Why Are Media Companies Buying More Data Center Capacity?
Three drivers lift spending from USD 11.66 billion in 2025 to USD 19.10 billion in 2030: game-platform peaks, streaming scale with its delivery traffic, and AI inference on content and sessions.
Roblox Doubles Peak Players and Adds USD 186.3 Million of Infrastructure Cost
Roblox’s peak concurrent players rose from 13.9 million in April 2025 to 30.6 million in June 2025 (Roblox, June 2025), and the company plans server capacity about two years ahead. Its infrastructure and trust and safety expense rose 26% to USD 1.15 billion in 2025, with USD 186.3 million of the increase from data center and technical infrastructure, and its spending on property and equipment rose from USD 179.6 million to USD 441.0 million (Roblox, February 2026). DC Market Insights puts game servers and live services at USD 2.68 billion in 2025.
325 Million Netflix Memberships and 56 Tbit/s of French ISP Traffic
Netflix passed 325 million paid memberships and USD 45.2 billion of revenue in 2025 (Netflix, January 2026). Delivery load follows viewing: incoming traffic to France’s four main ISPs reached 56 terabits per second (Tbit/s) at the end of 2025, up from 50.8 Tbit/s, and Netflix alone carried 11.6% of it (Arcep, July 2026). The International Telecommunication Union (ITU) estimates 7.3 zettabytes of fixed and 1.5 zettabytes of mobile traffic worldwide in 2025 (ITU, October 2025). Content delivery and edge caching reaches USD 2.58 billion in 2025 in the DC Market Insights model.
400 AI Models at Roblox Show Inference Moving into Every Session
Roblox operates more than 400 AI models at over 1.5 million inferences per second on on-premise and public cloud graphics processing units (GPUs) (Roblox, May 2026), covering safety, translation and recommendations. Streamers use the same pattern for ranking, artwork and ad targeting. AI and recommendation spending rises from USD 1.74 billion in 2025 to USD 10.73 billion in 2035, and GPU capacity from 161 MW to 1,157 MW.
Market Trends: How Are Media Companies Changing Where They Compute?
Media companies are renting more and owning less: public cloud grows 10.44% a year, while owned sites grow 6.32%.
Spotify, Weta FX and Netflix Show the All-Cloud Model
Spotify closed the first of its four data centers in December 2017 and the rest in 2018 (Spotify, December 2019), and now relies on Google Cloud Platform for the vast majority of its primary storage (Spotify, February 2026). Weta Digital, now Weta FX, moved most of its IT including rendering to AWS in 2020 (Weta FX, September 2020). Netflix keeps its compute on AWS but owns its delivery caches. These choices explain why cloud infrastructure services are 49.7% of 2025 value.
Broadcasters Move Playout onto IP and Shared Clusters
SMPTE ST 2110 replaced serial digital interface (SDI) cabling with managed IP networks for live video (SMPTE), and the European Broadcasting Union (EBU) Dynamic Media Facility reference architecture version 2.0 of April 2026 runs media functions on generic hosts in shared data center clusters or the cloud (EBU, April 2026). Media processing and playout still grows only 3.10% a year because shared clusters need fewer servers than dedicated chains.
Cloud Gaming Adds GPU Regions
Xbox Cloud Gaming reached 29 countries with its India launch in November 2025, and cloud gaming hours rose 45% year on year (Microsoft, November 2025). NVIDIA had almost finished moving GeForce NOW to RTX 5080-class servers by November 2025, with Stockholm the last region (NVIDIA, November 2025). Each region is a GPU hall close to players, which keeps edge sites at 22% of media MW in 2025 and 27% by 2035.
Market Challenges and Restraints: What Holds Back Media Data Center Spending?
Two limits keep growth at 8.99% a year: flat linear TV budgets and energy reporting on European sites.
Broadcast Viewing Falls 4% a Year in the UK
UK viewers watched 4 hours 30 minutes of TV and video a day at home in 2024; broadcast TV still held 56% of it, but broadcast viewing fell 4% to 2 hours 24 minutes (Ofcom Media Nations, July 2025). Broadcasters cut playout and distribution budgets as viewing moves to streaming, so broadcasting and pay-TV grows only 4.66% a year and its share falls from 15% in 2025 to 10% in 2035.
EU Energy Reporting Adds Cost to Owned Sites
European data centers used 68 terawatt-hours (TWh) in 2024 and are projected to use 114 TWh, 3.2% of EU electricity demand, by 2030, according to the European Commission’s draft rating scheme of September 2026, which sets labels from 15 August 2027 (European Commission, September 2026). Media companies with owned sites of 500 kW or more must report energy and water data each year, which tilts new capacity towards cloud and colocation; owned-site electrical and mechanical spending grows only 4.37% a year.
Market Opportunities: Where Is the New Media Computing Demand?
The two largest new pools are GPU capacity for AI and rendering, and edge capacity for games and delivery, together worth USD 12.58 billion in 2035 for AI and rendering alone.
GPU Rendering and Virtual Production
Industrial Light and Magic (ILM) runs five permanent StageCraft LED volumes, three in Los Angeles, one at Pinewood in London and one in Vancouver (ILM, November 2021), and each volume renders scenes in real time on GPU clusters. Film and TV production and VFX is the fastest end user at 11.88% a year, from USD 1.17 billion in 2025 to USD 3.58 billion in 2035.
Edge Sites for Games and Delivery
Media edge capacity grows from 506 MW in 2025 to about 1,202 MW in 2035 in the DC Market Insights model, as game platforms such as Roblox, which runs 24 edge data centers plus two core sites (Roblox, June 2025), place servers within milliseconds of players. Hardware for these sites overlaps with the Edge Server Market report.
How Much Does a Media Company Spend per MW of Data Center Capacity?
USD 5.07 million per MW in use in 2025, DC Market Insights estimates, rising to USD 6.20 million by 2035 as GPU capacity and cloud bills lift spending per MW.
| Year | IT load in use (MW) | Total spending per MW | Cloud rate, conventional (USD per kW-month) | Colocation rate (USD per kW-month) |
|---|---|---|---|---|
| 2020 | 1,750 | USD 4.29 million | USD 526 | USD 181 |
| 2025 | 2,300 | USD 5.07 million | USD 500 | USD 190 |
| 2030 | 3,250 | USD 5.88 million | USD 475 | USD 200 |
| 2035 | 4,450 | USD 6.20 million | USD 452 | USD 210 |
Public anchors: Roblox spent USD 441.0 million on property and equipment in 2025 and Netflix USD 688.2 million (company 10-K filings, 2026). In the DC Market Insights model a media company pays about USD 500 per kW-month for conventional cloud capacity in 2025 and USD 1,250 for GPU capacity, against USD 190 for colocation space and power, which is why companies that run steady loads, such as Roblox, keep them in owned halls.
Which Rules and Standards Shape Media Data Centers?
At least seven named rules and standards decide where media companies place and how they run their computing, across all USD 11.66 billion of 2025 spending.
- EU Data Act, Regulation (EU) 2023/2854: applies from 12 September 2025; cloud switching charges are abolished three years after entry into force, from January 2027 (Source: European Union)
- Commission Delegated Regulation (EU) 2024/1364: data centers of 500 kW and more report energy and water indicators, first by 15 September 2024, then each 15 May (Source: European Commission)
- EU data center rating scheme, draft C(2026) 3472: labels due by 15 August 2027 (Source: European Commission)
- EU AI Act: obligations for general-purpose AI models, including a copyright policy, apply from 2 August 2025 (Source: European Commission)
- SMPTE ST 2110: professional media over managed IP networks (Source: Society of Motion Picture and Television Engineers)
- EBU Dynamic Media Facility Reference Architecture v2.0, April 2026 (Source: European Broadcasting Union)
- FCC NextGen TV (ATSC 3.0) proposal of October 2025 to drop the ATSC 1.0 simulcast requirement (Source: Federal Communications Commission)
Media and Entertainment Data Center Market Segmentation: Which Segment Spends Most?
The largest component is cloud infrastructure services at USD 5.79 billion in 2025, video games and interactive entertainment the largest end user at USD 3.62 billion, and game servers and live services the largest workload at USD 2.68 billion.
By Component
Cloud infrastructure services hold 49.7% of 2025 value and grow fastest at 10.44% a year.
| Component | 2025 (USD million) | Share 2025 | 2035 (USD million) | CAGR 2025-2035 |
|---|---|---|---|---|
| Cloud Infrastructure Services | USD 5,794.62 million | 49.7% | USD 15,640.06 million | 10.44% |
| IT Hardware | USD 4,200.28 million | 36.0% | USD 8,749.40 million | 7.61% |
| Colocation Services | USD 839.04 million | 7.2% | USD 1,793.20 million | 7.89% |
| Electrical and Mechanical Infrastructure | USD 529.00 million | 4.5% | USD 811.07 million | 4.37% |
| Construction and Fit-Out | USD 299.00 million | 2.6% | USD 578.50 million | 6.82% |
By Deployment Model
Owned data centers hold 33.8% of 2025 value; colocation grows 9.23% a year as game platforms rent edge space.
| Deployment Model | 2025 (USD million) | Share 2025 | 2035 (USD million) | CAGR 2025-2035 |
|---|---|---|---|---|
| Public Cloud | USD 5,794.62 million | 49.7% | USD 15,640.06 million | 10.44% |
| Owned Data Centers | USD 3,944.34 million | 33.8% | USD 7,282.02 million | 6.32% |
| Colocation | USD 1,922.98 million | 16.5% | USD 4,650.15 million | 9.23% |
By Workload
AI and recommendation grows fastest at 19.98% a year and becomes the largest workload by 2035.
| Workload | 2025 (USD million) | Share 2025 | 2035 (USD million) | CAGR 2025-2035 |
|---|---|---|---|---|
| Game Servers and Live Services | USD 2,679.94 million | 23.0% | USD 5,220.69 million | 6.90% |
| Content Delivery and Edge Caching | USD 2,580.69 million | 22.1% | USD 4,547.05 million | 5.83% |
| Media Processing and Playout | USD 1,985.14 million | 17.0% | USD 2,694.55 million | 3.10% |
| AI and Recommendation | USD 1,736.22 million | 14.9% | USD 10,731.29 million | 19.98% |
| Corporate IT and Rights Management | USD 1,687.37 million | 14.5% | USD 2,526.14 million | 4.12% |
| Rendering and Post-Production | USD 992.57 million | 8.5% | USD 1,852.50 million | 6.44% |
By End User
Video games and interactive entertainment spend USD 3.62 billion in 2025, ahead of video streaming services at USD 3.50 billion; film and TV production and VFX grows fastest.
| End User | 2025 (USD million) | Share 2025 | 2035 (USD million) | CAGR 2025-2035 |
|---|---|---|---|---|
| Video Games and Interactive Entertainment | USD 3,615.20 million | 31.0% | USD 9,650.28 million | 10.32% |
| Video Streaming Services | USD 3,498.58 million | 30.0% | USD 7,995.94 million | 8.62% |
| Broadcasting and Pay-TV | USD 1,749.29 million | 15.0% | USD 2,757.22 million | 4.66% |
| Film and TV Production and VFX | USD 1,166.19 million | 10.0% | USD 3,584.39 million | 11.88% |
| Publishing and Digital Media | USD 932.96 million | 8.0% | USD 1,930.06 million | 7.54% |
| Music and Audio Streaming | USD 699.72 million | 6.0% | USD 1,654.33 million | 8.99% |
DC Exclusive: Media Own-or-Rent Map, 8 Companies from 150,000 Owned Servers to All-Cloud
This DC Market Insights model maps how 8 named media companies split their computing between owned, edge and cloud capacity, built on 12 inputs from company filings and company pages. It shows that steady, latency-sensitive loads (game servers, delivery caches) stay owned, while bursty loads (rendering, analytics, storage) go to the cloud.
| Company | Owned or edge capacity | Cloud use | Source date |
|---|---|---|---|
| Roblox | 150,000+ servers, 25 regional data centers; 24 edge + 2 core sites; 8 U.S. states and 11 countries | AWS for some storage and bursting | Feb 2026 |
| Netflix | Open Connect: 18,000 servers in 6,000 locations, 175 countries | Vast majority of computing on AWS | Jan 2026 / Dec 2022 |
| Spotify | None since 2018 (4 data centers closed) | Google Cloud for the vast majority of primary storage | Feb 2026 |
| Weta FX | Most IT moved out in 2020 | All-in on AWS, incl. rendering | Sep 2020 |
| Microsoft (Xbox Cloud Gaming) | Expanded in-region server capacity; 29 countries | Not disclosed | Nov 2025 |
| NVIDIA (GeForce NOW) | RTX 5080-class servers in each region; Toronto added | Own service | Jul 2026 |
| Industrial Light and Magic | 5 StageCraft LED volumes with GPU render clusters | Not disclosed | Nov 2021 |
| Electronic Arts | Company data centers; some critical applications in only one site | Not disclosed | May 2026 |
Reading the map: the companies that own the most capacity run interactive or delivery loads where every millisecond counts; the all-cloud companies run catalogues, storage and batch work. DC Market Insights expects public cloud to rise from 38% of media MW in 2025 to 51% in 2035 as AI inference moves to rented GPUs.
Which Region Leads the Media and Entertainment Data Center Market?
North America leads with USD 4.55 billion, 39.0% of 2025 value, and Asia Pacific grows fastest at 10.99% a year to USD 9.93 billion by 2035.
| Region | 2025 (USD million) | Share 2025 | 2035 (USD million) | CAGR 2025-2035 |
|---|---|---|---|---|
| North America | USD 4,548.16 million | 39.0% | USD 9,374.56 million | 7.50% |
| Asia Pacific | USD 3,498.58 million | 30.0% | USD 9,926.00 million | 10.99% |
| Europe | USD 2,565.63 million | 22.0% | USD 5,459.30 million | 7.84% |
| Latin America | USD 583.10 million | 5.0% | USD 1,599.19 million | 10.62% |
| Middle East and Africa | USD 466.48 million | 4.0% | USD 1,213.18 million | 10.03% |
North America
North America spends USD 4.55 billion in 2025 and grows 7.50% a year. Roblox runs data centers in eight U.S. states, from Virginia to Washington (Roblox, February 2026), and most large streamers are headquartered here.
Asia Pacific
Asia Pacific spends USD 3.50 billion in 2025 and grows 10.99% a year, the fastest region. India had 1,092.79 million internet subscribers at the end of March 2026, using 25.51 GB of wireless data per subscriber each month (Telecom Regulatory Authority of India, October 2026).
Europe
Europe spends USD 2.57 billion in 2025 and grows 7.84% a year. Its audiovisual market generated about EUR 142 billion in 2024, and U.S. players took more than 80% of subscription video on demand (SVOD) and in-video online advertising revenues (European Audiovisual Observatory, 2026); the UK commercial TV and online video market passed GBP 18 billion in 2025 (Ofcom, July 2026).
Latin America
Latin America spends USD 583.10 million in 2025 and grows 10.62% a year, led by Brazil, where Xbox Cloud Gaming expanded in November 2025 (Microsoft, November 2025).
Middle East and Africa
Middle East and Africa spends USD 466.48 million in 2025 and grows 10.03% a year; Saudi Arabia is the largest country in the region at USD 116.62 million.
Top 12 Countries in the Media and Entertainment Data Center Market
The United States is the largest country at USD 3.85 billion in 2025, 33.0% of the global total; India is the fastest large country at 14.70% a year.
| Rank | Country | Region | 2025 (USD million) | Share 2025 | 2035 (USD million) | CAGR 2025-2035 |
|---|---|---|---|---|---|---|
| 1 | United States | North America | USD 3,848.44 million | 33.0% | USD 8,133.81 million | 7.77% |
| 2 | China | Asia Pacific | USD 1,516.05 million | 13.0% | USD 3,860.11 million | 9.80% |
| 3 | Japan | Asia Pacific | USD 583.10 million | 5.0% | USD 1,268.32 million | 8.08% |
| 4 | United Kingdom | Europe | USD 524.79 million | 4.5% | USD 1,102.89 million | 7.71% |
| 5 | South Korea | Asia Pacific | USD 466.48 million | 4.0% | USD 1,158.03 million | 9.52% |
| 6 | Germany | Europe | USD 408.17 million | 3.5% | USD 909.88 million | 8.35% |
| 7 | India | Asia Pacific | USD 349.86 million | 3.0% | USD 1,378.61 million | 14.70% |
| 8 | France | Europe | USD 326.53 million | 2.8% | USD 716.88 million | 8.18% |
| 9 | Canada | North America | USD 326.53 million | 2.8% | USD 744.45 million | 8.59% |
| 10 | Brazil | Latin America | USD 279.89 million | 2.4% | USD 799.59 million | 11.07% |
| 11 | Australia | Asia Pacific | USD 209.91 million | 1.8% | USD 496.30 million | 8.99% |
| 12 | Saudi Arabia | Middle East and Africa | USD 116.62 million | 1.0% | USD 441.16 million | 14.23% |
Forecast Scenarios: How Large Could the Media and Entertainment Data Center Market Be in 2035?
Between USD 23.22 billion and USD 31.63 billion in 2035, with USD 27.57 billion as the DC Market Insights base case.
| Scenario | 2035 (USD million) | CAGR 2025-2035 | What it assumes |
|---|---|---|---|
| Low | USD 23,219.44 million | 7.13% | Media IT load 12% lower in 2035; GPU share 21% of MW |
| Base | USD 27,572.22 million | 8.99% | 4,450 MW in 2035, 51% in public cloud, GPU share 26% |
| High | USD 31,634.59 million | 10.49% | Media IT load 10% higher; GPU share 31% of MW |
Low Scenario
USD 23.22 billion in 2035 if streaming growth slows and studios use fewer AI tools than planned.
Base Scenario
USD 27.57 billion in 2035, with media IT load rising from 2,300 MW to 4,450 MW and GPU capacity to 26% of it.
High Scenario
USD 31.63 billion in 2035 if cloud gaming and AI-generated content scale faster across Asia Pacific.
Key Players and Market Share: Who Supplies Media and Entertainment Data Centers?
Amazon Web Services, Google Cloud and Microsoft Azure together take about 65% of the USD 5.79 billion of 2025 media cloud infrastructure spending (DC Market Insights estimate); owned and colocated servers come mainly from Dell Technologies, Hewlett Packard Enterprise, Supermicro and Lenovo.
- Amazon Web Services
- Google Cloud
- Microsoft Azure
- Oracle Cloud Infrastructure
- Alibaba Cloud
- Tencent Cloud
- Akamai Technologies
- Equinix
- Digital Realty
- Dell Technologies
- Hewlett Packard Enterprise
- Supermicro
- Lenovo
- NVIDIA
- AMD
- Vertiv
- Schneider Electric
Company facts: Netflix’s technology and development expense was USD 3.39 billion in 2025, up 16% (Netflix, January 2026). Roblox’s 2025 increase in infrastructure cost included USD 186.3 million for data centers and technical infrastructure (Roblox, February 2026). Spotify’s cloud contract with Google includes minimum payment commitments (Spotify, February 2026).
Cloud Provider Concentration, 2025
The three largest cloud providers hold most media cloud spending because streaming catalogues, rendering and analytics sit close to their storage; Alibaba Cloud and Tencent Cloud serve most Chinese media and game companies. DC Market Insights estimates the top three providers’ share at about 65% and expects it to stay above 60% to 2030.
Recent Developments in the Media and Entertainment Data Center Market
Six dated events from the last eighteen months shaped the 2026 outlook of USD 13.08 billion.
- In July 2026, NVIDIA announced a new RTX 5080-powered GeForce NOW server in Toronto (Source: NVIDIA)
- In May 2026, Roblox reported more than 400 AI models running at over 1.5 million inferences per second (Source: Roblox)
- In April 2026, the European Broadcasting Union published version 2.0 of its Dynamic Media Facility reference architecture (Source: European Broadcasting Union)
- In January 2026, Netflix reported USD 45.2 billion of 2025 revenue and more than 325 million paid memberships (Source: Netflix)
- In November 2025, Xbox Cloud Gaming launched in India, reaching 29 countries (Source: Microsoft)
- In June 2025, Roblox peak concurrent players reached 30.6 million, more than double April’s 13.9 million (Source: Roblox)
Research Methodology: How DC Market Insights Sized the Media and Entertainment Data Center Market
The USD 11.66 billion 2025 value is a bottom-up DC Market Insights model of 2,300 MW of media IT load in use, about 5% of the roughly 46 GW of enterprise and colocation-class capacity plus the cloud capacity media companies rent, priced component by component; see the DC Market Insights research methodology.
Model Inputs
Media IT load in use of 1,750, 2,300, 3,250 and 4,450 MW in 2020, 2025, 2030 and 2035; owned share 60%, 46%, 38% and 33%; colocated share 15% then 16%; public cloud the rest; GPU share 2%, 7%, 18% and 26%; edge share 18%, 22%, 25% and 27%. In 2025 servers cost USD 2.55 million per conventional MW-year and USD 8.20 million per GPU MW-year; cloud capacity USD 6.00 million and USD 15.00 million per MW-year; colocation USD 190 per kW-month, so 368 MW x USD 190 x 12 = USD 839.04 million. Owned-site electrical and mechanical spending is USD 0.50 million per owned MW-year and construction USD 0.13 million per MW in use. Sibling DC Market Insights estimates use the same base, including the Retail Data Center Market and the Data Center Colocation Market reports.
Bound Checks
Ceiling 1: USD 11.66 billion is about 2.0% of the DC Market Insights global data center market of USD 570.04 billion in 2025. Ceiling 2: Europe’s USD 2.57 billion is 1.6% of the EUR 142 billion European audiovisual market of 2024 (European Audiovisual Observatory). Floor: Roblox’s USD 441.0 million and Netflix’s USD 688.2 million of 2025 property and equipment spending, USD 1.13 billion together, sit well inside the owned and colocated media spending of USD 5.87 billion.
Table of contents
- 01Introduction
- 1.1Report Description
- 1.2Key Market Statistics, 2025, 2026, 2030 and 2035
- 02Executive Summary
- 2.1Market Snapshot, 2025, 2026 and 2035
- 2.2Market Size Chart, 2020-2035
- 03Market Scope
- 3.1Included
- 3.2Excluded
- 3.3How the Segments Fit Together
- 04Why Market Estimates Differ
- 4.1Scope Table: In and Out of the DC Market Insights Estimate
- 05Market Drivers
- 5.1Roblox Doubles Peak Players and Adds USD 186.3 Million of Infrastructure Cost
- 5.2325 Million Netflix Memberships and 56 Tbit/s of French ISP Traffic
- 5.3400 AI Models at Roblox Show Inference Moving into Every Session
- 06Market Trends
- 6.1Spotify, Weta FX and Netflix Show the All-Cloud Model
- 6.2Broadcasters Move Playout onto IP and Shared Clusters
- 6.3Cloud Gaming Adds GPU Regions
- 07Market Challenges and Restraints
- 7.1Broadcast Viewing Falls 4% a Year in the UK
- 7.2EU Energy Reporting Adds Cost to Owned Sites
- 08Market Opportunities
- 8.1GPU Rendering and Virtual Production
- 8.2Edge Sites for Games and Delivery
- 09Pricing Analysis
- 9.1Spending per MW, 2020-2035
- 9.2Public Price Anchors
- 10Standards and Regulation
- 10.1EU Data Act, Regulation (EU) 2023/2854
- 10.2Delegated Regulation (EU) 2024/1364
- 10.3EU Data Center Rating Scheme
- 10.4EU AI Act
- 10.5SMPTE ST 2110
- 10.6EBU Dynamic Media Facility v2.0
- 10.7FCC NextGen TV (ATSC 3.0)
- 11Market Segmentation
- 11.1By Component
- 11.2Cloud Infrastructure Services
- 11.3IT Hardware
- 11.4Colocation Services
- 11.5Electrical and Mechanical Infrastructure
- 11.6Construction and Fit-Out
- 11.7By Deployment Model
- 11.8Public Cloud
- 11.9Owned Data Centers
- 11.10Colocation
- 11.11By Workload
- 11.12Game Servers and Live Services
- 11.13Content Delivery and Edge Caching
- 11.14Media Processing and Playout
- 11.15AI and Recommendation
- 11.16Corporate IT and Rights Management
- 11.17Rendering and Post-Production
- 11.18By End User
- 11.19Video Games and Interactive Entertainment
- 11.20Video Streaming Services
- 11.21Broadcasting and Pay-TV
- 11.22Film and TV Production and VFX
- 11.23Publishing and Digital Media
- 11.24Music and Audio Streaming
- 12DC Exclusive: Media Own-or-Rent Map
- 12.1Roblox
- 12.2Netflix
- 12.3Spotify
- 12.4Weta FX
- 12.5Microsoft (Xbox Cloud Gaming)
- 12.6NVIDIA (GeForce NOW)
- 12.7Industrial Light and Magic
- 12.8Electronic Arts
- 13Regional Insights
- 13.1North America
- 13.2Asia Pacific
- 13.3Europe
- 13.4Latin America
- 13.5Middle East and Africa
- 14Country Analysis
- 14.1United States
- 14.2China
- 14.3Japan
- 14.4United Kingdom
- 14.5South Korea
- 14.6Germany
- 14.7India
- 14.8France
- 14.9Canada
- 14.10Brazil
- 14.11Australia
- 14.12Saudi Arabia
- 15Forecast Scenarios
- 15.1Low Scenario
- 15.2Base Scenario
- 15.3High Scenario
- 16Competitive Insights
- 16.1Cloud Provider Concentration, 2025
- 16.2Amazon Web Services
- 16.3Google Cloud
- 16.4Microsoft Azure
- 16.5Oracle Cloud Infrastructure
- 16.6Alibaba Cloud
- 16.7Tencent Cloud
- 16.8Akamai Technologies
- 16.9Equinix
- 16.10Digital Realty
- 16.11Dell Technologies
- 16.12Hewlett Packard Enterprise
- 16.13Supermicro
- 16.14Lenovo
- 16.15NVIDIA
- 16.16AMD
- 16.17Vertiv
- 16.18Schneider Electric
- 17Recent Developments
- 17.1Dated Events, June 2025 to July 2026
- 18Research Methodology
- 18.1Model Inputs
- 18.2Bound Checks
- Fig. 1Media and Entertainment Data Center Market Size, 2020-2035
- Table 1Executive Summary Attributes
- Table 2Scope Table: In and Out of the Estimate
- Table 3Spending per MW, 2020-2035
- Table 4Market by Component, 2025 and 2035
- Table 5Market by Deployment Model, 2025 and 2035
- Table 6Market by Workload, 2025 and 2035
- Table 7Market by End User, 2025 and 2035
- Table 8Media Own-or-Rent Map, 8 Companies
- Table 9Market by Region, 2025 and 2035
- Table 10Top 12 Countries, 2025 and 2035
- Table 11Forecast Scenarios, 2035
About this report
Written by Amit Jain and reviewed by Deepti Agrawal, Senior Editor, Research. Figures are built top-down and bottom-up and reconciled before publication, with 2025 as the base year.
Read our methodologyHow we built this
- Historical period2020-2024
- Base year2025
- Forecast period2026-2035
- Sizing approachTop-down + bottom-up
Need more than the report?
Advisory on this market
Due diligence, site selection and market entry work, by the analysts who wrote this report.
See consulting servicesFrequently asked questions
USD 13.08 billion in 2026, up 12.14% from USD 11.66 billion in 2025, according to DC Market Insights estimates. The market is projected to reach USD 27.57 billion by 2035, a CAGR of 8.99% from 2025.
8.99% a year from 2025 to 2035, after 9.23% a year from 2020 to 2025, as media IT load in use rises from 2,300 MW to 4,450 MW and GPU capacity climbs from 7% to 26% of it.
USD 11.66 billion in 2025 was spent on capacity that streamers, broadcasters, studios, game companies, music services and publishers own, colocate or rent from cloud providers for their own services: delivery caches, game servers, render farms, playout and AI. Social and search platforms are not counted.
49.7% of 2025 media spending, USD 5.79 billion, goes to public cloud. Netflix runs the vast majority of its computing on AWS but owns 18,000 Open Connect cache servers, and Spotify closed its last data centers in 2018.
150,000+ servers in 25 regional data centers at the end of 2025, according to its 10-K, with 24 edge sites running game servers. Roblox spent USD 441.0 million on property and equipment in 2025, up from USD 179.6 million.
AI and recommendation grows fastest at 19.98% a year to USD 10.73 billion by 2035; among end users, film and TV production and VFX leads at 11.88%, and cloud infrastructure services lead components at 10.44%.
North America, with USD 4.55 billion or 39.0% of 2025 value. Asia Pacific grows fastest at 10.99% a year, and India is the fastest large country at 14.70%.
USD 5.07 million per MW in use in 2025, DC Market Insights estimates. Conventional cloud capacity costs about USD 500 per kW-month and GPU capacity USD 1,250, against USD 190 for colocation.
12 September 2025 is when the EU Data Act began to apply, and cloud switching charges end from January 2027. EU data centers of 500 kW and more report energy data each year under Regulation 2024/1364.
USD 13.08 billion in 2026 counts only media companies’ own computing. Estimates that add the video fleets of social and search platforms, CDN capacity sold to all industries, or broadcast equipment come out several times larger.
Licences, delivery and payment
Which licence should I choose?
Single User is a view-only PDF for one person. Multi User adds a printable PDF and the Excel data for unlimited users at one location. Enterprise covers your whole company and includes 100 free analyst hours.
How and when will I receive the report?
By email, within 24–48 business hours of payment, in the formats of your licence.
How can I pay?
Securely through PayPal: with a PayPal account, a debit or credit card, or PayPal Pay Later where available. Prices are in US dollars.
Can I see a sample first?
Yes. Request a free sample and we will email it to you.
Can the report be tailored to my needs?
Yes. We can add countries, segments or data cuts. Talk to an analyst about the scope you need.
Can I get an invoice or pay against a purchase order?
Write to sales@dcmarketinsights.com and our team will help.