
Hospitality Data Center Market Size, Share & Forecast to 2035
Market at a glance
The Hospitality Data Center market was worth USD 4,740.0 million in 2025 and is forecast to reach USD 11.71 billion by 2035, growing at a 9.45% CAGR.
 By Amit Jain, Senior Consultant, ICT & Emerging Technologies
 Reviewed by Deepti Agrawal
Last updated 9 Nov 2026
Base year 2025 PDF + Excel
Key findings
OPERA Cloud and Marriott's System Rebuild Move the PMS off Property
Byte by Yum! Turns 25,000 Restaurants into One Data Platform
Saudi Arabia's 122.6 Million Visitors and Dubai's 154,264 Hotel Rooms
What is inside the report
- 01Introduction
- 02Executive Summary
- 03Market Scope
- 04Why Market Estimates Differ
- 05Market Drivers
- 06Market Trends
- 07Market Challenges and Restraints
- 08Market Opportunities
- 09Pricing Analysis
- 10Standards and Regulation
- 21chapters
- 2020-2024Historical period
- 2026-2035Forecast period
- —Companies profiled
Segmentation
Recent developments
UN Tourism lowered its 2026 international arrivals growth outlook to 1% to 2% after a 0.4% rise in the first half (Source: UN Tourism).
Minor Hotels rolled out OPERA Cloud across 106 hotels, resorts and branded residences (Source: Oracle).
Agilysys reported record fiscal 2026 revenue of USD 319.3 million with 30.2% subscription growth (Source: Agilysys).
Marriott's Form 10-K described a multi-year transformation of its reservations, property management and loyalty systems (Source: Marriott International).
Resorts World Las Vegas moved three properties onto OPERA Cloud, and McDonald's said its Edge platform was live in hundreds of U.S. restaurants (Source: Oracle; McDonald's).
Sabre closed the USD 1.1 billion sale of its Hospitality Solutions business to TPG (Source: Sabre).
Full analysis
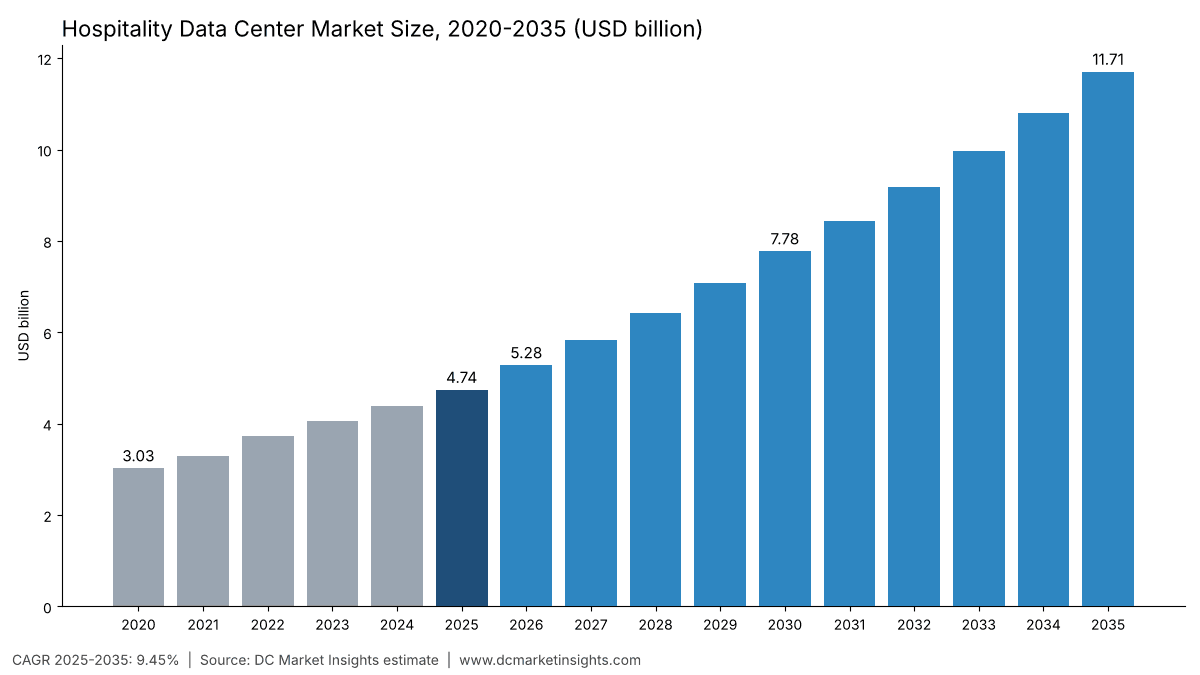
The Hospitality Data Center Market is valued at USD 5.28 billion in 2026 and is projected to reach USD 11.71 billion by 2035, up from USD 4.74 billion in 2025, a CAGR of 9.45% from 2025 to 2035 (DC Market Insights estimate). Hotel, restaurant and casino groups spend this money for a reason specific to the trade: a guest’s booking, room key, loyalty account and card payment now pass through one cloud property management system (PMS), so a single outage stops check-in at thousands of sites. Oracle reported that properties on its OPERA Cloud PMS rose more than 31% in a year, with 3,500 properties on OPERA Cloud Central (Oracle, June 2025), and MGM Resorts put the cost of its September 2023 cyber incident at about USD 100 million (MGM Resorts Form 8-K, October 2023). The 2025 receipt: 1,100 megawatts (MW) of information technology (IT) load in use by hospitality operators x USD 4.31 million of spending per MW = USD 4.74 billion, of which USD 3.20 billion is servers, storage and network gear and USD 1.03 billion is colocation and hosting fees. Hospitality AI and revenue management is the fastest workload at 20.22% a year, and the Middle East and Africa is the fastest region at 13.20% because Saudi Arabia recorded 122.6 million overnight visitors in 2025 and Dubai’s hotel stock reached 154,264 rooms.
Key Market Statistics: How Big Is the Hospitality Data Center Market in 2026?
DC Market Insights values hospitality data center spending at USD 5.28 billion in 2026, 11.39% above 2025, as cloud PMS migrations, restaurant edge servers and GPU (graphics processing unit) racks for revenue management all add load in the same year.
- Hospitality data center market size 2025: USD 4.74 billion
- Market size 2026: USD 5.28 billion
- Market size 2030: USD 7.78 billion
- Market size 2035: USD 11.71 billion
- CAGR 2025-2035: 9.45% (low case 7.66%, high case 11.09%)
- Largest component: IT hardware, USD 3.20 billion or 67.5% of 2025 value
- Fastest workload: hospitality AI and revenue management, 20.22% a year to USD 2.69 billion by 2035
- Largest sector: hotels and resorts, USD 2.18 billion in 2025; fastest sector: cruise lines at 11.47%, with restaurants and food service close behind at 11.15%
- Leading region: North America, USD 1.71 billion or 36.0% of 2025 value; fastest region: Middle East and Africa at 13.20%
- Largest country: United States, USD 1.54 billion in 2025; fastest large country: India at 17.05%
- Market leaders: Oracle, Amadeus and Agilysys in hospitality platforms, Dell Technologies, Hewlett Packard Enterprise and Lenovo in property servers, and Equinix and Digital Realty in colocation (DC Market Insights assessment)
Executive Summary: Hospitality Data Center Market Size, 2020-2035
The Global Hospitality Data Center Market size was valued at USD 3.03 billion in 2020, reached USD 4.74 billion in 2025, and is anticipated to reach USD 11.71 billion by 2035, at a CAGR of 9.45% during the forecast period. Spending grew 9.39% a year from 2020 to 2025 even though 2020 was the trough of travel; UN Tourism counted about 1.52 billion international tourists in 2025, almost 60 million more than in 2024 (UN Tourism, January 2026), so room nights and covers recovered faster than IT budgets.
| Attribute | Value |
|---|---|
| Historical period | 2020-2024 |
| Base year | 2025 |
| Forecast period | 2026-2035 |
| Market size 2025 | USD 4.74 billion |
| Market size 2026 | USD 5.28 billion |
| CAGR 2025-2035 | 9.45% |
| Market size 2035 | USD 11.71 billion |
| Segments covered | Component, hospitality sector, workload, deployment model, region, 12 countries |
Hospitality operators are closing their own server rooms: corporate data centers fall from USD 1.23 billion in 2025 to USD 819.46 million in 2035 (down 4.01% a year), while colocation and hosted private cloud rises from USD 1.99 billion to USD 6.79 billion at 13.04% a year. Property edge, the servers in hotel back offices, restaurant kitchens and ship IT rooms, grows to USD 4.10 billion because ordering kiosks, door locks and payment terminals must keep working when the internet link fails.
What Does a Hotel or Restaurant Group Spend on Data Centers?
USD 4.74 billion in 2025: the hospitality data center market is the data center capacity that hotel groups, restaurant chains, casino resorts and cruise lines own or lease for their own operations, priced as yearly spending.
Included: servers, storage and network equipment in corporate data centers, colocation cages and property server rooms; colocation and hosted private cloud fees paid by hospitality operators; electrical and mechanical infrastructure (uninterruptible power supply (UPS), cooling, switchgear) at owned sites; construction and fit-out of new halls and property IT rooms; GPU racks for revenue management, demand forecasting and guest-facing AI.
Excluded: public cloud subscription fees, hospitality software licences, point-of-sale terminals, guest Wi-Fi access points in rooms, in-room televisions, electricity bills and the data centers that hotel software vendors run for themselves.
How the segments fit together: every dimension sums to the same total in every year. Component splits the money by what is bought; hospitality sector by who buys it; workload by what it runs; deployment model by where it sits.
Why Do Hospitality Data Center Market Estimates Differ?
USD 5.28 billion in 2026 counts only data center capacity that hospitality operators own or lease; wider definitions add the software and cloud revenue of hospitality technology vendors, guest Wi-Fi and in-room entertainment, and come out several times larger.
Broader estimates often fold in hotel property management software, central reservation systems, hospitality point-of-sale terminals, smart room controls and even cloud computing bought from hyperscalers. Those are real costs for a hotel, but they are software and device markets; this estimate keeps to the rooms, racks and hosting contracts. Small and medium-sized operators (independent hotels, franchisees and single-site restaurants) are inside the market: their spending sits mainly in property edge servers and hosted private cloud.
| Element | In this estimate | Why |
|---|---|---|
| Servers, storage and network gear | Yes, USD 3.20 billion (2025) | Physical data center equipment |
| Colocation and hosted private cloud fees | Yes, USD 1.03 billion (2025) | Leased data center capacity |
| Property edge server rooms | Yes, USD 1.52 billion (2025, deployment view) | Rooms that host PMS, kiosks and payment gateways |
| Hospitality software licences | No | Software market, not capacity |
| Public cloud subscriptions | No | Counted in cloud provider revenue |
| Point-of-sale terminals and guest Wi-Fi | No | Devices, not data center equipment |
Market Drivers: Why Are Hospitality Groups Spending More on Data Centers?
Three drivers lift hospitality data center spending from USD 4.74 billion in 2025 to USD 7.78 billion in 2030: cloud PMS migration, restaurant edge computing and the cost of cyber incidents.
OPERA Cloud and Marriott’s System Rebuild Move the PMS off Property
Property management systems are moving into hosted halls: Oracle reported more than 31% growth in OPERA Cloud properties in June 2025, and Marriott International’s 2025 Form 10-K says it is undertaking a multi-year transformation of its reservations, property management and loyalty systems (Marriott, February 2026). For hospitality data center spending, that moves load from 9,800 property back offices into colocation and hosted private cloud, which grows 13.04% a year to USD 6.79 billion by 2035.
McDonald’s Puts Google Distributed Cloud in Its Restaurants
Restaurant chains are installing small data centers in their kitchens: McDonald’s said in December 2023 that it will use Google Cloud edge computing in its restaurants and targets 50,000 restaurants by the end of 2027 (McDonald’s, December 2023), and in August 2025 it said the Edge platform was live in hundreds of U.S. restaurants (McDonald’s, August 2025). Restaurants and food service is the second-largest hospitality data center sector at USD 1.42 billion in 2025 and grows 11.15% a year to USD 4.10 billion.
MGM’s USD 100 Million Incident Puts Recovery Sites in the Casino Budget
Casino and hotel boards now price outages in money: MGM Resorts estimated about USD 100 million of lost property earnings from the September 2023 cyber incident, Caesars Entertainment reported the same month that its loyalty program database had been copied (Caesars Form 8-K, September 2023), and the Federal Trade Commission ordered Marriott and Starwood to fix security after breaches that hit more than 344 million customers (Federal Trade Commission, October 2024). Backup, security and other workloads stay at USD 901.25 million in 2025 and reach USD 1.76 billion by 2035 as groups add segmented recovery sites.
Market Trends: What Is Changing Inside Hospitality Data Centers?
Hospitality AI and revenue management grows from USD 426.91 million in 2025 to USD 2.69 billion in 2035, the clearest trend in the hospitality data center market.
Byte by Yum! Turns 25,000 Restaurants into One Data Platform
Yum! Brands launched Byte by Yum! in February 2025 with 25,000 restaurants already using at least one Byte product (Yum! Brands, February 2025), and its digital system sales passed USD 11 billion in the fourth quarter of 2025 with a digital mix near 60% (Yum! Brands Form 8-K, February 2026). Chipotle reported digital sales at 36.7% of food and beverage revenue in the same quarter (Chipotle, February 2026). Orders that arrive by app are scored, routed and forecast in the data center, so GPU share of hospitality IT load rises from 4% in 2025 to 19% in 2035 in the DC Market Insights model.
Generative AI Reaches the Counter: Starbucks Pilots Green Dot Assist in 35 Stores
Starbucks began piloting Green Dot Assist, a generative AI assistant for baristas, in 35 coffeehouses in June 2025 (Starbucks, June 2025). Each assistant query runs on inference servers in a hosted hall rather than in the store, which is why AI racks cost USD 8.00 million per MW-year of IT load against USD 2.70 million for conventional hospitality servers in 2025.
Ships Become Floating Edge Sites
Royal Caribbean Group planned Starlink satellite links on all Royal Caribbean, Celebrity and Silversea ships by the first quarter of 2023 (Royal Caribbean Group, August 2022). Faster links let ships sync with shore halls, but each ship still carries its own server room; cruise lines are the fastest hospitality sector at 11.47% a year, from USD 237.17 million in 2025 to USD 702.39 million in 2035.
Market Challenges and Restraints: What Slows Hospitality Data Center Investment?
A weaker 2026 travel year and franchise-split IT budgets hold hospitality data center growth to 11.39% in 2026, against faster growth in AI-led data center markets.
UN Tourism Cuts 2026 Arrivals Growth to 1-2%
International arrivals rose only about 0.4% to some 690 million in January-June 2026, and UN Tourism now expects 1% to 2% growth for the full year (UN Tourism, September 2026). Hotel and cruise groups tie technology budgets to revenue per available room, so the DC Market Insights low case of USD 9.92 billion by 2035 (7.66% a year) assumes slower travel and lower GPU adoption.
Franchised Hotels Split the IT Budget
Brand owners pay for central systems while franchisees pay for property servers, so spend is fragmented: Hilton’s capitalized software costs fell from USD 102 million in 2024 to USD 84 million in 2025 (Hilton, February 2026), while Choice Hotels booked USD 5.9 million of global enterprise resource planning (ERP) implementation costs in 2025 (Choice Hotels, February 2026). Corporate data centers in hospitality shrink 4.01% a year to USD 819.46 million by 2035 as central systems move to hosted capacity.
Market Opportunities: Where Will New Hospitality Data Center Demand Come From?
The Middle East and Africa and India add USD 1.07 billion of hospitality data center spending between 2025 and 2035, the largest new pools outside North America.
Saudi Arabia’s 122.6 Million Visitors and Dubai’s 154,264 Hotel Rooms
Saudi Arabia recorded 122.6 million overnight visitors in 2025 against a raised Vision 2030 target of 150 million (OECD Tourism Trends and Policies 2026, citing the Ministry of Tourism), and Dubai’s hotel stock reached 154,264 rooms across 827 establishments at 80.7% occupancy (Government of Dubai Media Office, February 2026). Saudi hospitality data center spending grows from USD 56.92 million in 2025 to USD 245.84 million in 2035, about 15.75% a year, second only to India among the markets in the model.
India’s Registered Hotels and Data Protection Rules
India’s NIDHI+ registry lists 63,740 accommodation units (Ministry of Tourism, September 2026), and the Digital Personal Data Protection (DPDP) Rules 2025 give operators an 18-month phased compliance timeline (Press Information Bureau, November 2025). Guest data that must be protected and localised favours domestic colocation: India’s hospitality data center spending grows 17.05% a year from USD 128.07 million to USD 618.10 million.
Pricing Analysis: How Much Does Hospitality Spend per MW of Data Center Capacity?
Hospitality operators spent USD 4.31 million per MW of IT load in use in 2025, rising to USD 5.71 million by 2035 as GPU racks take a larger share.
| Metric | 2020 | 2025 | 2030 | 2035 |
|---|---|---|---|---|
| Total spending per MW in use (USD million) | 3.69 | 4.31 | 5.12 | 5.71 |
| IT hardware per conventional MW-year (USD million) | 2.55 | 2.70 | 2.85 | 3.00 |
| IT hardware per AI MW-year (USD million) | 8.50 | 8.00 | 7.60 | 7.20 |
| Colocation and hosting (USD per kW-month) | 170 | 185 | 200 | 212 |
| Hospitality IT load in use (MW) | 820 | 1,100 | 1,520 | 2,050 |
Public anchors: Agilysys, a hospitality software vendor, reported record fiscal 2026 revenue of USD 319.3 million with subscription revenue up 30.2% (Agilysys, May 2026), and Amadeus reported Hospitality and Other Solutions revenue of EUR 1,051.9 million in 2025, up 6.1% (Amadeus, February 2026); both figures show hosted hospitality systems growing faster than travel volumes. Sabre sold its Hospitality Solutions business to TPG for USD 1.1 billion in July 2025 (Sabre, July 2025).
Standards and Regulation: Which Rules Shape Hospitality Data Center Design?
Five rules shape where the USD 4.74 billion of 2025 hospitality data center spending sits, led by card security and guest-data law.
- PCI DSS v4.0.1: 51 of the 64 new requirements of the Payment Card Industry Data Security Standard became effective on 31 March 2025 (PCI Security Standards Council, August 2024); card-data systems move into segmented, audited halls.
- FTC order on Marriott and Starwood: the order requires a security program with compliance certification for 20 years, and a separate multistate settlement cost Marriott USD 52 million (New York Attorney General, October 2024).
- EU NIS2 Directive: Member States had to transpose it by 17 October 2024 (European Commission); data centre service providers that host hotel systems fall under its digital infrastructure rules.
- EU General Data Protection Regulation (GDPR): guest profiles, passport scans and loyalty data are personal data, which favours EU-hosted capacity for European hotel groups.
- India DPDP Rules 2025: 18-month phased compliance from November 2025 (Press Information Bureau, November 2025).
Hospitality Data Center Market Segmentation: Which Segment Spends Most?
IT hardware is the largest component at USD 3.20 billion in 2025, hotels and resorts the largest sector at USD 2.18 billion, and colocation and hosted private cloud the largest deployment model at USD 1.99 billion.
By Component
| Component | 2025 (USD million) | Share 2025 | 2035 (USD million) | CAGR 2025-2035 |
|---|---|---|---|---|
| IT Hardware | 3,203.20 | 67.5% | 7,785.90 | 9.29% |
| Colocation and Hosting Services | 1,025.64 | 21.6% | 3,024.82 | 11.42% |
| Electrical and Mechanical Infrastructure | 350.90 | 7.4% | 551.04 | 4.62% |
| Construction and Fit-Out | 163.68 | 3.5% | 344.75 | 7.73% |
By Hospitality Sector
| Hospitality Sector | 2025 (USD million) | Share 2025 | 2035 (USD million) | CAGR 2025-2035 |
|---|---|---|---|---|
| Hotels and Resorts | 2,181.97 | 46.0% | 5,033.80 | 8.72% |
| Restaurants and Food Service | 1,423.03 | 30.0% | 4,097.28 | 11.15% |
| Casinos and Gaming Resorts | 616.64 | 13.0% | 1,170.65 | 6.62% |
| Cruise Lines | 237.17 | 5.0% | 702.39 | 11.47% |
| Other Accommodation | 284.61 | 6.0% | 702.39 | 9.45% |
By Workload
| Workload | 2025 (USD million) | Share 2025 | 2035 (USD million) | CAGR 2025-2035 |
|---|---|---|---|---|
| Property Management and Reservations | 1,423.03 | 30.0% | 2,692.50 | 6.58% |
| Guest Digital and Loyalty Platforms | 1,043.55 | 22.0% | 2,692.50 | 9.94% |
| Payments and Point of Sale | 948.68 | 20.0% | 1,873.04 | 7.04% |
| Hospitality AI and Revenue Management | 426.91 | 9.0% | 2,692.50 | 20.22% |
| Backup Security and Other Workloads | 901.25 | 19.0% | 1,755.97 | 6.90% |
By Deployment Model
| Deployment Model | 2025 (USD million) | Share 2025 | 2035 (USD million) | CAGR 2025-2035 |
|---|---|---|---|---|
| Corporate Data Centers | 1,233.29 | 26.0% | 819.46 | -4.01% |
| Property Edge | 1,517.89 | 32.0% | 4,097.28 | 10.44% |
| Colocation and Hosted Private Cloud | 1,992.24 | 42.0% | 6,789.77 | 13.04% |
DC Exclusive: Hotel Group Room-to-Rack Ladder, 7 Groups, 6.94 Million Rooms and 173 MW
The Hotel Group Room-to-Rack Ladder is a DC Market Insights model built on 9 inputs: the end-2025 room counts of the seven largest hotel groups, an IT load of 25 watts per room for PMS, reservations, loyalty, payments and back-office systems, and hotels’ modelled spending of USD 4.31 million per MW in 2025. It shows that these seven groups alone account for about USD 747.88 million, or 34% of the USD 2.18 billion hotels and resorts segment.
| Hotel group | Rooms, end-2025 | Modelled IT load (MW) | Modelled data center spending 2025 (USD million) |
|---|---|---|---|
| Marriott International | 1,780,000 | 44.5 | 191.89 |
| Hilton | 1,351,351 | 33.8 | 145.68 |
| IHG Hotels and Resorts | 1,026,000 | 25.6 | 110.61 |
| Accor | 881,427 | 22.0 | 95.02 |
| Wyndham Hotels and Resorts | 869,000 | 21.7 | 93.68 |
| Choice Hotels | 656,825 | 16.4 | 70.81 |
| Hyatt | 372,763 | 9.3 | 40.19 |
| Total, 7 groups | 6,937,366 | 173.4 | 747.88 |
Room counts: Marriott (February 2026), Hilton (February 2026), IHG (February 2026), Accor (February 2026), Wyndham (February 2026), Choice Hotels (February 2026), Hyatt (February 2026). The ladder reads one way: every 100,000 rooms a group adds, at Hilton’s record pipeline of 520,500 rooms, brings about 2.5 MW of IT load and USD 10.78 million a year of data center spending.
Which Region Leads the Hospitality Data Center Market?
North America leads with USD 1.71 billion or 36.0% of 2025 value; the Middle East and Africa grows fastest at 13.20% a year, and Asia Pacific overtakes North America by 2035 at USD 3.86 billion.
| Region | 2025 (USD million) | Share 2025 | 2035 (USD million) | CAGR 2025-2035 |
|---|---|---|---|---|
| North America | 1,707.63 | 36.0% | 3,629.02 | 7.83% |
| Europe | 1,280.72 | 27.0% | 2,751.03 | 7.95% |
| Asia Pacific | 1,280.72 | 27.0% | 3,863.15 | 11.67% |
| Latin America | 237.17 | 5.0% | 643.86 | 10.50% |
| Middle East and Africa | 237.18 | 5.0% | 819.45 | 13.20% |
North America
North American hospitality data center spending is USD 1.71 billion in 2025 and USD 3.63 billion in 2035 (7.83%). U.S. food services and drinking places sold USD 92.9 billion in September 2026 against USD 86.8 billion a year earlier (U.S. Census Bureau, October 2026), and Marriott, Hilton, Hyatt, Wyndham and Choice together operated about 5.03 million rooms at end-2025 (company filings, February 2026).
Europe
Europe reaches USD 2.75 billion by 2035 at 7.95% a year. EU tourist accommodation recorded nearly 3.1 billion nights in 2025, up 2.2% (Eurostat, March 2026), and GDPR keeps guest data for European groups such as Accor in EU-hosted capacity.
Asia Pacific
Asia Pacific grows 11.67% a year to USD 3.86 billion. Japan received 42,683,600 visitors in 2025 (Japan National Tourism Organization, January 2026), and China is the second-largest country at USD 448.25 million in 2025.
Latin America
Latin America rises from USD 237.17 million to USD 643.86 million (10.50%); Brazil is the largest market at USD 90.12 million in 2025, followed by Mexico at USD 71.15 million.
Middle East and Africa
The Middle East and Africa is the fastest region, from USD 237.18 million in 2025 to USD 819.45 million in 2035 (13.20%), led by Saudi Arabia’s 122.6 million overnight visitors in 2025 and Dubai’s 154,264 hotel rooms.
Top 12 Countries in the Hospitality Data Center Market
The United States leads with USD 1.54 billion in 2025, and India is the fastest large country at 17.05% a year to USD 618.10 million by 2035.
| Rank | Country | Region | 2025 (USD million) | 2035 (USD million) | CAGR 2025-2035 |
|---|---|---|---|---|---|
| 1 | United States | North America | 1,536.87 | 3,229.83 | 7.71% |
| 2 | China | Asia Pacific | 448.25 | 1,332.79 | 11.51% |
| 3 | Japan | Asia Pacific | 268.95 | 637.42 | 9.01% |
| 4 | United Kingdom | Europe | 256.14 | 550.21 | 7.95% |
| 5 | Germany | Europe | 217.72 | 467.68 | 7.95% |
| 6 | France | Europe | 192.11 | 412.65 | 7.95% |
| 7 | Spain | Europe | 153.69 | 343.88 | 8.39% |
| 8 | Italy | Europe | 140.88 | 302.61 | 7.95% |
| 9 | Canada | North America | 136.61 | 290.32 | 7.83% |
| 10 | India | Asia Pacific | 128.07 | 618.10 | 17.05% |
| 11 | Brazil | Latin America | 90.12 | 244.67 | 10.50% |
| 12 | Australia | Asia Pacific | 89.65 | 251.10 | 10.85% |
Saudi Arabia sits just outside the top 12 at USD 56.92 million in 2025 but grows about 15.75% a year to USD 245.84 million by 2035, faster than every top-12 country except India.
Forecast Scenarios: How Large Could the Hospitality Data Center Market Be in 2035?
DC Market Insights sets the 2035 hospitality data center market between USD 9.92 billion and USD 13.58 billion, with a base case of USD 11.71 billion.
| Scenario | IT load in use 2035 (MW) | GPU share 2035 | Market size 2035 | CAGR 2025-2035 |
|---|---|---|---|---|
| Low | 1,800 | 15% | USD 9.92 billion | 7.66% |
| Base | 2,050 | 19% | USD 11.71 billion | 9.45% |
| High | 2,300 | 23% | USD 13.58 billion | 11.09% |
Low Scenario
USD 9.92 billion if travel growth stays near the 1% to 2% that UN Tourism expects for 2026 and hotel AI stays in pilots.
Base Scenario
USD 11.71 billion with IT load in use rising from 1,100 MW to 2,050 MW and restaurant edge platforms reaching most large chains.
High Scenario
USD 13.58 billion if GPU share reaches 23% and Gulf and Indian room pipelines open on schedule.
Key Players and Market Share: Who Supplies the Hospitality Data Center Market?
The five largest server suppliers hold about 55% of hospitality data center hardware spending in 2025 (DC Market Insights estimate based on shipments to hotel, restaurant and casino groups), while hospitality platforms concentrate in Oracle and Amadeus.
- Oracle (OPERA Cloud PMS, 3,500 properties on OPERA Cloud Central)
- Amadeus (Hospitality and Other Solutions, EUR 1,051.9 million revenue in 2025)
- Agilysys (USD 319.3 million revenue in fiscal 2026)
- TPG-owned SynXis, the former Sabre Hospitality Solutions
- Shiji Group
- Infor
- Dell Technologies
- Hewlett Packard Enterprise
- Lenovo
- Cisco Systems
- Google Cloud (Google Distributed Cloud edge in McDonald’s restaurants)
- Microsoft
- Amazon Web Services
- Equinix
- Digital Realty
- NTT DATA
Platform and Hosting Concentration, 2025
Platform choice decides where hospitality load sits: when a hotel group moves to a hosted PMS, the servers move from the property into the vendor’s or the colocation provider’s hall, which is why colocation and hosted private cloud already makes up 42.0% of 2025 spending in the deployment view.
Recent Developments in the Hospitality Data Center Market
Six dated events since mid-2025 show the hospitality data center market moving to hosted platforms while travel growth slows.
- In September 2026, UN Tourism lowered its 2026 international arrivals growth outlook to 1% to 2% after a 0.4% rise in the first half (Source: UN Tourism).
- In August 2026, Minor Hotels rolled out OPERA Cloud across 106 hotels, resorts and branded residences (Source: Oracle).
- In May 2026, Agilysys reported record fiscal 2026 revenue of USD 319.3 million with 30.2% subscription growth (Source: Agilysys).
- In February 2026, Marriott’s Form 10-K described a multi-year transformation of its reservations, property management and loyalty systems (Source: Marriott International).
- In August 2025, Resorts World Las Vegas moved three properties onto OPERA Cloud, and McDonald’s said its Edge platform was live in hundreds of U.S. restaurants (Source: Oracle; McDonald’s).
- In July 2025, Sabre closed the USD 1.1 billion sale of its Hospitality Solutions business to TPG (Source: Sabre).
Research Methodology: How DC Market Insights Sized the Hospitality Data Center Market
The USD 4.74 billion 2025 value is a bottom-up DC Market Insights model of 1,100 MW of hospitality IT load in use, about 2.4% of the roughly 46 gigawatts (GW) of enterprise and colocation capacity inside the 116 GW installed base, priced component by component; see the DC Market Insights research methodology.
Model Inputs
Hospitality IT load in use of 820, 1,100, 1,520 and 2,050 MW in 2020, 2025, 2030 and 2035; leased share 30%, 42%, 51% and 58%; GPU share 1%, 4%, 12% and 19%; property edge share 30%, 32%, 34% and 35%. IT hardware costs USD 2.70 million per conventional MW-year and USD 8.00 million per AI MW-year in 2025; colocation and hosting average USD 185 per kW-month, so 462 leased MW x USD 185 x 12 = USD 1.03 billion. Owned-site electrical and mechanical spending is USD 350.90 million and construction and fit-out USD 163.68 million. Sibling estimates use the same base: the Retail Data Center Market at 8% of enterprise and colocation load and the Transportation and Logistics Data Center Market; property server rooms are a subset of the Edge Data Center Market, and hosting fees are a slice of the Data Center Colocation Market.
Bound Checks
Ceiling 1: USD 4.74 billion is 0.8% of the DC Market Insights global data center market of USD 570.04 billion in 2025, below retail (3.0%). Ceiling 2: the U.S. share of USD 1.54 billion is 8.1% of the USD 18.9 billion that U.S. accommodation and food services spent on equipment in 2022 (U.S. Census Bureau, February 2024). Floor: the Hotel Group Room-to-Rack Ladder puts the seven largest hotel groups at USD 747.88 million, below the USD 2.18 billion hotels and resorts segment. Every split sums to the total in every year, and the CAGR is recomputed from the 2025 and 2035 endpoints.
Table of contents
- 01Introduction
- 1.1Report Description
- 1.2Key Market Statistics, 2025, 2026, 2030 and 2035
- 02Executive Summary
- 2.1Market Snapshot, 2025, 2026 and 2035
- 2.2Market Size Chart, 2020-2035
- 03Market Scope
- 3.1Included
- 3.2Excluded
- 3.3How the Segments Fit Together
- 04Why Market Estimates Differ
- 4.1Scope Table: In and Out of This Estimate
- 05Market Drivers
- 5.1OPERA Cloud and Marriott's System Rebuild Move the PMS off Property
- 5.2McDonald's Puts Google Distributed Cloud in Its Restaurants
- 5.3MGM's USD 100 Million Incident Puts Recovery Sites in the Casino Budget
- 06Market Trends
- 6.1Byte by Yum! Turns 25,000 Restaurants into One Data Platform
- 6.2Generative AI Reaches the Counter: Starbucks Pilots Green Dot Assist in 35 Stores
- 6.3Ships Become Floating Edge Sites
- 07Market Challenges and Restraints
- 7.1UN Tourism Cuts 2026 Arrivals Growth to 1-2%
- 7.2Franchised Hotels Split the IT Budget
- 08Market Opportunities
- 8.1Saudi Arabia's 122.6 Million Visitors and Dubai's 154,264 Hotel Rooms
- 8.2India's Registered Hotels and Data Protection Rules
- 09Pricing Analysis
- 9.1Spending per MW, 2020-2035
- 9.2Public Price and Size Anchors
- 10Standards and Regulation
- 10.1PCI DSS v4.0.1
- 10.2FTC Order on Marriott and Starwood
- 10.3EU NIS2 Directive
- 10.4EU General Data Protection Regulation
- 10.5India DPDP Rules 2025
- 11Market Segmentation by Component
- 11.1IT Hardware
- 11.2Colocation and Hosting Services
- 11.3Electrical and Mechanical Infrastructure
- 11.4Construction and Fit-Out
- 12Market Segmentation by Hospitality Sector
- 12.1Hotels and Resorts
- 12.2Restaurants and Food Service
- 12.3Casinos and Gaming Resorts
- 12.4Cruise Lines
- 12.5Other Accommodation
- 13Market Segmentation by Workload
- 13.1Property Management and Reservations
- 13.2Guest Digital and Loyalty Platforms
- 13.3Payments and Point of Sale
- 13.4Hospitality AI and Revenue Management
- 13.5Backup Security and Other Workloads
- 14Market Segmentation by Deployment Model
- 14.1Corporate Data Centers
- 14.2Property Edge
- 14.3Colocation and Hosted Private Cloud
- 15DC Exclusive: Hotel Group Room-to-Rack Ladder
- 15.1Marriott International
- 15.2Hilton
- 15.3IHG Hotels and Resorts
- 15.4Accor
- 15.5Wyndham Hotels and Resorts
- 15.6Choice Hotels
- 15.7Hyatt
- 16Regional Insights
- 16.1North America
- 16.2Europe
- 16.3Asia Pacific
- 16.4Latin America
- 16.5Middle East and Africa
- 17Country Analysis
- 17.1United States
- 17.2China
- 17.3Japan
- 17.4United Kingdom
- 17.5Germany
- 17.6France
- 17.7Spain
- 17.8Italy
- 17.9Canada
- 17.10India
- 17.11Brazil
- 17.12Australia
- 17.13Saudi Arabia
- 18Forecast Scenarios
- 18.1Low Scenario
- 18.2Base Scenario
- 18.3High Scenario
- 19Key Players and Market Share
- 19.1Oracle
- 19.2Amadeus
- 19.3Agilysys
- 19.4SynXis (TPG)
- 19.5Shiji Group
- 19.6Infor
- 19.7Dell Technologies
- 19.8Hewlett Packard Enterprise
- 19.9Lenovo
- 19.10Cisco Systems
- 19.11Google Cloud
- 19.12Microsoft
- 19.13Amazon Web Services
- 19.14Equinix
- 19.15Digital Realty
- 19.16NTT DATA
- 19.17Platform and Hosting Concentration, 2025
- 20Recent Developments
- 20.1September 2026: UN Tourism Outlook Cut
- 20.2August 2026: Minor Hotels on OPERA Cloud
- 20.3May 2026: Agilysys Fiscal 2026 Results
- 20.4February 2026: Marriott System Transformation
- 20.5August 2025: Resorts World and McDonald's Edge
- 20.6July 2025: Sabre Hospitality Solutions Sale
- 21Research Methodology
- 21.1Model Inputs
- 21.2Bound Checks
- Fig. 1Hospitality Data Center Market Size, 2020-2035 (USD million)
- Table 1Market Snapshot, 2025, 2026 and 2035
- Table 2Scope Table: In and Out of This Estimate
- Table 3Spending per MW, 2020-2035
- Table 4Market by Component, 2025 and 2035
- Table 5Market by Hospitality Sector, 2025 and 2035
- Table 6Market by Workload, 2025 and 2035
- Table 7Market by Deployment Model, 2025 and 2035
- Table 8Hotel Group Room-to-Rack Ladder
- Table 9Market by Region, 2025 and 2035
- Table 10Top 12 Countries, 2025 and 2035
- Table 11Forecast Scenarios, 2035
About this report
Written by Amit Jain and reviewed by Deepti Agrawal, Senior Editor, Research. Figures are built top-down and bottom-up and reconciled before publication, with 2025 as the base year.
Read our methodologyHow we built this
- Historical period2020-2024
- Base year2025
- Forecast period2026-2035
- Sizing approachTop-down + bottom-up
Need more than the report?
Advisory on this market
Due diligence, site selection and market entry work, by the analysts who wrote this report.
See consulting servicesFrequently asked questions
USD 5.28 billion in 2026, up 11.39% from USD 4.74 billion in 2025, according to DC Market Insights estimates. The market is projected to reach USD 11.71 billion by 2035, a CAGR of 9.45% from 2025.
9.45% a year from 2025 to 2035, after 9.39% a year from 2020 to 2025, as hospitality IT load in use rises from 1,100 MW to 2,050 MW and GPU racks climb from 4% to 19% of it.
USD 4.74 billion in 2025 was spent on data center capacity that hotel groups, restaurant chains, casinos and cruise lines own or lease: corporate halls, colocation cages, hosted private cloud and property server rooms. Software licences and public cloud fees are not counted.
13.04% a year is how fast colocation and hosted private cloud grows, to USD 6.79 billion by 2035, because OPERA Cloud properties rose more than 31% in a year and Marriott is rebuilding its reservations, PMS and loyalty systems.
USD 1.42 billion of 2025 spending comes from restaurants and food service, growing 11.15% a year: McDonald’s runs Google Cloud edge computing in its restaurants and 25,000 Yum! restaurants use Byte by Yum! products.
Hospitality AI and revenue management grows fastest at 20.22% a year to USD 2.69 billion by 2035; among sectors, cruise lines lead at 11.47%, and corporate data centers shrink 4.01% a year.
About 173 MW in the DC Market Insights Room-to-Rack Ladder: 6.94 million rooms at the seven largest groups x 25 watts per room, worth about USD 747.88 million of 2025 spending.
North America, with USD 1.71 billion or 36.0% of 2025 value. The Middle East and Africa grows fastest at 13.20% a year, and India is the fastest large country at 17.05%.
USD 56.92 million in 2025, rising to USD 245.84 million by 2035 at about 15.75% a year, as Saudi Arabia recorded 122.6 million overnight visitors in 2025 against a Vision 2030 target of 150 million.
USD 5.28 billion in 2026 counts only capacity hospitality operators own or lease. Estimates that add hospitality software, public cloud subscriptions, point-of-sale terminals or guest Wi-Fi come out several times larger.
Get this report
How do I get the full report?
Request a quote; we reply by email within one business day.
How and when will I receive the report?
By email, within 24–48 business hours of payment.
How can I pay?
Once you accept the quote, we email you a secure payment link.
Can I see a sample first?
Yes. Request a free sample and we will email it to you.
Can the report be tailored to my needs?
Yes. We can add countries, segments or data cuts. Talk to an analyst about the scope you need.
Can I get an invoice or pay against a purchase order?
Write to sales@dcmarketinsights.com and our team will help.