
Transportation and Logistics Data Center Market Size, Share & Forecast to 2035
Market at a glance
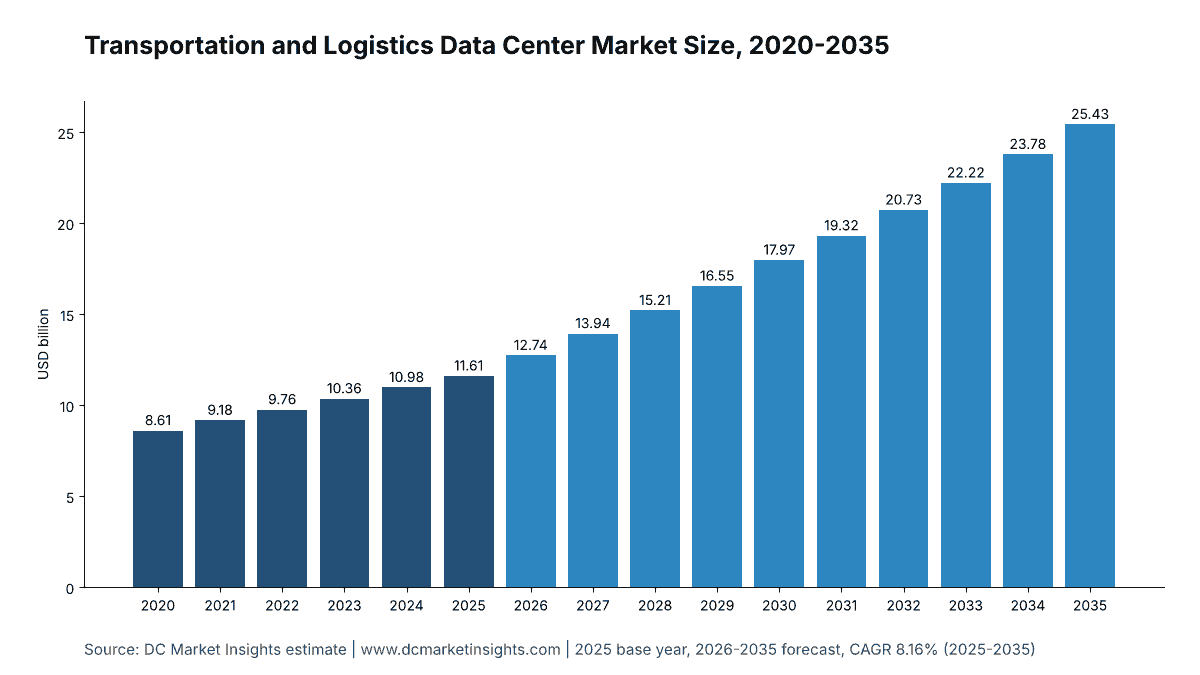
The Transportation and Logistics Data Center market was worth USD 11.61 billion in 2025 and is forecast to reach USD 25.43 billion by 2035, growing at a 8.16% CAGR.
 By Amit Jain, Senior Consultant, ICT & Emerging Technologies
 Reviewed by Deepti Agrawal
Last updated 29 Oct 2026
Base year 2025 PDF + Excel
Key findings
China's 198.95 Billion Parcels and 4.7 Billion Air Passengers Set the Transaction Load
Sabre Shut 19 Data Centers and Amadeus Moved 100% of Its Workloads to Azure
Air Traffic Control Rebuild: A USD 12.5 Billion U.S. Down Payment
What is inside the report
- 01Introduction
- 02Executive Summary
- 03Market Scope
- 04Why Market Estimates Differ
- 05Market Drivers
- 06Market Trends
- 07Market Challenges and Restraints
- 08Market Opportunities
- 09Pricing Analysis
- 10Standards and Regulation
- 18chapters
- 2020-2024Historical period
- 2026-2035Forecast period
- —Companies profiled
Segmentation
Recent developments
Amadeus said 100% of the workloads previously hosted in its data centers had moved to Microsoft Azure (Source: Amadeus).
CMA CGM said it had deployed more than 55 AI projects and identified over 200 use cases (Source: CMA CGM).
China's State Post Bureau reported 198.95 billion express parcels for 2025, up 13.6% (Source: State Post Bureau).
EU Member State authorities could start accepting freight data from certified eFTI platforms (Source: European Commission).
the EU Entry/Exit System began operations on 12 October with a six-month rollout (Source: European Commission).
the U.S. Coast Guard maritime cybersecurity rule took effect on 16 July (Source: Federal Register).
Full analysis
The Transportation and Logistics Data Center Market is valued at USD 12.74 billion in 2026 and is projected to reach USD 25.43 billion by 2035, up from USD 11.61 billion in 2025, a CAGR of 8.16% from 2025 to 2035 (DC Market Insights estimate). What moves money here is not passenger or parcel growth alone but the failure cost of a single system: Delta Air Lines told investors that the July 2024 CrowdStrike software fault cancelled about 7,000 flights over five days and cost about USD 380 million of revenue plus USD 170 million of extra expense (Delta Air Lines exhibit 99.1 filed with the U.S. Securities and Exchange Commission, October 2024), and Amadeus, which runs reservations for much of the airline industry, said in September 2026 that 100% of the workloads it once hosted in its own data centers now run on Microsoft Azure (Amadeus, September 2026). The 2025 receipt is 2,450 megawatts (MW) of information technology (IT) load used by carriers, airports, railways, shipping lines, ports, freight forwarders and travel and mobility platforms x USD 4.74 million of yearly spending per MW = USD 11.61 billion. Analytics and artificial intelligence (AI) is the fastest workload at 16.78% a year as route, load and pricing models move onto graphics processing units (GPUs), and the Middle East and Africa is the fastest region at 11.66% as Gulf hub airports and ports digitise.
Key Market Statistics: How Big Is the Transportation and Logistics Data Center Market in 2026?
DC Market Insights values transport and logistics data center spending at USD 12.74 billion in 2026, 9.73% above 2025, as operators replace owned server rooms with cloud regions, colocation halls and edge sites at hubs and ports.
- Transportation and logistics data center market size 2025: USD 11.61 billion
- Market size 2026: USD 12.74 billion
- Market size 2030: USD 17.97 billion
- Market size 2035: USD 25.43 billion
- CAGR 2025-2035: 8.16% (low case 6.36%, high case 9.86%)
- Largest component: cloud infrastructure services, USD 5.44 billion or 46.8% of 2025 value
- Fastest workload: analytics and AI, 16.78% a year to USD 7.12 billion by 2035
- Largest end user: parcel and express carriers, USD 2.79 billion in 2025; fastest deployment model: edge sites at hubs and ports at 12.66%
- Leading region: North America, USD 4.06 billion or 35.0% of 2025 value; fastest region: Middle East and Africa at 11.66%
- Largest country: United States, USD 3.56 billion in 2025; fastest large country: India at 15.52%
- Market leaders: Amazon Web Services, Microsoft Azure and Google Cloud in rented capacity, with Oracle Cloud Infrastructure, IBM mainframes and Equinix colocation in operator estates (DC Market Insights assessment)
Executive Summary: Transportation and Logistics Data Center Market Size, 2020-2035
The Global Transportation and Logistics Data Center Market size was valued at USD 8.61 billion in 2020, reached USD 11.61 billion in 2025, and is anticipated to reach USD 25.43 billion by 2035, at a CAGR of 8.16% during the forecast period. Growth was 6.17% a year from 2020 to 2025, held back by pandemic-era cuts at airlines and rail operators; from 2025 the transport IT load in use rises from 2,450 MW to 4,300 MW and its GPU share from 5% to 23%.
| Attribute | Value |
|---|---|
| Historical period | 2020-2024 |
| Base year | 2025 |
| Forecast period | 2026-2035 |
| Market size 2025 | USD 11.61 billion |
| Market size 2026 | USD 12.74 billion |
| CAGR 2025-2035 | 8.16% |
| Market size 2035 | USD 25.43 billion |
| Segments covered | Component, deployment model, workload, end user, region, 12 countries |
Owned core data centers of transport operators barely grow, from USD 3.14 billion to USD 3.29 billion (0.45% a year), while public cloud rises to USD 13.16 billion and colocation to USD 6.11 billion.
Which Data Centers Count in the Transportation and Logistics Data Center Market?
The Transportation and Logistics Data Center Market counts USD 11.61 billion of 2025 spending on data center capacity that transport and logistics operators own, colocate or rent to run their own networks and services.
Included: data centers and computer rooms of airlines, airports and air navigation service providers; railway and public transit operators; container shipping lines, terminal operators and port authorities; parcel, express and postal carriers; freight forwarders, trucking and contract logistics firms; and travel technology and mobility platforms (global distribution systems, booking platforms, ride-hailing and delivery apps). The estimate covers owned core data centers, edge compute rooms at hubs, sorting centers, terminals and depots, colocation these buyers lease, public cloud infrastructure they rent, and the IT hardware, electrical and mechanical infrastructure and fit-out inside owned and colocated sites.
Excluded: onboard computers in vehicles, aircraft and ships; transport management and warehouse software licences; government transport ministries and customs systems (counted in the Government Data Center Market); retailers’ own warehouses (counted in the Retail Data Center Market); automotive manufacturers; and logistics services sold to data center builders. Electricity bills are excluded.
How the segments fit together: every segment table splits the same USD 11.61 billion for 2025 and USD 25.43 billion for 2035 in a different way: by component, by deployment model, by workload and by end user, then by five regions and 12 countries.
Why Do Transportation and Logistics Data Center Market Estimates Differ?
The DC Market Insights estimate of USD 12.74 billion for 2026 counts only data center capacity that transport and logistics operators use for their own services. Broader definitions add transport and logistics software, onboard vehicle and aircraft computing, intelligent transport systems run by road authorities, or the logistics services that move equipment to data center sites, and they come out several times larger. Narrower definitions count only owned server rooms and miss the cloud bills that now carry reservation, tracking and dispatch systems.
| Element | In this report | Why |
|---|---|---|
| Public cloud rented by carriers, airports, ports and travel platforms | Yes, USD 5.44 billion in 2025 | It replaces owned reservation and dispatch sites |
| Edge compute rooms at hubs, terminals and depots | Yes, USD 872.65 million in 2025 | Owned and run by the operator |
| Colocation leased by transport buyers | Yes, USD 952.56 million of fees in 2025 | Sites such as disaster-recovery halls |
| Onboard vehicle, aircraft and ship computers | No | Not data center capacity |
| Transport and logistics software licences | No | Software, not capacity |
| Government transport and customs systems | No | Counted in the government data center market |
Buyer groups inside the estimate run from global integrators to regional trucking firms, small freight forwarders and single-airport operators that rent all their capacity; India alone had more than 614 firms registered on its Unified Logistics Interface Platform (ULIP) by September 2023, according to the Press Information Bureau. Sibling verticals with the same method include the Manufacturing Data Center Market.
Market Drivers: Why Are Carriers and Ports Buying More Data Center Capacity?
Three forces explain most of the growth from USD 11.61 billion in 2025 to USD 25.43 billion in 2035: transaction volumes, mandatory digital freight and border data, and cybersecurity rules that now name transport operators.
China’s 198.95 Billion Parcels and 4.7 Billion Air Passengers Set the Transaction Load
China’s State Post Bureau counted 198.95 billion express parcels in 2025, 13.6% more than in 2024, with express revenue of RMB 1.5 trillion (State Post Bureau, January 2026), and the International Civil Aviation Organization (ICAO) counted 4.7 billion passengers on scheduled flights in 2024, up 7.9%, and 9,098 billion revenue passenger-kilometres (ICAO Annual Report 2024). Every parcel scan and booking is a database write in a tracking or reservation system, so parcel and express carriers are the largest end user at USD 2.79 billion in 2025, growing 8.60% a year.
Paperless Freight and Border Data: eFTI From July 2027, Entry/Exit Biometrics From October 2025
Under the EU electronic freight transport information (eFTI) Regulation (EU) 2020/1056, authorities in every Member State must accept freight data shared through certified eFTI platforms from 9 July 2027 and may start doing so from January 2026 (European Commission Directorate-General for Mobility and Transport, January 2025). The EU Entry/Exit System (EES) started on 12 October 2025 and registers fingerprints and facial images of non-EU travellers at external borders, and the maritime single window under the International Maritime Organization (IMO) Convention on Facilitation of International Maritime Traffic (FAL) has been mandatory since 1 January 2024, according to the European Commission and IMO. These mandates push Europe’s transport data center spending from USD 2.90 billion in 2025 to USD 5.72 billion in 2035.
Cyber Rules Now Name Rail, Ports and Airlines: NIS2, TSA and a 24-Month Coast Guard Deadline
The EU Network and Information Security Directive (NIS2) has applied to transport as a sector of high criticality since 18 October 2024, according to the European Commission; the U.S. Transportation Security Administration (TSA) proposed in November 2024 to make its rail cybersecurity directives permanent for just under 300 surface transport operators at an estimated USD 2.16 billion over 10 years (Federal Register, November 2024); and the U.S. Coast Guard rule for the marine transportation system took effect on 16 July 2025 and gives port and vessel operators 24 months to file a cybersecurity plan (Federal Register, January 2025). Rules that ask for tested recovery move workloads into a second region or a colocation hall, which is why colocation grows 10.95% a year.
Market Trends: Where Are Transport Operators Moving Their Systems?
Transport buyers are leaving owned core data centers: public cloud grows 9.24% a year and edge sites 12.66%, against 0.45% for owned core sites.
Sabre Shut 19 Data Centers and Amadeus Moved 100% of Its Workloads to Azure
Sabre decommissioned 19 data centers, moved more than 40,000 servers to Google Cloud and saves more than USD 150 million a year, with 99% of its compute now in the cloud, according to Google Cloud’s Sabre case study, and Sabre’s annual report on Form 10-K for 2025 says the migration has caused cost and disruption. Amadeus announced its Microsoft partnership in February 2021 after decommissioning its mainframes in 2017, moved more than 400 high-performance applications to Azure by December 2021 and finished the move in 2026. Travel technology and mobility platforms spend USD 1.51 billion in 2025, most of it on rented capacity.
Deutsche Bahn Sold Its Data Centre Building, and Maersk, Grab and Uber Picked Strategic Clouds
Deutsche Bahn’s IT arm DB Systel sold the group’s data centre building at the end of 2017 and finished moving its IT to the cloud two years ahead of plan in October 2020, including 27 SAP applications on about 370 Amazon EC2 instances with a 10% cut in infrastructure cost, according to DB Systel. A.P. Moller-Maersk named Azure its strategic cloud platform in June 2023, Grab chose Azure as its preferred cloud in October 2018, and Uber began moving workloads from its own data centers to Oracle Cloud Infrastructure and Google Cloud, where its Hadoop estate held more than 1 exabyte on tens of thousands of servers in each of two regions (Uber, May 2024). Cloud infrastructure services already take 46.8% of 2025 value.
Shipping Lines Fund AI: CMA CGM’s EUR 100 Million Model Deal and 55 Live Projects
CMA CGM signed a five-year, EUR 100 million partnership with Mistral AI in April 2025 inside a EUR 500 million group commitment to AI, and had more than 55 AI projects live by May 2026, according to CMA CGM. DC Market Insights prices GPU capacity at USD 8.20 million per MW-year of servers against USD 2.45 million for conventional capacity, so analytics and AI rises from 13.0% of 2025 value to 28.0% by 2035.
Market Challenges and Restraints: What Slows Transport Data Center Spending?
Outage risk and legacy systems hold the market back: corporate and back-office IT, USD 2.21 billion in 2025, grows only 2.40% a year.
One Faulty Update Cost Delta About USD 550 Million and 7,000 Flights
Delta’s 8-K filing of August 2024 says the 19 July 2024 outage caused about 7,000 cancellations over five days, and U.S. Department of Transportation data show 2.9% of U.S. flights were cancelled in July 2024 against 1.7% for the year to date. The United Kingdom Civil Aviation Authority (CAA) review of the 28 August 2023 NATS flight-planning failure counted more than 700,000 passengers affected, 300,000 of them by cancellations (CAA, November 2024). Operators answer with duplicated sites and slower, tested change cycles, which keep spending at USD 4.74 million per MW in 2025 even where capacity does not grow.
Legacy Databases and Mainframes Slow the Move: FAA’s NOTAM Files and FedEx’s Mainframe Exit
The U.S. Federal Aviation Administration (FAA) found that its 11 January 2023 Notice to Air Missions (NOTAM) outage started when contract staff deleted files while synchronising the primary and backup databases (FAA, January 2023), and FedEx’s annual report on Form 10-K for the year to 31 May 2026 still describes a transition from mainframe computing to cloud-based systems. Owned electrical and mechanical infrastructure therefore grows only 1.36% a year to USD 670.80 million in 2035 as old halls are run down rather than rebuilt.
Market Opportunities: Where Is New Transport Computing Demand?
Edge capacity at hubs and ports and AI capacity are the two openings, worth USD 2.88 billion and USD 7.12 billion by 2035.
Air Traffic Control Rebuild: A USD 12.5 Billion U.S. Down Payment
The FAA Reauthorization Act of 2024 was signed on 16 May 2024, and the 2025 budget law gives USD 12.5 billion as a down payment on a new U.S. air traffic control system, according to the U.S. Department of Transportation (June 2025). Airport, airline and air navigation systems sit in the airlines and airports segment, which grows from USD 2.55 billion to USD 4.83 billion, and North America remains the largest region at USD 7.88 billion in 2035.
India’s Logistics Platform Links 34 Systems as Logistics Costs Sit at 7.97% of GDP
India’s National Logistics Policy of September 2022 set up ULIP, which integrates 34 logistics digital systems across ministries, and a 2025 assessment for the Department for Promotion of Industry and Internal Trade put India’s logistics costs at about 7.97% of gross domestic product (GDP), according to the Press Information Bureau. India is the fastest large country, growing 15.52% a year from USD 287.97 million to USD 1.22 billion; see the Edge Data Center Market for the supply of hub-side sites.
How Much Does a Transport Operator Spend per MW of Data Center Capacity?
Transport and logistics buyers spent USD 4.74 million per MW of IT load in use in 2025, DC Market Insights estimates, rising to USD 5.91 million in 2035 as GPU capacity takes a larger share.
| Year | IT load in use (MW) | Market size | Spending per MW in use |
|---|---|---|---|
| 2020 | 2,100 | USD 8.61 billion | USD 4.10 million |
| 2025 | 2,450 | USD 11.61 billion | USD 4.74 million |
| 2030 | 3,250 | USD 17.97 billion | USD 5.53 million |
| 2035 | 4,300 | USD 25.43 billion | USD 5.91 million |
Public price anchors: Sabre’s move of more than 40,000 servers saves more than USD 150 million a year, about USD 3,750 per server a year; Delta’s July 2024 outage cost about USD 550 million, or roughly USD 78,600 per cancelled flight; and TSA puts the cost of its proposed surface cyber rule at about USD 2.16 billion over 10 years for just under 300 operators, about USD 0.72 million per operator a year. DC Market Insights uses USD 180 per kilowatt (kW)-month for transport colocation in 2025, a DC Market Insights estimate.
Which Rules and Standards Shape Transport and Logistics Data Centers?
Eight rule sets shape where the USD 11.61 billion of 2025 spending goes: cybersecurity law, digital freight and border data, shipping emissions data and EU energy reporting.
- EU NIS2 Directive (EU) 2022/2555: transposition due 17 October 2024 and NIS1 repealed from 18 October 2024; transport is a sector of high criticality (Source: European Commission).
- TSA rail security directive of 18 October 2022 and the proposed rule ‘Enhancing Surface Cyber Risk Management’ of 7 November 2024 (Source: TSA, Federal Register).
- U.S. Coast Guard rule ‘Cybersecurity in the Marine Transportation System’: effective 16 July 2025, Cybersecurity Plan within 24 months (Source: Federal Register).
- EU Data Act (Regulation (EU) 2023/2854): applies from 12 September 2025, including cloud switching duties (Source: Polish data protection authority UODO).
- eFTI Regulation (EU) 2020/1056: certified platforms accepted from January 2026, mandatory acceptance from 9 July 2027 (Source: European Commission).
- EU Emissions Trading System for shipping: ships of 5,000 gross tonnage and above since January 2024, allowances for 40%, 70% and 100% of emissions in 2025, 2026 and 2027 (Source: European Commission).
- IMO FAL Convention: maritime single window mandatory from 1 January 2024 (Source: IMO).
- EU Delegated Regulation 2024/1364: data centers of 500 kW and more, including operator-owned sites, report energy and water data each year (Source: European Commission).
Transportation and Logistics Data Center Market Segmentation: Which Segment Spends Most?
The largest component is cloud infrastructure services at USD 5.44 billion in 2025, parcel and express carriers the largest end user at USD 2.79 billion, and operations and dispatch systems the largest workload at USD 3.60 billion.
By Component
Cloud infrastructure services hold 46.8% of 2025 value; colocation services grow fastest at 9.50% a year.
| Component | 2025 (USD million) | Share 2025 | 2035 (USD million) | CAGR 2025-2035 |
|---|---|---|---|---|
| Cloud Infrastructure Services | USD 5,437.53 million | 46.8% | USD 13,163.67 million | 9.24% |
| IT Hardware | USD 4,292.40 million | 37.0% | USD 8,636.35 million | 7.24% |
| Colocation Services | USD 952.56 million | 8.2% | USD 2,359.74 million | 9.50% |
| Electrical and Mechanical Infrastructure | USD 586.04 million | 5.0% | USD 670.80 million | 1.36% |
| Construction and Fit-Out | USD 343.00 million | 3.0% | USD 602.00 million | 5.79% |
By Deployment Model
Public cloud holds 46.8% of 2025 value; edge sites at hubs and ports grow fastest at 12.66% a year.
| Deployment Model | 2025 (USD million) | Share 2025 | 2035 (USD million) | CAGR 2025-2035 |
|---|---|---|---|---|
| Public Cloud | USD 5,437.53 million | 46.8% | USD 13,163.67 million | 9.24% |
| Owned Core Data Centers | USD 3,141.55 million | 27.1% | USD 3,286.03 million | 0.45% |
| Colocation | USD 2,159.80 million | 18.6% | USD 6,107.59 million | 10.95% |
| Edge Sites at Hubs and Ports | USD 872.65 million | 7.5% | USD 2,875.27 million | 12.66% |
By Workload
Analytics and AI grows 16.78% a year and becomes the largest workload by 2035 with 28.0% of value.
| Workload | 2025 (USD million) | Share 2025 | 2035 (USD million) | CAGR 2025-2035 |
|---|---|---|---|---|
| Operations and Dispatch Systems | USD 3,599.57 million | 31.0% | USD 6,612.47 million | 6.27% |
| Booking and Customer Platforms | USD 2,554.54 million | 22.0% | USD 4,577.86 million | 6.01% |
| Corporate and Back-Office IT | USD 2,206.19 million | 19.0% | USD 2,797.58 million | 2.40% |
| Tracking and IoT Telemetry | USD 1,741.73 million | 15.0% | USD 4,323.54 million | 9.52% |
| Analytics and AI | USD 1,509.50 million | 13.0% | USD 7,121.12 million | 16.78% |
By End User
Parcel and express carriers hold 24.0% of 2025 value; travel technology and mobility platforms grow fastest at 8.96% a year.
| End User | 2025 (USD million) | Share 2025 | 2035 (USD million) | CAGR 2025-2035 |
|---|---|---|---|---|
| Parcel and Express Carriers | USD 2,786.77 million | 24.0% | USD 6,358.14 million | 8.60% |
| Airlines and Airports | USD 2,554.54 million | 22.0% | USD 4,832.19 million | 6.58% |
| Freight Forwarding and Contract Logistics | USD 2,090.08 million | 18.0% | USD 4,832.19 million | 8.74% |
| Travel Technology and Mobility Platforms | USD 1,509.50 million | 13.0% | USD 3,560.56 million | 8.96% |
| Maritime Shipping and Ports | USD 1,393.38 million | 12.0% | USD 3,051.91 million | 8.16% |
| Rail and Public Transit | USD 1,277.27 million | 11.0% | USD 2,797.58 million | 8.16% |
DC Exclusive: Transport IT Resilience Risk Register, 3 Outages and 5 Rules
The Transport IT Resilience Risk Register, 3 Outages and 5 Rules is a DC Market Insights model built on 9 inputs from regulator, government and company filings; it lists three transport system failures between 2023 and 2024 and five rules dated 2024 to 2027 that turn those failures into spending on second sites, colocation and tested recovery.
| Event or rule | Date | Measured impact | Data center response |
|---|---|---|---|
| FAA NOTAM outage (United States) | 11 Jan 2023 | Files deleted while synchronising primary and backup databases | Backup sites that fail with the primary |
| NATS flight-planning failure (United Kingdom) | 28 Aug 2023 | More than 700,000 passengers affected, 300,000 by cancellations | Independent review, CAA report CAP2993 |
| CrowdStrike update at Delta Air Lines | 19 Jul 2024 | About 7,000 cancellations; USD 380 million revenue and USD 170 million expense | Endpoint change control, recovery capacity |
| EU NIS2 Directive | 18 Oct 2024 | Transport named a sector of high criticality | Tested recovery, incident reporting |
| TSA surface cyber rule (proposed) | 7 Nov 2024 | Just under 300 operators; about USD 2.16 billion over 10 years | Permanent rail cyber risk management |
| U.S. Coast Guard maritime cyber rule | 16 Jul 2025 | Cybersecurity Plan due within 24 months | Port and vessel system segmentation |
| EU Entry/Exit System | 12 Oct 2025 | Biometrics of non-EU travellers at external borders | Airport, port and rail terminal data load |
| eFTI mandatory acceptance | 9 Jul 2027 | All EU authorities accept certified platform data | Freight data platforms on resilient hosting |
The register explains the shape of the model: of the USD 13.82 billion added between 2025 and 2035, colocation adds USD 3.95 billion and public cloud USD 7.73 billion, while owned core data centers add only USD 144.48 million. DC Market Insights estimates that running a reservation, tracking or dispatch system active-active across two sites adds 35% to 60% to that system’s hosting cost, and assumes half of the largest operators reach that design by 2030.
Which Region Leads the Transportation and Logistics Data Center Market?
North America leads with USD 4.06 billion or 35.0% of 2025 value, and the Middle East and Africa grows fastest at 11.66% a year.
| Region | 2025 (USD million) | Share 2025 | 2035 (USD million) | CAGR 2025-2035 |
|---|---|---|---|---|
| North America | USD 4,064.04 million | 35.0% | USD 7,884.09 million | 6.85% |
| Asia Pacific | USD 3,599.57 million | 31.0% | USD 9,028.56 million | 9.63% |
| Europe | USD 2,902.88 million | 25.0% | USD 5,722.33 million | 7.02% |
| Latin America | USD 580.58 million | 5.0% | USD 1,398.79 million | 9.19% |
| Middle East and Africa | USD 464.46 million | 4.0% | USD 1,398.79 million | 11.66% |
North America
North America reaches USD 7.88 billion by 2035 at 6.85% a year, carried by parcel networks, airline recovery spending after the July 2024 outage and the U.S. air traffic control rebuild.
Asia Pacific
Asia Pacific grows from USD 3.60 billion to USD 9.03 billion at 9.63% a year; China’s 198.95 billion parcels in 2025 make it the second-largest country at USD 1.44 billion.
Europe
Europe grows 7.02% a year to USD 5.72 billion as eFTI, EES and shipping emissions reporting add data load; Eurostat counted 1.1 billion EU air passengers and 8.7 billion EU rail trips in 2024.
Latin America
Latin America holds USD 580.58 million in 2025 and grows 9.19% a year, with Brazil the largest country at USD 243.84 million (DC Market Insights estimate).
Middle East and Africa
Middle East and Africa grows from USD 464.46 million to USD 1.40 billion, an 11.66% CAGR, led by the United Arab Emirates at 12.98% a year as hub airports, airlines and port groups move systems into in-country cloud regions (DC Market Insights estimate).
Top 12 Countries in the Transportation and Logistics Data Center Market
The United States leads with USD 3.56 billion in 2025, and India is the fastest large country at 15.52% a year.
| Rank | Country | Region | 2025 (USD million) | 2035 (USD million) | CAGR 2025-2035 |
|---|---|---|---|---|---|
| 1 | United States | North America | USD 3,556.03 million | USD 6,819.74 million | 6.73% |
| 2 | China | Asia Pacific | USD 1,439.83 million | USD 3,611.42 million | 9.63% |
| 3 | Japan | Asia Pacific | USD 647.92 million | USD 1,354.28 million | 7.65% |
| 4 | Germany | Europe | USD 580.58 million | USD 1,115.85 million | 6.75% |
| 5 | United Kingdom | Europe | USD 493.49 million | USD 944.18 million | 6.70% |
| 6 | Canada | North America | USD 406.40 million | USD 827.83 million | 7.37% |
| 7 | France | Europe | USD 377.37 million | USD 715.29 million | 6.60% |
| 8 | India | Asia Pacific | USD 287.97 million | USD 1,218.86 million | 15.52% |
| 9 | Netherlands | Europe | USD 261.26 million | USD 543.62 million | 7.60% |
| 10 | South Korea | Asia Pacific | USD 251.97 million | USD 632.00 million | 9.63% |
| 11 | Brazil | Latin America | USD 243.84 million | USD 587.49 million | 9.19% |
| 12 | United Arab Emirates | Middle East and Africa | USD 111.47 million | USD 377.67 million | 12.98% |
The 12 countries hold 74.6% of 2025 value. The Netherlands ranks ninth at USD 261.26 million because Rotterdam handles about 230,000 sea-going port calls a year, around 80% of them settled automatically, according to the Port of Rotterdam.
Forecast Scenarios: How Large Could the Transportation and Logistics Data Center Market Be in 2035?
The 2035 Transportation and Logistics Data Center Market ranges from USD 21.50 billion in the low case to USD 29.73 billion in the high case, around the USD 25.43 billion base case.
| Scenario | 2035 market size | CAGR 2025-2035 | Assumption |
|---|---|---|---|
| Low | USD 21.50 billion | 6.36% | GPU share reaches 16% of transport IT load; freight volumes stay flat |
| Base | USD 25.43 billion | 8.16% | GPU share 23%; IT load 4,300 MW |
| High | USD 29.73 billion | 9.86% | GPU share 30%; resilience rules drive dual-site designs at most large operators |
Low Scenario
USD 21.50 billion by 2035 (6.36% a year) if maritime trade stays near the 0.5% growth UNCTAD expects for 2025 and carriers delay AI projects.
Base Scenario
USD 25.43 billion by 2035 (8.16% a year), with transport IT load rising from 2,450 MW to 4,300 MW.
High Scenario
USD 29.73 billion by 2035 (9.86% a year) if parcel volumes keep growing at China’s 13.6% pace and NIS2, TSA and Coast Guard rules push dual-site designs.
Key Players and Market Share: Who Supplies Transport and Logistics Data Centers?
Amazon Web Services, Microsoft Azure and Google Cloud hold about 65% of the USD 5.44 billion cloud segment in 2025, a DC Market Insights estimate based on the providers named in operator migrations (Azure at Amadeus, Maersk and Grab; Google Cloud at Sabre; Amazon Web Services at Deutsche Bahn); owned-site hardware is less concentrated.
- Amazon Web Services
- Microsoft Azure
- Google Cloud
- Oracle Cloud Infrastructure
- Alibaba Cloud
- IBM
- Dell Technologies
- Hewlett Packard Enterprise
- Lenovo
- Cisco
- NVIDIA
- Equinix
- Digital Realty
- NTT DATA
- Kyndryl
- Vertiv
- Schneider Electric
Supplier Facts, 2017-2026
Microsoft Azure now hosts 100% of the workloads Amadeus once ran in its own data centers (Amadeus, September 2026) and is the strategic cloud of Maersk (Maersk, June 2023); Google Cloud took Sabre’s 40,000 servers (Google Cloud); Amazon Web Services runs Deutsche Bahn’s SAP estate on about 370 EC2 instances and 260 terabytes of block storage (DB Systel, November 2020); and Oracle Cloud Infrastructure runs thousands of Uber microservices (Oracle, September 2024). Mainframe estates, long an IBM stronghold, remain in parcel back ends, as FedEx’s 2026 annual report shows.
Recent Developments in the Transportation and Logistics Data Center Market
Six dated events from 2025 and 2026 moved the Transportation and Logistics Data Center Market, which reaches USD 12.74 billion in 2026.
- In September 2026, Amadeus said 100% of the workloads previously hosted in its data centers had moved to Microsoft Azure (Source: Amadeus).
- In May 2026, CMA CGM said it had deployed more than 55 AI projects and identified over 200 use cases (Source: CMA CGM).
- In January 2026, China’s State Post Bureau reported 198.95 billion express parcels for 2025, up 13.6% (Source: State Post Bureau).
- In January 2026, EU Member State authorities could start accepting freight data from certified eFTI platforms (Source: European Commission).
- In October 2025, the EU Entry/Exit System began operations on 12 October with a six-month rollout (Source: European Commission).
- In July 2025, the U.S. Coast Guard maritime cybersecurity rule took effect on 16 July (Source: Federal Register).
Research Methodology: How DC Market Insights Sized the Transportation and Logistics Data Center Market
The USD 11.61 billion 2025 value is a bottom-up DC Market Insights model of 2,450 MW of transport and logistics IT load in use, about 5.3% of the roughly 46 gigawatts (GW) of enterprise and colocation-class capacity plus the cloud capacity these buyers rent, priced component by component; see the DC Market Insights research methodology.
Model Inputs
Transport and logistics IT load in use of 2,100, 2,450, 3,250 and 4,300 MW in 2020, 2025, 2030 and 2035; owned share 60%, 46%, 36% and 30% (of which edge sites at hubs and ports 8%, 10%, 12% and 14% of all load); colocated share 14%, 18%, 21% and 23%; public cloud the remainder; GPU share 1%, 5%, 15% and 23%. Servers cost USD 2.45 million per conventional MW-year (+1% a year) and USD 8.20 million per GPU MW-year (-1% a year) on owned and colocated MW; cloud USD 5.70 million (-1% a year) and USD 15.00 million (-3% a year) per MW-year; colocation USD 180 per kW-month (+1% a year); owned electrical and mechanical upkeep USD 0.52 million per owned MW-year; construction and fit-out USD 0.14 million per MW in use. For 2025: hardware USD 4.29 billion + cloud USD 5.44 billion + colocation USD 952.56 million + electrical and mechanical USD 586.04 million + construction USD 343.00 million = USD 11.61 billion.
Bound Checks
- Ceiling: USD 11.61 billion is 2.0% of the DC Market Insights global data center market of USD 570.04 billion in 2025, below the education share of 2.2% and the manufacturing share of 3.7%.
- Colocation ceiling: transport colocation fees of USD 952.56 million are 1.3% of the DC Market Insights Data Center Colocation Market of USD 74.46 billion in 2025.
- Per-unit check: the airlines and airports segment of USD 2.55 billion equals about USD 0.54 per scheduled passenger (4.7 billion in 2024, ICAO), and Delta’s single outage cost of about USD 550 million is 21.5% of that segment’s yearly spend.
Table of contents
- 01Introduction
- 1.1Report Description
- 1.2Key Market Statistics, 2025, 2026, 2030 and 2035
- 02Executive Summary
- 2.1Market Snapshot, 2025, 2026 and 2035
- 2.2Market Size Chart, 2020-2035
- 03Market Scope
- 3.1Included
- 3.2Excluded
- 3.3How the Segments Fit Together
- 04Why Market Estimates Differ
- 4.1Scope Table: In and Out of the DC Market Insights Estimate
- 05Market Drivers
- 5.1China's 198.95 Billion Parcels and 4.7 Billion Air Passengers Set the Transaction Load
- 5.2Paperless Freight and Border Data: eFTI From July 2027, Entry/Exit Biometrics From October 2025
- 5.3Cyber Rules Now Name Rail, Ports and Airlines: NIS2, TSA and a 24-Month Coast Guard Deadline
- 06Market Trends
- 6.1Sabre Shut 19 Data Centers and Amadeus Moved 100% of Its Workloads to Azure
- 6.2Deutsche Bahn Sold Its Data Centre Building, and Maersk, Grab and Uber Picked Strategic Clouds
- 6.3Shipping Lines Fund AI: CMA CGM's EUR 100 Million Model Deal and 55 Live Projects
- 07Market Challenges and Restraints
- 7.1One Faulty Update Cost Delta About USD 550 Million and 7,000 Flights
- 7.2Legacy Databases and Mainframes Slow the Move: FAA's NOTAM Files and FedEx's Mainframe Exit
- 08Market Opportunities
- 8.1Air Traffic Control Rebuild: A USD 12.5 Billion U.S. Down Payment
- 8.2India's Logistics Platform Links 34 Systems as Logistics Costs Sit at 7.97% of GDP
- 09Pricing Analysis
- 9.1Spending per MW, 2020-2035
- 9.2Public Price Anchors
- 10Standards and Regulation
- 10.1EU NIS2 Directive
- 10.2TSA Rail Security Directive and Proposed Surface Cyber Rule
- 10.3U.S. Coast Guard Maritime Cybersecurity Rule
- 10.4EU Data Act
- 10.5eFTI Regulation
- 10.6EU Emissions Trading System for Shipping
- 10.7IMO FAL Convention Maritime Single Window
- 10.8EU Delegated Regulation 2024/1364
- 11Market Segmentation
- 11.1By Component: Cloud Infrastructure Services, IT Hardware, Colocation Services, Electrical and Mechanical Infrastructure, Construction and Fit-Out
- 11.2By Deployment Model: Public Cloud, Owned Core Data Centers, Colocation, Edge Sites at Hubs and Ports
- 11.3By Workload: Operations and Dispatch Systems, Booking and Customer Platforms, Corporate and Back-Office IT, Tracking and IoT Telemetry, Analytics and AI
- 11.4By End User: Parcel and Express Carriers, Airlines and Airports, Freight Forwarding and Contract Logistics, Travel Technology and Mobility Platforms, Maritime Shipping and Ports, Rail and Public Transit
- 12DC Exclusive: Transport IT Resilience Risk Register
- 12.1FAA NOTAM outage (United States)
- 12.2NATS flight-planning failure (United Kingdom)
- 12.3CrowdStrike update at Delta Air Lines
- 12.4EU NIS2 Directive
- 12.5TSA surface cyber rule (proposed)
- 12.6U.S. Coast Guard maritime cyber rule
- 12.7EU Entry/Exit System
- 12.8eFTI mandatory acceptance
- 13Regional Insights
- 13.1North America
- 13.2Asia Pacific
- 13.3Europe
- 13.4Latin America
- 13.5Middle East and Africa
- 14Country Analysis
- 14.1United States
- 14.2China
- 14.3Japan
- 14.4Germany
- 14.5United Kingdom
- 14.6Canada
- 14.7France
- 14.8India
- 14.9Netherlands
- 14.10South Korea
- 14.11Brazil
- 14.12United Arab Emirates
- 15Forecast Scenarios
- 15.1Low Scenario
- 15.2Base Scenario
- 15.3High Scenario
- 16Competitive Insights
- 16.1Cloud Provider Concentration, 2025
- 16.2Amazon Web Services
- 16.3Microsoft Azure
- 16.4Google Cloud
- 16.5Oracle Cloud Infrastructure
- 16.6Alibaba Cloud
- 16.7IBM
- 16.8Dell Technologies
- 16.9Hewlett Packard Enterprise
- 16.10Lenovo
- 16.11Cisco
- 16.12NVIDIA
- 16.13Equinix
- 16.14Digital Realty
- 16.15NTT DATA
- 16.16Kyndryl
- 16.17Vertiv
- 16.18Schneider Electric
- 16.19Supplier Facts, 2017-2026
- 17Recent Developments
- 17.1Dated Events, July 2025 to September 2026
- 18Research Methodology
- 18.1Model Inputs
- 18.2Bound Checks
- Fig. 1Transportation and Logistics Data Center Market Size, 2020-2035
- Table 1Executive Summary Attributes
- Table 2Scope Table: In and Out of the Estimate
- Table 3Spending per MW, 2020-2035
- Table 4Market by Component, 2025 and 2035
- Table 5Market by Deployment Model, 2025 and 2035
- Table 6Market by Workload, 2025 and 2035
- Table 7Market by End User, 2025 and 2035
- Table 8Transport IT Resilience Risk Register, 8 Entries
- Table 9Market by Region, 2025 and 2035
- Table 10Top 12 Countries, 2025 and 2035
- Table 11Forecast Scenarios, 2035
About this report
Written by Amit Jain and reviewed by Deepti Agrawal, Senior Editor, Research. Figures are built top-down and bottom-up and reconciled before publication, with 2025 as the base year.
Read our methodologyHow we built this
- Historical period2020-2024
- Base year2025
- Forecast period2026-2035
- Sizing approachTop-down + bottom-up
Need more than the report?
Advisory on this market
Due diligence, site selection and market entry work, by the analysts who wrote this report.
See consulting servicesFrequently asked questions
USD 12.74 billion in 2026, up 9.73% from USD 11.61 billion in 2025, according to DC Market Insights estimates. The market is projected to reach USD 25.43 billion by 2035, a CAGR of 8.16% from 2025.
8.16% a year from 2025 to 2035, after 6.17% a year from 2020 to 2025, as transport IT load in use rises from 2,450 MW to 4,300 MW and its GPU share from 5% to 23%.
USD 11.61 billion was spent in 2025 on capacity that airlines, airports, railways, shipping lines, ports, parcel carriers, freight forwarders and travel and mobility platforms own, colocate or rent for their own systems. Onboard vehicle computers, software licences and government transport systems are excluded.
USD 5.44 billion, or 46.8% of 2025 spending, goes to public cloud. Sabre closed 19 data centers and moved more than 40,000 servers to Google Cloud, and Amadeus said in September 2026 that 100% of its former data center workloads run on Microsoft Azure.
About USD 550 million: USD 380 million of lost revenue and USD 170 million of extra expense in the September 2024 quarter, after about 7,000 flight cancellations over five days, according to Delta’s filings with the U.S. Securities and Exchange Commission.
Analytics and AI grows fastest at 16.78% a year to USD 7.12 billion by 2035. Among deployment models, edge sites at hubs and ports lead at 12.66%, and colocation grows 10.95%.
North America, with USD 4.06 billion or 35.0% of 2025 value. The Middle East and Africa grows fastest at 11.66% a year, and India is the fastest large country at 15.52%.
USD 4.74 million per MW in use in 2025, rising to USD 5.91 million in 2035, DC Market Insights estimates. Colocation for transport buyers costs about USD 180 per kW-month in 2025.
Four dates matter: NIS2 has covered EU transport since 18 October 2024, the U.S. Coast Guard maritime cyber rule took effect on 16 July 2025, the EU Entry/Exit System started on 12 October 2025, and eFTI freight data acceptance is mandatory from 9 July 2027.
USD 12.74 billion in 2026 counts only data center capacity that transport operators use for their own systems. Estimates that add transport software, onboard vehicle computing, road-authority traffic systems or logistics services sold to data center builders come out several times larger.
Get this report
How do I get the full report?
Request a quote; we reply by email within one business day.
How and when will I receive the report?
By email, within 24–48 business hours of payment.
How can I pay?
Once you accept the quote, we email you a secure payment link.
Can I see a sample first?
Yes. Request a free sample and we will email it to you.
Can the report be tailored to my needs?
Yes. We can add countries, segments or data cuts. Talk to an analyst about the scope you need.
Can I get an invoice or pay against a purchase order?
Write to sales@dcmarketinsights.com and our team will help.