
Agriculture Data Center Market Size, Share & Forecast to 2035
Market at a glance
The Agriculture Data Center market was worth USD 2,780.0 million in 2025 and is forecast to reach USD 7,820.0 million by 2035, growing at a 10.9% CAGR.
 By Amit Jain, Senior Consultant, ICT & Emerging Technologies
 Reviewed by Deepti Agrawal
Last updated 10 Nov 2026
Base year 2025 PDF + Excel
Key findings
Deere's 1 Million Connected Machines and 500 Million Engaged Acres
Bayer Runs 500 Model Configurations in an Agentic Decision Engine
India's AgriStack Reaches 10.31 Crore Farmer IDs
What is inside the report
- 01Introduction
- 02Key Market Statistics
- 03Executive Summary
- 04Market Scope
- 05Why Estimates Differ
- 06Market Drivers
- 07Market Trends
- 08Market Challenges and Restraints
- 09Market Opportunities
- 10Pricing Analysis
- 22chapters
- 2020-2024Historical period
- 2026-2035Forecast period
- —Companies profiled
Segmentation
Recent developments
AWS documented Bayer Crop Science's agentic decision engine with more than 500 model configurations (Source: Amazon Web Services).
Corteva reported more than 5 petabases of genomic sequence data and 145 AI model solutions at its Investor Day (Source: Corteva).
India reported more than 10.31 crore AgriStack farmer IDs (Source: Press Information Bureau).
Nutrien guided about USD 400 million of 2026 investing capital to proprietary products, network optimisation and digital (Source: Nutrien).
Deere and Company reported about 1 million connected machines, and the EU confirmed 30 December 2026 as the deforestation-rule start for large operators (Source: Deere and Company; European Commission).
Syngenta Group opened Cropwise to outside developers (Source: Syngenta Group).
Full analysis
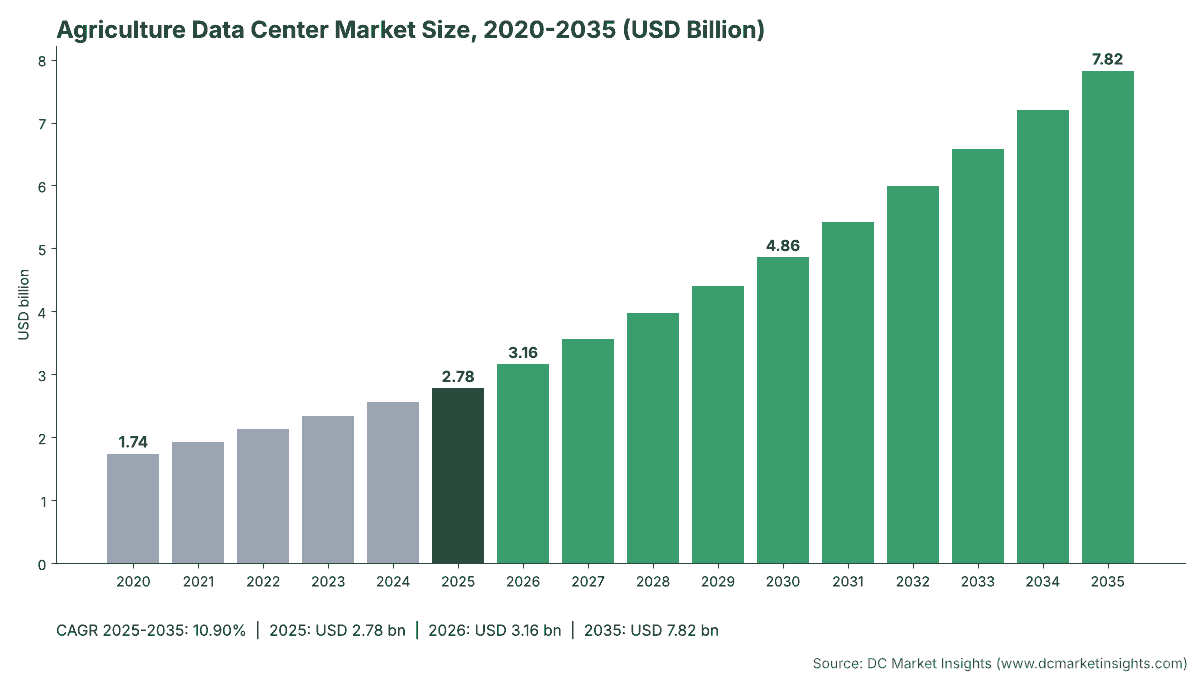
The Agriculture Data Center Market is valued at USD 3.16 billion in 2026 and is projected to reach USD 7.82 billion by 2035, up from USD 2.78 billion in 2025, a CAGR of 10.90% from 2025 to 2035 (DC Market Insights estimate). Farm data now travels from the cab to the hall: Deere and Company counts about 1 million connected machines and nearly 500 million engaged acres, and its Form 10-K says the John Deere Operations Center “stores substantial volumes of data at the edge and within cloud environments” in data centers that are often owned by third parties (Deere and Company Form 10-K, December 2025). Breeding has turned into a compute problem as well: Corteva reported more than 5 petabases of genomic sequence data and 145 artificial intelligence (AI) model solutions at its September 2026 Investor Day (Corteva, September 2026). The 2025 receipt: 650 megawatts (MW) of information technology (IT) load in use by agriculture companies x USD 4.28 million of spending per MW = USD 2.78 billion, of which USD 1.93 billion is servers, storage and network gear and USD 519.48 million is colocation and hosting fees. Agricultural AI and computer vision is the fastest workload at 26.29% a year, and the Middle East and Africa is the fastest region at 14.49% as Gulf food-security programmes fund controlled-environment farms and grain logistics systems.
Key Market Statistics: How Big Is the Agriculture Data Center Market in 2026?
DC Market Insights values agriculture data center spending at USD 3.16 billion in 2026, 13.70% above 2025, because machine telemetry, genomic pipelines and GPU (graphics processing unit) racks for crop imagery all add load in the same year.
- Agriculture data center market size 2025: USD 2.78 billion
- Market size 2026: USD 3.16 billion
- Market size 2030: USD 4.86 billion
- Market size 2035: USD 7.82 billion
- CAGR 2025-2035: 10.90% (low case 8.95%, high case 12.68%)
- Largest component: IT hardware, USD 1.93 billion or 69.3% of 2025 value
- Fastest workload: agricultural AI and computer vision, 26.29% a year to USD 1.72 billion by 2035
- Largest end user: farm equipment manufacturers, USD 833.86 million in 2025; fastest end user: farms, cooperatives and agtech platforms at 14.14%
- Leading region: North America, USD 1.06 billion or 38.0% of 2025 value; fastest region: Middle East and Africa at 14.49%
- Largest country: United States, USD 889.45 million in 2025; fastest large country: India at 17.61%
- Market leaders: Deere and Company, Bayer, Corteva and Syngenta Group as the heaviest agricultural compute users, Microsoft and Amazon Web Services as platform hosts, and Dell Technologies and Hewlett Packard Enterprise in owned halls (DC Market Insights assessment)
Executive Summary: Agriculture Data Center Market Size, 2020-2035
The Global Agriculture Data Center Market size was valued at USD 1.74 billion in 2020, reached USD 2.78 billion in 2025, and is anticipated to reach USD 7.82 billion by 2035, at a CAGR of 10.90% during the forecast period. Spending grew 9.81% a year from 2020 to 2025, faster than agriculture itself: the World Bank puts world agriculture, forestry and fishing value added at about USD 4.75 trillion in 2025, 4.0% of world gross domestic product (GDP), so the agriculture data center market equals only 0.06% of the sector’s output.
| Attribute | Value |
|---|---|
| Historical period | 2020-2024 |
| Base year | 2025 |
| Forecast period | 2026-2035 |
| Market size 2025 | USD 2.78 billion |
| Market size 2026 | USD 3.16 billion |
| CAGR 2025-2035 | 10.90% |
| Market size 2035 | USD 7.82 billion |
| Segments covered | Component, end user, workload, deployment model, region, 12 countries |
Agriculture companies are leaving their own server rooms more slowly than retailers, but the direction is the same: corporate data centers grow only 4.38% a year, from USD 1.22 billion in 2025 to USD 1.88 billion in 2035, while colocation and hosted private cloud rises from USD 1.00 billion to USD 4.14 billion at 15.27% a year. Field and facility edge, the servers in grain elevators, seed plants, dealer workshops and fertilizer terminals, reaches USD 1.80 billion because rural links fail and machines still have to log every pass.
What Counts as Agriculture Data Center Spending?
USD 2.78 billion in 2025: the agriculture data center market is the data center capacity that farm equipment makers, crop science and seed companies, commodity traders, fertilizer producers, large farms, cooperatives and agtech platforms own or lease for their own operations, priced as yearly spending.
Included: servers, storage and network equipment in corporate data centers, colocation cages and facility server rooms; colocation and hosted private cloud fees paid by agriculture companies; electrical and mechanical infrastructure (uninterruptible power supply (UPS), cooling, switchgear) at owned sites; construction and fit-out of new halls and facility IT rooms; GPU racks for crop imagery, genomic prediction and machine-vision model training.
Excluded: public cloud subscription fees, farm management software licences, telematics modules and displays on tractors, drones, sensors in fields, satellite connectivity charges, electricity bills, food and beverage processing plants (counted in the Manufacturing Data Center Market) and government agriculture ministries.
How the segments fit together: every dimension sums to the same total in every year. Component splits the money by what is bought; end user by who buys it; workload by what it runs; deployment model by where it sits.
Why Do Agriculture Data Center Market Estimates Differ?
USD 3.16 billion in 2026 counts only data center capacity that agriculture companies own or lease; wider definitions add precision-farming hardware, farm software and connectivity, and come out many times larger.
Broader “smart agriculture” or “digital agriculture” estimates fold in guidance receivers, yield monitors, field sensors, drones, irrigation controllers and farm management subscriptions. Those are real costs for a grower, but they are devices and software, not data center capacity. Some estimates also count the data centers of food processors and grocery chains; DC Market Insights places those in the manufacturing and retail editions, so no dollar is counted twice.
| Element | In this estimate | Why |
|---|---|---|
| Servers, storage and network gear of agriculture companies | Yes, USD 1.93 billion (2025) | Capacity owned for operations |
| Colocation and hosted private cloud fees | Yes, USD 519.48 million | Leased capacity |
| Owned-site power, cooling and fit-out | Yes, USD 332.80 million | Facility spending |
| Public cloud subscriptions | No | Counted in cloud provider revenue |
| Tractor displays, sensors and drones | No | Field devices, not data center capacity |
| Food processing plants | No | Manufacturing edition |
In-scope buyers include small and mid-sized agtech firms and cooperatives, which lease rather than build: they are the main reason the farms, cooperatives and agtech platforms segment grows 14.14% a year.
Market Drivers: What Is Pushing Agriculture Companies to Buy More Data Center Capacity?
Three agriculture-specific drivers lift precision farming and machine data workloads from USD 722.68 million in 2025 to USD 2.11 billion by 2035.
Deere’s 1 Million Connected Machines and 500 Million Engaged Acres
Deere and Company’s Business Impact Report for fiscal 2025 (January 2026) counts about 1 million connected machines, more than 400,000 unique monthly users of the John Deere Operations Center and a 2030 aim to lift highly engaged acres from 147 million to 300 million. Its See and Spray technology covered more than 5 million acres in 2025, and every sprayed acre returns camera data for model retraining. Deere’s software amortisation rose to USD 227 million in fiscal 2025 from USD 144 million in fiscal 2023 (Deere and Company Form 10-K). DC Market Insights estimates that farm equipment manufacturers spend USD 833.86 million on data center capacity in 2025.
Genomic Breeding at Petabase Scale
Corteva reported more than 5 petabases of genomic sequence data, about 20 million predicted gene modifications and 145 AI model solutions (Corteva Investor Day, September 2026). Gene-editing pipelines run on GPU and high-memory clusters, so genomics and breeding research grows from USD 389.13 million in 2025 to USD 1.17 billion by 2035 at 11.67% a year.
EU Satellite Checks Under the Common Agricultural Policy
Commission Implementing Regulation (EU) 2022/1173 requires every Common Agricultural Policy (CAP) area-aid condition that Copernicus Sentinel data can check to pass through the Area Monitoring System, and from 1 January 2025 geotagged photos count too (EUR-Lex, Regulation (EU) 2022/1173). The European Commission reported that more than 3 million hectares of claims were corrected through area monitoring in 2024 (European Commission, September 2025). Cooperatives and farm advisers now hold parcel-level image archives, which feeds the European segment of USD 722.68 million in 2025.
Market Trends: How Is Agricultural Computing Changing?
Agricultural AI and computer vision grows from USD 166.77 million in 2025 to USD 1.72 billion by 2035, the fastest workload at 26.29% a year.
Bayer Runs 500 Model Configurations in an Agentic Decision Engine
Amazon Web Services (AWS) documented in October 2026 that Bayer Crop Science’s decision engine manages more than 500 model configurations and 22 specialist agents in production. Bayer had already moved its digital-farming core to Microsoft Azure under a November 2021 partnership, and Climate FieldView reached more than 250 million subscribed acres in 23 countries (Bayer, November 2024). Crop science and seed companies spend USD 611.50 million in 2025.
Syngenta Opens Cropwise to Outside Developers
Syngenta Group opened its Cropwise platform, which covers more than 70 million hectares in over 30 countries, to outside developers in November 2025 (Syngenta Group, November 2025). Open platforms move third-party agronomy apps into the host’s hall, which is why colocation and hosted private cloud grows 15.27% a year.
China Targets 32% Farm Production Informatisation by 2028
China’s Ministry of Agriculture and Rural Affairs set a target for the agricultural production informatisation rate of 30% or more by 2026 and 32% or more by 2028 in its National Smart Agriculture Action Plan 2024-2028 (October 2024). China’s agriculture data center spending rises from USD 222.36 million in 2025 to USD 782.06 million in 2035.
Market Challenges and Restraints: What Slows Agriculture Data Center Investment?
Thin farm adoption and long equipment cycles hold supply chain trading and ERP workloads to 6.49% a year, the slowest workload.
Only 22% of U.S. Farms Used Precision Agriculture in 2025
The U.S. Department of Agriculture’s National Agricultural Statistics Service (USDA NASS) reported that 22% of farms used precision agriculture practices in 2025, down from 27% in 2023, even though 85% of farms had internet access (USDA NASS, August 2025). The Economic Research Service found variable-rate technology on only 5% to 25% of planted acreage for winter wheat, cotton, sorghum and rice (USDA ERS, February 2023). Data volume is concentrated on large farms, which caps the farm-side demand that reaches data centers.
Commodity Traders Upgrade ERP in Phases
ADM said in its 2025 Form 10-K that it is upgrading its technology platforms, including enterprise resource planning (ERP) systems, in phases over several years, and its research and development spending fell to USD 246 million in 2025 from USD 269 million in 2024. Agricultural commodity traders and processors therefore grow only 8.34% a year, from USD 667.09 million in 2025.
Market Opportunities: Where Will New Agriculture Data Center Demand Come From?
India and EU traceability rules open the two largest new pools, worth about USD 351.93 million for India alone by 2035.
India’s AgriStack Reaches 10.31 Crore Farmer IDs
India’s Union Cabinet approved the Digital Agriculture Mission with an outlay of Rs 2,817 crore in September 2024 (Press Information Bureau, September 2024), and the Ministry of Agriculture and Farmers Welfare reported more than 10.31 crore farmer IDs by 3 August 2026 (Press Information Bureau, August 2026). India’s agriculture data center spending rises from USD 69.49 million in 2025 to USD 351.93 million by 2035 at 17.61% a year, the fastest of the 12 countries.
EU Deforestation Rules Require Plot Geolocation from 30 December 2026
Regulation (EU) 2023/1115 requires the geolocation of every plot that produced cattle, cocoa, coffee, oil palm, rubber, soy or wood, and large operators must comply from 30 December 2026 (European Commission, January 2026). Traders such as Cargill, Bunge and Louis Dreyfus Company must hold plot polygons and supplier records for millions of farms, which adds an estimated USD 60 million to USD 90 million a year of traceability hosting by 2030 within the traders and processors segment (DC Market Insights estimate).
Pricing Analysis: What Does Agriculture Spend per MW of Data Center Capacity?
Agriculture companies spent USD 4.28 million per MW of IT load in use in 2025, rising to USD 5.67 million by 2035 as GPU racks take a larger share.
| Metric | 2020 | 2025 | 2030 | 2035 |
|---|---|---|---|---|
| Total spending per MW in use (USD million) | 3.70 | 4.28 | 5.06 | 5.67 |
| IT hardware per conventional MW-year (USD million) | 2.55 | 2.70 | 2.85 | 3.00 |
| IT hardware per AI MW-year (USD million) | 8.50 | 8.00 | 7.60 | 7.20 |
| Colocation and hosting (USD per kW-month) | 170 | 185 | 200 | 212 |
| Agriculture IT load in use (MW) | 470 | 650 | 960 | 1,380 |
Public anchors: Deere and Company’s research and development expense was USD 2.31 billion in fiscal 2025 and its capitalised software stood at USD 470 million (Deere and Company Form 10-K, December 2025); CNH Industrial spent USD 1.03 billion on research and development in 2025 and runs cloud-based control rooms for connected units (CNH Industrial Form 10-K, February 2026); Nutrien guided about USD 400 million of 2026 investing capital to proprietary products, network optimisation and digital (Nutrien, February 2026).
Standards and Regulation: Which Rules Shape Agriculture Data Center Design?
Five rules decide where the USD 2.78 billion of 2025 agriculture data center spending sits, led by EU farm-data and traceability law.
- EU Data Act (Regulation (EU) 2023/2854): applies since 12 September 2025 and names agricultural machinery as a connected product, so farmers can demand access to machine data (European Commission).
- EU Deforestation Regulation (EU) 2023/1115: plot geolocation in due-diligence statements; large operators from 30 December 2026, micro and small enterprises from 30 June 2027 (European Commission, January 2026).
- CAP Strategic Plans Regulation (EU) 2021/2115: each Member State must set a strategy for digital technologies in agriculture, with EUR 60.54 billion of rural development support for 2023-2027.
- Implementing Regulation (EU) 2022/1173: Area Monitoring System with Copernicus Sentinel data for CAP area aid.
- India Digital Agriculture Mission: Rs 2,817 crore for AgriStack, the Krishi Decision Support System and soil profile maps (Press Information Bureau, September 2024).
Agriculture Data Center Market Segmentation: Which Segment Spends Most?
IT hardware is the largest component at USD 1.93 billion in 2025, farm equipment manufacturers the largest end user at USD 833.86 million, and corporate data centers still the largest deployment model at USD 1.22 billion.
By Component
| Component | 2025 (USD million) | Share 2025 | 2035 (USD million) | CAGR 2025-2035 |
|---|---|---|---|---|
| IT Hardware | 1,927.25 | 69.3% | 5,415.12 | 10.88% |
| Colocation and Hosting Services | 519.48 | 18.7% | 1,860.68 | 13.61% |
| Electrical and Mechanical Infrastructure | 228.80 | 8.2% | 389.16 | 5.46% |
| Construction and Fit-Out | 104.00 | 3.7% | 155.66 | 4.12% |
By End User
| End User | 2025 (USD million) | Share 2025 | 2035 (USD million) | CAGR 2025-2035 |
|---|---|---|---|---|
| Farm Equipment Manufacturers | 833.86 | 30.0% | 2,267.98 | 10.52% |
| Crop Science and Seed Companies | 611.50 | 22.0% | 1,955.15 | 12.33% |
| Agricultural Commodity Traders and Processors | 667.09 | 24.0% | 1,485.92 | 8.34% |
| Fertilizer and Crop Nutrition Producers | 250.16 | 9.0% | 547.44 | 8.15% |
| Farms Cooperatives and Agtech Platforms | 416.92 | 15.0% | 1,564.13 | 14.14% |
By Workload
| Workload | 2025 (USD million) | Share 2025 | 2035 (USD million) | CAGR 2025-2035 |
|---|---|---|---|---|
| Precision Farming and Machine Data | 722.68 | 26.0% | 2,111.57 | 11.32% |
| Genomics and Breeding Research | 389.13 | 14.0% | 1,173.09 | 11.67% |
| Supply Chain Trading and ERP | 833.86 | 30.0% | 1,564.12 | 6.49% |
| Agricultural AI and Computer Vision | 166.77 | 6.0% | 1,720.54 | 26.29% |
| Backup Security and Other Workloads | 667.09 | 24.0% | 1,251.30 | 6.49% |
By Deployment Model
| Deployment Model | 2025 (USD million) | Share 2025 | 2035 (USD million) | CAGR 2025-2035 |
|---|---|---|---|---|
| Corporate Data Centers | 1,222.99 | 44.0% | 1,876.95 | 4.38% |
| Field and Facility Edge | 555.91 | 20.0% | 1,798.74 | 12.46% |
| Colocation and Hosted Private Cloud | 1,000.63 | 36.0% | 4,144.93 | 15.27% |
DC Exclusive: Digital Farming Platform Acres-to-Compute Ladder, 3 Platforms, 923 Million Acres and 46 MW
The three largest digital farming platforms cover about 923 million acres and need about 46.15 MW of IT load, worth USD 197.34 million of 2025 spending, according to a DC Market Insights model built on 7 inputs.
The ladder converts each platform’s published acreage into IT load at 0.05 watts per engaged acre, a DC Market Insights estimate covering machine logs, yield and as-applied maps, imagery tiles and model inference, and then prices it at the market average of USD 4.28 million per MW in 2025. Inputs: Deere’s nearly 500 million engaged acres (Deere and Company, January 2026), FieldView’s more than 250 million subscribed acres (Bayer, November 2024), Cropwise’s more than 70 million hectares converted at 2.471 acres per hectare (Syngenta Group, November 2025), the watts-per-acre factor, the per-MW price, and the 2025 load and total of the market model.
| Platform | Acreage basis | Modelled IT load (MW) | 2025 spending (USD million) |
|---|---|---|---|
| John Deere Operations Center | 500.0 million acres (engaged acres) | 25.00 | 106.91 |
| Bayer Climate FieldView | 250.0 million acres (subscribed acres) | 12.50 | 53.45 |
| Syngenta Cropwise | 173.0 million acres (70 million hectares) | 8.65 | 36.98 |
The result reads two ways. Platform hosting is only about 7% of the 650 MW agriculture load, so most capacity still serves trading, ERP and breeding rather than field data. And each 100 million acres that move onto a platform add about 5 MW, so Deere’s 2030 aim of 300 million highly engaged acres matters more for GPU retraining than for storage.
Which Region Leads the Agriculture Data Center Market?
North America leads with USD 1.06 billion or 38.0% of 2025 value; the Middle East and Africa grows fastest at 14.49% a year, and Asia Pacific reaches USD 2.27 billion by 2035.
| Region | 2025 (USD million) | Share 2025 | 2035 (USD million) | CAGR 2025-2035 |
|---|---|---|---|---|
| North America | 1,056.22 | 38.0% | 2,619.91 | 9.51% |
| Europe | 722.68 | 26.0% | 1,759.64 | 9.31% |
| Asia Pacific | 667.09 | 24.0% | 2,267.98 | 13.02% |
| Latin America | 222.36 | 8.0% | 742.96 | 12.82% |
| Middle East and Africa | 111.18 | 4.0% | 430.13 | 14.49% |
North America
North American agriculture data center spending is USD 1.06 billion in 2025 and USD 2.62 billion in 2035 (9.51%). The region is home to Deere, Corteva, Cargill, ADM and Nutrien, and USDA ERS found auto-steer on 70% of large-scale crop farms (December 2024).
Europe
Europe grows from USD 722.68 million to USD 1.76 billion at 9.31% a year. CAP area monitoring and the Data Act put parcel and machine data under EU rules, and Bayer, BASF, CNH Industrial and Syngenta Group run their research computing from European hubs.
Asia Pacific
Asia Pacific rises from USD 667.09 million to USD 2.27 billion at 13.02% a year. Kubota formed a strategic alliance with Microsoft in 2020 to move its IT infrastructure and core systems to Azure (Kubota, July 2020), and India’s AgriStack and China’s smart agriculture plan add public data layers that private agribusiness builds on.
Latin America
Latin America grows 12.82% a year to USD 742.96 million. Brazil is the third-largest country at USD 138.98 million in 2025; in an Embrapa, Sebrae and INPE (National Institute for Space Research) survey more than 70% of farmers said they use the internet for farming (Ministry of Agriculture and Livestock, 2020).
Middle East and Africa
The Middle East and Africa is the smallest region at USD 111.18 million in 2025 but grows fastest at 14.49%, reaching USD 430.13 million by 2035 as Gulf states fund controlled-environment farms and grain reserves under national food-security plans (DC Market Insights estimate).
Top 12 Countries in the Agriculture Data Center Market
The United States leads with USD 889.45 million in 2025, and India is the fastest large country at 17.61% a year to USD 351.93 million by 2035.
| Rank | Country | Region | 2025 (USD million) | 2035 (USD million) | CAGR 2025-2035 |
|---|---|---|---|---|---|
| 1 | United States | North America | 889.45 | 2,189.77 | 9.43% |
| 2 | China | Asia Pacific | 222.36 | 782.06 | 13.40% |
| 3 | Brazil | Latin America | 138.98 | 508.34 | 13.85% |
| 4 | Germany | Europe | 138.98 | 336.29 | 9.24% |
| 5 | Canada | North America | 111.18 | 312.82 | 10.90% |
| 6 | Japan | Asia Pacific | 111.18 | 289.36 | 10.04% |
| 7 | France | Europe | 97.28 | 242.44 | 9.56% |
| 8 | India | Asia Pacific | 69.49 | 351.93 | 17.61% |
| 9 | Switzerland | Europe | 69.49 | 172.05 | 9.49% |
| 10 | Netherlands | Europe | 69.49 | 172.05 | 9.49% |
| 11 | Australia | Asia Pacific | 55.59 | 172.05 | 11.96% |
| 12 | Argentina | Latin America | 41.69 | 140.77 | 12.94% |
Switzerland and the Netherlands rank above their farm output because Syngenta Group and several seed and trading houses run global systems from there; Brazil overtakes Germany before 2030 as soy and corn traders add traceability systems.
Forecast Scenarios: How Large Could the Agriculture Data Center Market Be in 2035?
DC Market Insights sets the 2035 agriculture data center market between USD 6.55 billion and USD 9.17 billion, with a base case of USD 7.82 billion.
| Scenario | IT load in use 2035 (MW) | GPU share 2035 | Market size 2035 | CAGR 2025-2035 |
|---|---|---|---|---|
| Low | 1,200 | 17% | USD 6.55 billion | 8.95% |
| Base | 1,380 | 22% | USD 7.82 billion | 10.90% |
| High | 1,560 | 27% | USD 9.17 billion | 12.68% |
Low Scenario
USD 6.55 billion if precision-agriculture adoption stays near the 22% of U.S. farms that USDA NASS counted in 2025 and gene-editing programmes stay in research.
Base Scenario
USD 7.82 billion with IT load in use rising from 650 MW to 1,380 MW and AI reaching 22% of that load.
High Scenario
USD 9.17 billion if engaged acres double by 2030 as Deere targets and EU and Indian traceability systems run at full scale.
Key Players and Market Share: Who Spends and Supplies in the Agriculture Data Center Market?
The five largest agricultural compute users, Deere and Company, Bayer, Corteva, Syngenta Group and Cargill, account for about 30% of 2025 agriculture data center spending (DC Market Insights estimate based on platform acreage, research budgets and company IT disclosures).
- Deere and Company (about 1 million connected machines, USD 2.31 billion research and development in fiscal 2025)
- CNH Industrial (USD 1.03 billion research and development in 2025)
- AGCO (85% owner of PTx Trimble since April 2024)
- Kubota
- Bayer (Climate FieldView, more than 250 million subscribed acres)
- Corteva (more than 5 petabases of genomic data)
- Syngenta Group (Cropwise, more than 70 million hectares)
- BASF Agricultural Solutions
- Cargill (Atlanta tech hub with up to 400 roles)
- ADM
- Bunge
- Nutrien (about USD 400 million of 2026 investing capital including digital)
- Microsoft (Azure Data Manager for Agriculture, preview March 2023)
- Amazon Web Services
- Google Cloud
- Dell Technologies
- Hewlett Packard Enterprise
Platform Hosting Concentration, 2025
Hosting concentrates in two clouds and a few colocation providers: Bayer and Kubota run core systems on Microsoft Azure, Bayer’s decision engine runs on AWS, and Deere’s 10-K describes data centers often owned by third parties, which is why colocation and hosted private cloud already makes up 36.0% of 2025 spending.
Recent Developments in the Agriculture Data Center Market
Six dated events since late 2025 show agricultural data moving to hosted platforms and AI pipelines.
- In October 2026, AWS documented Bayer Crop Science’s agentic decision engine with more than 500 model configurations (Source: Amazon Web Services).
- In September 2026, Corteva reported more than 5 petabases of genomic sequence data and 145 AI model solutions at its Investor Day (Source: Corteva).
- In August 2026, India reported more than 10.31 crore AgriStack farmer IDs (Source: Press Information Bureau).
- In February 2026, Nutrien guided about USD 400 million of 2026 investing capital to proprietary products, network optimisation and digital (Source: Nutrien).
- In January 2026, Deere and Company reported about 1 million connected machines, and the EU confirmed 30 December 2026 as the deforestation-rule start for large operators (Source: Deere and Company; European Commission).
- In November 2025, Syngenta Group opened Cropwise to outside developers (Source: Syngenta Group).
Research Methodology: How DC Market Insights Sized the Agriculture Data Center Market
The USD 2.78 billion 2025 value is a bottom-up DC Market Insights model of 650 MW of agriculture IT load in use, about 1.4% of the roughly 46 gigawatts (GW) of enterprise and colocation capacity inside the 116 GW installed base, priced component by component; see the DC Market Insights research methodology.
Model Inputs
Agriculture IT load in use of 470, 650, 960 and 1,380 MW in 2020, 2025, 2030 and 2035; leased share 25%, 36%, 46% and 53%; AI share 1%, 5%, 14% and 22%. IT hardware costs USD 2.70 million per conventional MW-year and USD 8.00 million per AI MW-year in 2025; colocation and hosting average USD 185 per kW-month, so 234 leased MW x USD 185 x 12 = USD 519.48 million. Owned-site electrical and mechanical spending is USD 228.80 million and construction and fit-out USD 104.00 million. Sibling estimates use the same base: the Retail Data Center Market and the Manufacturing Data Center Market; field and facility server rooms are a subset of the Edge Data Center Market, and hosting fees are a slice of the Data Center Colocation Market.
Bound Checks
Ceiling 1: USD 2.78 billion is 0.49% of the DC Market Insights global data center market of USD 570.04 billion in 2025, below hospitality (0.8%) and retail (3.0%). Ceiling 2: it equals 0.06% of world agriculture value added of about USD 4.75 trillion in 2025 (World Bank). Floor: Deere’s fiscal 2025 software amortisation of USD 227 million plus the platform ladder’s USD 197.34 million stays below the USD 1.45 billion of the two largest end users. Every split sums to the total in every year, and the CAGR is recomputed from the 2025 and 2035 endpoints.
Table of contents
- 01Introduction
- 1.1Market Definition
- 1.2Report Scope
- 02Key Market Statistics
- 2.1Market Size 2025, 2026, 2030 and 2035
- 2.2Leading Segments, Regions and Countries
- 03Executive Summary
- 3.1Market Snapshot, 2025, 2026 and 2035
- 3.2Agriculture Data Center Market Size, 2020-2035
- 04Market Scope
- 4.1Included Spending
- 4.2Excluded Spending
- 4.3How the Segments Fit Together
- 05Why Estimates Differ
- 5.1Scope Comparison Table
- 5.2In-Scope Buyer Groups
- 06Market Drivers
- 6.1Deere's 1 Million Connected Machines and 500 Million Engaged Acres
- 6.2Genomic Breeding at Petabase Scale
- 6.3EU Satellite Checks Under the Common Agricultural Policy
- 07Market Trends
- 7.1Bayer Runs 500 Model Configurations in an Agentic Decision Engine
- 7.2Syngenta Opens Cropwise to Outside Developers
- 7.3China Targets 32% Farm Production Informatisation by 2028
- 08Market Challenges and Restraints
- 8.1Only 22% of U.S. Farms Used Precision Agriculture in 2025
- 8.2Commodity Traders Upgrade ERP in Phases
- 09Market Opportunities
- 9.1India's AgriStack Reaches 10.31 Crore Farmer IDs
- 9.2EU Deforestation Rules Require Plot Geolocation from 30 December 2026
- 10Pricing Analysis
- 10.1Spending per MW, 2020-2035
- 10.2Public Price Anchors
- 11Standards and Regulation
- 11.1EU Data Act
- 11.2EU Deforestation Regulation
- 11.3CAP Strategic Plans and Area Monitoring
- 11.4India Digital Agriculture Mission
- 12Market Segmentation by Component
- 12.1IT Hardware
- 12.2Colocation and Hosting Services
- 12.3Electrical and Mechanical Infrastructure
- 12.4Construction and Fit-Out
- 13Market Segmentation by End User
- 13.1Farm Equipment Manufacturers
- 13.2Crop Science and Seed Companies
- 13.3Agricultural Commodity Traders and Processors
- 13.4Fertilizer and Crop Nutrition Producers
- 13.5Farms Cooperatives and Agtech Platforms
- 14Market Segmentation by Workload
- 14.1Precision Farming and Machine Data
- 14.2Genomics and Breeding Research
- 14.3Supply Chain Trading and ERP
- 14.4Agricultural AI and Computer Vision
- 14.5Backup Security and Other Workloads
- 15Market Segmentation by Deployment Model
- 15.1Corporate Data Centers
- 15.2Field and Facility Edge
- 15.3Colocation and Hosted Private Cloud
- 16DC Exclusive: Digital Farming Platform Acres-to-Compute Ladder
- 16.1John Deere Operations Center
- 16.2Bayer Climate FieldView
- 16.3Syngenta Cropwise
- 17Regional Insights
- 17.1North America
- 17.2Europe
- 17.3Asia Pacific
- 17.4Latin America
- 17.5Middle East and Africa
- 18Country Analysis
- 18.1United States
- 18.2China
- 18.3Brazil
- 18.4Germany
- 18.5Canada
- 18.6Japan
- 18.7France
- 18.8India
- 18.9Switzerland
- 18.10Netherlands
- 18.11Australia
- 18.12Argentina
- 19Forecast Scenarios
- 19.1Low Scenario
- 19.2Base Scenario
- 19.3High Scenario
- 20Key Players and Market Share
- 20.1Deere and Company
- 20.2CNH Industrial
- 20.3AGCO
- 20.4Kubota
- 20.5Bayer
- 20.6Corteva
- 20.7Syngenta Group
- 20.8BASF Agricultural Solutions
- 20.9Cargill
- 20.10ADM
- 20.11Bunge
- 20.12Nutrien
- 20.13Microsoft
- 20.14Amazon Web Services
- 20.15Google Cloud
- 20.16Dell Technologies
- 20.17Hewlett Packard Enterprise
- 20.18Platform Hosting Concentration, 2025
- 21Recent Developments
- 21.1Developments, November 2025 to October 2026
- 22Research Methodology
- 22.1Model Inputs
- 22.2Bound Checks
- Fig. 1Agriculture Data Center Market Size, 2020-2035 (USD Billion)
- Table 1Agriculture Data Center Market Snapshot
- Table 2Scope Comparison
- Table 3Spending per MW, 2020-2035
- Table 4Market by Component, 2025 and 2035
- Table 5Market by End User, 2025 and 2035
- Table 6Market by Workload, 2025 and 2035
- Table 7Market by Deployment Model, 2025 and 2035
- Table 8Digital Farming Platform Acres-to-Compute Ladder
- Table 9Market by Region, 2025 and 2035
- Table 10Top 12 Countries, 2025 and 2035
- Table 11Forecast Scenarios, 2035
About this report
Written by Amit Jain and reviewed by Deepti Agrawal, Senior Editor, Research. Figures are built top-down and bottom-up and reconciled before publication, with 2025 as the base year.
Read our methodologyHow we built this
- Historical period2020-2024
- Base year2025
- Forecast period2026-2035
- Sizing approachTop-down + bottom-up
Need more than the report?
Advisory on this market
Due diligence, site selection and market entry work, by the analysts who wrote this report.
See consulting servicesFrequently asked questions
USD 3.16 billion in 2026, up 13.70% from USD 2.78 billion in 2025, according to DC Market Insights estimates. The market is projected to reach USD 7.82 billion by 2035, a CAGR of 10.90% from 2025.
10.90% a year from 2025 to 2035, after 9.81% a year from 2020 to 2025, as agriculture IT load in use rises from 650 MW to 1,380 MW and AI climbs from 5% to 22% of it.
USD 2.78 billion in 2025 was spent on data center capacity that farm equipment makers, crop science companies, commodity traders, fertilizer producers, farms and agtech platforms own or lease. Public cloud fees, field sensors and food processing plants are not counted.
About 1 million connected machines and nearly 500 million engaged acres feed the John Deere Operations Center, which stores data at the edge and in cloud data centers. Farm equipment manufacturers spend USD 833.86 million on data center capacity in 2025.
USD 389.13 million of 2025 spending runs genomics and breeding research, growing 11.67% a year: Corteva alone reported more than 5 petabases of genomic sequence data and 145 AI model solutions in September 2026.
Agricultural AI and computer vision grows fastest at 26.29% a year to USD 1.72 billion by 2035; among deployment models, colocation and hosted private cloud leads at 15.27%.
About 46 MW in the DC Market Insights Acres-to-Compute Ladder: roughly 923 million acres on Deere, FieldView and Cropwise x 0.05 watts per acre, worth about USD 197.34 million of 2025 spending.
North America, with USD 1.06 billion or 38.0% of 2025 value. The Middle East and Africa grows fastest at 14.49% a year, and India is the fastest large country at 17.61%.
USD 69.49 million in 2025, rising to USD 351.93 million by 2035 at 17.61% a year, as AgriStack passed 10.31 crore farmer IDs in August 2026 under the Rs 2,817 crore Digital Agriculture Mission.
USD 3.16 billion in 2026 counts only capacity agriculture companies own or lease. Smart-farming estimates that add guidance systems, sensors, drones, farm software or food processing come out many times larger.
Get this report
How do I get the full report?
Request a quote; we reply by email within one business day.
How and when will I receive the report?
By email, within 24–48 business hours of payment.
How can I pay?
Once you accept the quote, we email you a secure payment link.
Can I see a sample first?
Yes. Request a free sample and we will email it to you.
Can the report be tailored to my needs?
Yes. We can add countries, segments or data cuts. Talk to an analyst about the scope you need.
Can I get an invoice or pay against a purchase order?
Write to sales@dcmarketinsights.com and our team will help.