
Cloud Servers Market Size, Share & Forecast to 2035
Market at a glance
The Cloud Servers market was worth USD 253.00 billion in 2025 and is forecast to reach USD 862.80 billion by 2035, growing at a 13.05% CAGR.
 By Amit Jain, Senior Consultant, ICT & Emerging Technologies
 Reviewed by Deepti Agrawal
Last updated 2 Nov 2026
Base year 2025 PDF + Excel
Key findings
Three Quarters of Microsoft's USD 45.2 Billion Quarter Went to Chips and Servers
Rack-Scale Systems on Open Rack Wide
Export Licences for China and D:5-Owned Buyers
Inference Servers: USD 457.28 billion by 2035
What is inside the report
- 01Introduction
- 02Executive Summary
- 03Market Scope and Estimate Comparison
- 04Market Dynamics
- 05Pricing Analysis
- 06Standards and Regulation
- 07Market Segmentation by Server Type
- 08Market Segmentation by Cloud Provider Type
- 09Market Segmentation by Form Factor
- 10Market Segmentation by Workload
- 16chapters
- 2020-2024Historical period
- 2026-2035Forecast period
- —Companies profiled
Segmentation
Recent developments
Amazon raised its 2026 cash capital expenditure plan to about USD 220 billion (Source: Amazon, 29 October 2026).
Microsoft reported USD 45.2 billion of quarterly capital expenditure, roughly three quarters on short-lived assets (Source: Microsoft, 28 October 2026).
Alphabet kept 2026 capital expenditure guidance at USD 195 to 205 billion and said 2027 spending will increase significantly (Source: Alphabet, 28 October 2026).
Meta narrowed its 2026 capital expenditure range to USD 135 to 145 billion (Source: Meta third-quarter 2026 results).
NVIDIA reported USD 89 billion of quarterly data center revenue, USD 49 billion of it from hyperscale customers (Source: NVIDIA, 26 August 2026).
Super Micro Computer reported USD 39.1 billion of fiscal 2026 net sales (Source: Super Micro, 11 August 2026).
Full analysis
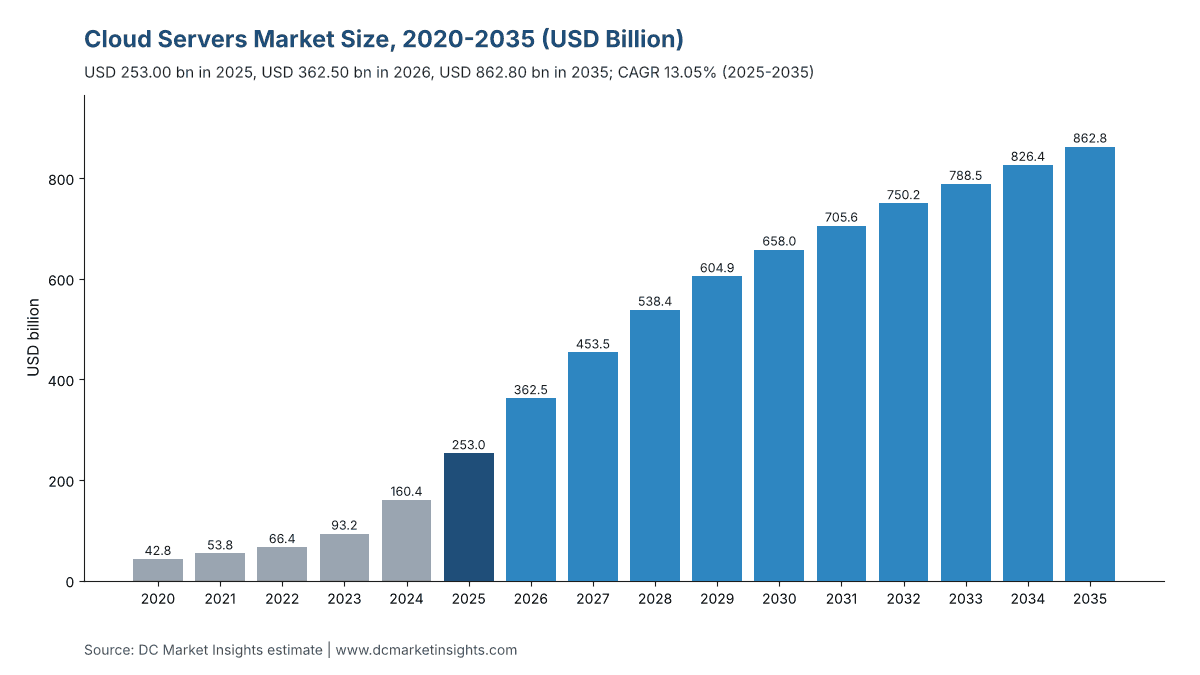
The Cloud Servers Market is valued at USD 362.50 billion in 2026 and is projected to reach USD 862.80 billion by 2035, up from USD 253.00 billion in 2025, a CAGR of 13.05% from 2025 to 2035 (DC Market Insights estimate). Cloud server spending is set by the capital budgets of a handful of buyers: Amazon raised its 2026 cash capital expenditure plan to about USD 220 billion on 29 October 2026, from about USD 200 billion in February (Source: Amazon third-quarter 2026 results), and Microsoft said roughly three quarters of its USD 45.2 billion first-quarter fiscal 2027 capital expenditure went to short-lived assets, primarily central processing units (CPUs) and graphics processing units (GPUs) (Source: Microsoft, 28 October 2026). The 2025 receipt is 8.0 million accelerators installed in cloud servers × USD 23,750 of server value per accelerator = USD 190.00 billion, plus 7.0 million general-purpose cloud servers × USD 9,000 = USD 63.00 billion. Rack-scale systems grow fastest at 22.23% a year because buyers now order whole liquid-cooled racks of 72 GPUs rather than single servers, and the Middle East and Africa is the fastest region at 17.73% as Saudi Arabia and the United Arab Emirates (UAE) build national AI clouds.
Key Market Statistics: How Big Is the Cloud Servers Market in 2026?
The Cloud Servers Market is worth USD 362.50 billion in 2026, 43.28% above USD 253.00 billion in 2025, DC Market Insights estimates.
- Market size 2025: USD 253.00 billion
- Market size 2026: USD 362.50 billion
- Market size 2030: USD 658.00 billion
- Market size 2035: USD 862.80 billion
- CAGR 2025-2035: 13.05% (low case USD 690.24 billion, high case USD 1,052.62 billion in 2035)
- Largest server type: GPU Accelerated Servers, 61.58% of 2025 value
- Fastest form factor: Rack-Scale Systems, 22.23% a year
- Leading region: North America, 58.00% of 2025 value; fastest region: Middle East and Africa, 17.73%
- Largest country: United States, USD 136.62 billion in 2025
- Largest buyer group: Hyperscale Cloud Providers, 66.00% of 2025 value
Key Takeaways: What Drives Cloud Server Spending?
- Cloud server spending rises from USD 253.00 billion to USD 862.80 billion because accelerators installed in cloud servers grow from 8.0 million in 2025 to 30.0 million in 2035.
- AI inference servers grow 19.67% a year, faster than training at 8.56%, because every model trained in a cloud is then served from many more inference racks.
- Custom ASIC servers rise from 13.52% to 23.37% of cloud server value because cloud providers design their own chips to lower cost per token.
- Growth slows from 42.67% in 2020-2025 to 13.05% after 2025 because server value per accelerator stops rising after 2027 and peaks at USD 25,500.
Executive Summary: How Much Do Cloud Providers Spend on Servers?
The Global Cloud Servers Market size was valued at USD 42.80 billion in 2020, reached USD 253.00 billion in 2025, and is anticipated to reach USD 862.80 billion by 2035, at a CAGR of 13.05% during the forecast period.
| Report Attribute | Details |
|---|---|
| Historical Data | 2020-2024 |
| Base Year | 2025 |
| Forecast Period | 2026-2035 |
| Market Size 2025 | USD 253.00 billion |
| Market Size 2026 | USD 362.50 billion |
| CAGR 2025-2035 | 13.05% |
| Market Size 2035 | USD 862.80 billion |
| Segments Covered | Server Type, Cloud Provider Type, Form Factor, Workload |
| Regions Covered | North America, Europe, Asia Pacific, Latin America, Middle East and Africa |
Cloud server spending grew 42.67% a year from 2020 to 2025 as accelerators in cloud servers rose from 0.45 million to 8.0 million. In 2026 the market jumps 43.28% to USD 362.50 billion: Alphabet kept its 2026 capital expenditure guidance at USD 195 to 205 billion after spending about USD 90 billion in 2025, and said about 65% of its third-quarter 2026 technical infrastructure spending went to servers and networking equipment (Source: Alphabet third-quarter 2026 earnings call). After 2027 growth settles near 6% to 10% a year, because cloud providers depreciate servers over five to six years and replace a growing installed base rather than doubling it.
Market Scope: Which Servers Count as Cloud Servers?
The Cloud Servers Market counts USD 253.00 billion of 2025 spending on server systems bought by cloud service providers, valued at the price the provider pays the server maker.
Included
- GPU accelerated servers and rack-scale systems built around NVIDIA or AMD accelerators, including the GPUs, CPUs, memory and in-chassis networking.
- Custom application-specific integrated circuit (ASIC) servers designed by cloud providers, such as tensor processing unit and Trainium systems.
- General-purpose CPU servers for compute, storage and databases in cloud regions.
- Buyers: hyperscale clouds, internet platforms that run their own clouds, GPU cloud providers, tier-2 and regional clouds, sovereign and telecom clouds.
Excluded
- Servers bought by enterprises for their own data centers or colocation cages, and edge servers outside data center halls, covered in the Edge Server Market.
- Data center buildings, power and cooling, network switches outside the server chassis, and storage arrays sold as separate systems.
- Cloud service revenue, such as GPU rental, counted in the GPU as a Service Market.
How the Segments Fit Together
Server type, cloud provider type, form factor, workload, region and country are six views of the same USD 253.00 billion; each sums to the total every year.
Why Do Cloud Servers Market Estimates Differ?
Cloud server estimates differ because the USD 362.50 billion for 2026 counts only server hardware bought by cloud providers, while broader definitions add enterprise servers, networking or cloud services.
Some estimates for “cloud servers” count all data center servers, which DC Market Insights values at USD 365.40 billion in 2025 in the Data Center Server Market; cloud buyers hold 69.24% of that total. Others count virtual cloud server rentals, a service rather than hardware, or add switches, storage arrays and data center buildings from cloud capital budgets. A few leave out GPU systems and count only CPU servers, which removes USD 190.00 billion from 2025. Smaller buyers are in scope: tier-2, regional, sovereign and telecom clouds spend USD 25.30 billion in 2025.
| Element | Included? | Why |
|---|---|---|
| Accelerated and custom ASIC servers bought by clouds | Yes, USD 190.00 billion in 2025 | Core cloud server hardware |
| General-purpose cloud servers | Yes, USD 63.00 billion in 2025 | Compute and storage nodes in cloud regions |
| Enterprise-owned servers | No | Not bought by a cloud provider |
| Virtual server and GPU rental | No | Service revenue, not hardware |
| Switches, storage arrays, buildings | No | Separate equipment markets |
Market Drivers: Why Are Cloud Providers Buying So Many Servers?
Three drivers explain most of the USD 609.80 billion that cloud server spending adds between 2025 and 2035: short-lived capital budgets, record cloud backlogs and GPU cloud contracts.
Three Quarters of Microsoft’s USD 45.2 Billion Quarter Went to Chips and Servers
Microsoft spent USD 45.2 billion of capital expenditure including finance leases in the July-September 2026 quarter and said roughly three quarters went to short-lived assets, primarily CPUs and GPUs (Source: Microsoft fiscal 2027 first-quarter earnings). It expects about USD 170 billion of capital expenditure in calendar 2026. At three quarters, that is about USD 127.50 billion of short-lived assets from one buyer, about half of the USD 253.00 billion cloud server market of 2025.
Cloud Backlogs of USD 561 Billion and USD 638 Billion
Google Cloud reported a USD 561 billion backlog and revenue up 103% to USD 30.7 billion in the third quarter of 2026 (Source: Alphabet, 28 October 2026), and Oracle reported USD 638 billion of remaining performance obligations at the end of fiscal 2026 (Source: Oracle, 10 June 2026). Contracted revenue of this size has to be served from servers that are not yet installed, which is why DC Market Insights expects hyperscale cloud providers to raise server spending from USD 166.98 billion in 2025 to USD 500.42 billion by 2035.
GPU Clouds: CoreWeave’s USD 66.8 Billion Backlog
CoreWeave ended 2025 with USD 5.13 billion of revenue, USD 10.3 billion of capital expenditure, a USD 66.8 billion revenue backlog and about 3.1 gigawatts (GW) of contracted power (Source: CoreWeave fourth-quarter 2025 results, 26 February 2026). GPU cloud providers spend USD 25.30 billion on servers in 2025, 10.00% of the market, rising to 17.00% by 2035, a 19.21% annual growth rate.
Market Trends: How Are Cloud Servers Changing?
Cloud servers are moving to whole racks, custom chips and longer lives: rack-scale systems rise from 22.00% to 48.00% of cloud server value by 2035.
Rack-Scale Systems on Open Rack Wide
AMD showed its Helios rack-scale platform at the Open Compute Project (OCP) Global Summit on 14 October 2025, built on the Open Rack Wide specification introduced by Meta (Source: AMD newsroom, 14 October 2025). Cloud providers now buy the rack, its power shelves and its liquid cooling as one system, so rack-scale systems grow from USD 55.66 billion to USD 414.14 billion, 22.23% a year, while standard rack servers grow 8.56%.
Custom ASIC Servers Rise to 23.37% of Value
Custom ASIC servers grow from USD 34.20 billion in 2025 to USD 201.60 billion by 2035, 19.41% a year, faster than GPU accelerated servers at 12.77%. NVIDIA’s hyperscale customers still bought USD 49 billion of its data center products in the quarter to July 2026, about 55% of USD 89 billion data center revenue (Source: NVIDIA second-quarter fiscal 2027 call, 26 August 2026), so GPU servers keep the largest share through 2035.
Five to Five and a Half Year Server Lives
Meta extended the useful life of servers and network assets to 5.5 years from fiscal 2025 (Source: Meta fourth-quarter 2024 results), while Amazon shortened a subset of servers from six to five years from 1 January 2025 (Source: Amazon 10-K for 2024). A five-year life means about 20% of the installed cloud server base is replaced each year, which keeps general-purpose server spending growing 8.53% a year even as AI takes most new budgets.
Market Challenges: What Could Slow Cloud Server Spending?
Two constraints hold the forecast to 13.05% a year after 2025: export controls on accelerator servers and delays in the power and buildings that servers need.
Export Licences for China and D:5-Owned Buyers
The U.S. Bureau of Industry and Security (BIS) moved licence review for H200-class chips to China and Macau from a presumption of denial to case-by-case review on 15 January 2026 (Source: Federal Register, 91 FR 1684), and its guidance of 31 May 2026 says a licence is still needed for entities headquartered in Country Group D:5 wherever they are (Source: BIS). China’s cloud server spending of USD 32.89 billion in 2025 therefore grows 13.31% a year, below the Asia Pacific rate of 13.96%.
Delayed Third-Party Capacity and a 25% Chip Duty
Microsoft said some third-party capacity deliveries it expected in the July-September 2026 quarter were delayed, holding its capital expenditure at USD 45.2 billion (Source: Microsoft, 28 October 2026). A presidential proclamation of 14 January 2026 placed a 25% duty on certain advanced chips under Section 232, with exemptions for imports that support U.S. data center buildout (Source: Federal Register, 20 January 2026). In the low case, these delays cut 2035 spending to USD 690.24 billion.
Market Opportunities: Where Will New Cloud Server Demand Come From?
Two pools add USD 431.66 billion of cloud server value between 2025 and 2035, before overlap: inference servers and sovereign clouds.
Inference Servers: USD 457.28 billion by 2035
AI inference servers grow from USD 75.90 billion in 2025 to USD 457.28 billion in 2035, 19.67% a year, and pass training in 2029 in the DC Market Insights model. Server makers that ship lower-power inference racks of 30 to 60 kilowatts (kW) win this demand in tier-2 regions where 130 kW racks cannot be cooled.
Sovereign Clouds: USD 60.40 billion by 2035
Sovereign and telecom clouds grow from USD 10.12 billion to USD 60.40 billion, 19.56% a year. HUMAIN in Saudi Arabia plans up to 500 megawatts (MW) with NVIDIA, with a first-phase supercomputer of 18,000 GB300 Grace Blackwell chips (Source: NVIDIA, 13 May 2025); the IndiaAI Compute Portal offers 38,000 GPUs (Source: Press Information Bureau, 4 February 2026); and the EU InvestAI facility sets aside EUR 20 billion for up to five AI gigafactories (Source: European Commission, 4 December 2025).
Pricing Analysis: How Much Does a Cloud Server Cost?
A cloud accelerator server costs about USD 23,750 per accelerator installed in 2025, about USD 190,000 for an 8-GPU system, and a general-purpose cloud server about USD 9,000, DC Market Insights estimates.
| Year | Accelerators in Cloud Servers (million) | Server Value per Accelerator (USD) | General-Purpose Units (million) | General-Purpose ASP (USD) | Market Size (USD million) |
|---|---|---|---|---|---|
| 2020 | 0.45 | 20,000 | 5.2 | 6,500 | 42,800.00 |
| 2025 | 8.00 | 23,750 | 7.0 | 9,000 | 253,000.00 |
| 2030 | 22.00 | 25,000 | 9.0 | 12,000 | 658,000.00 |
| 2035 | 30.00 | 24,000 | 10.5 | 13,600 | 862,800.00 |
Public price anchors: Dell Technologies expected about USD 50 billion of AI-optimized server revenue in fiscal 2027 after shipping more than USD 25 billion in fiscal 2026 (Source: Dell, 26 February 2026); Super Micro Computer reported USD 39.1 billion of net sales for the year to June 2026 (Source: Super Micro, 11 August 2026). Server value per accelerator rises from USD 20,000 in 2020 to a peak of USD 25,500 in 2027 as memory and liquid cooling content grows, then eases to USD 24,000 by 2035 as custom ASIC systems with lower prices take share.
Standards and Regulation: Which Rules Apply to Cloud Servers?
Seven rules and specifications shape cloud server design and trade in 2026, and two of them, the BIS licence policy and the Section 232 duty, decide where USD 155.80 billion of 2025 GPU server value can be shipped.
- EU Ecodesign Regulation 2019/424 for servers and data storage: idle power allowances of 25 W for 1-socket and 38 W for 2-socket servers and 96% power supply efficiency at 50% load from 1 January 2023 (Source: EUR-Lex, Regulation 2019/424).
- EU Delegated Regulation 2024/1364, the first phase of a common Union rating scheme for data centres, in force since 6 June 2024 (Source: EUR-Lex).
- EU data centre rating scheme proposed on 21 September 2026, with a consultation on minimum performance standards open until 14 December 2026 (Source: European Commission).
- BIS licence review for H200-class chips to China and Macau, case-by-case from 15 January 2026 (Source: Federal Register, 91 FR 1684).
- Section 232 Proclamation of 14 January 2026: 25% duty on certain advanced chips, with data center buildout exemptions (Source: Federal Register).
- Open Compute Project Open Rack Wide specification V1.0.0, used by AMD Helios rack-scale systems (Source: Open Compute Project).
- Japan Ministry of Economy, Trade and Industry (METI) support of up to JPY 72.5 billion for five GPU cloud projects, including about JPY 50.1 billion for Sakura Internet (Source: METI, 19 April 2024).
Market Segmentation: Which Cloud Servers Lead Spending?
GPU accelerated servers lead cloud server spending with USD 155.80 billion in 2025, while rack-scale systems grow fastest at 22.23% a year.
By Server Type
GPU accelerated servers hold 61.58% of 2025 cloud server value because each 8-GPU system costs about 21 times a general-purpose server.
| Server Type | 2025 (USD million) | Share 2025 | 2035 (USD million) | CAGR 2025-2035 |
|---|---|---|---|---|
| GPU Accelerated Servers | 155,800.00 | 61.58% | 518,400.00 | 12.77% |
| Custom ASIC Servers | 34,200.00 | 13.52% | 201,600.00 | 19.41% |
| General Purpose Servers | 63,000.00 | 24.90% | 142,800.00 | 8.53% |
By Cloud Provider Type
Hyperscale cloud providers buy 66.00% of cloud servers in 2025, and sovereign and telecom clouds grow fastest at 19.56% a year.
| Cloud Provider Type | 2025 (USD million) | Share 2025 | 2035 (USD million) | CAGR 2025-2035 |
|---|---|---|---|---|
| Hyperscale Cloud Providers | 166,980.00 | 66.00% | 500,424.00 | 11.60% |
| Internet Platform Clouds | 35,420.00 | 14.00% | 103,536.00 | 11.32% |
| GPU Cloud Providers | 25,300.00 | 10.00% | 146,676.00 | 19.21% |
| Tier-2 and Regional Clouds | 15,180.00 | 6.00% | 51,768.00 | 13.05% |
| Sovereign and Telecom Clouds | 10,120.00 | 4.00% | 60,396.00 | 19.56% |
By Form Factor
Rack-scale systems rise from 22.00% to 48.00% of cloud server value by 2035.
| Form Factor | 2025 (USD million) | Share 2025 | 2035 (USD million) | CAGR 2025-2035 |
|---|---|---|---|---|
| Rack-Scale Systems | 55,660.00 | 22.00% | 414,144.00 | 22.23% |
| Standard Rack Servers | 159,390.00 | 63.00% | 362,376.00 | 8.56% |
| Multi-Node and Blade Servers | 37,950.00 | 15.00% | 86,280.00 | 8.56% |
By Workload
AI inference rises from 30.00% to 53.00% of cloud server value, overtaking training.
| Workload | 2025 (USD million) | Share 2025 | 2035 (USD million) | CAGR 2025-2035 |
|---|---|---|---|---|
| AI Training | 113,850.00 | 45.00% | 258,840.00 | 8.56% |
| AI Inference | 75,900.00 | 30.00% | 457,284.00 | 19.67% |
| General Compute and Storage | 63,250.00 | 25.00% | 146,676.00 | 8.78% |
DC Exclusive: Hyperscaler Capex-to-Server Bridge, 5 Buyers, USD 506.92 Billion of 2026 Short-Lived Spend
The Hyperscaler Capex-to-Server Bridge is a DC Market Insights model built on 13 inputs: 10 capital expenditure figures disclosed by Amazon, Microsoft, Alphabet, Meta and Oracle, 2 disclosed server shares and 1 assumed share (60%) where no share is disclosed.
| Buyer | Latest Full-Year Capex (USD billion) | 2026 Guidance (USD billion) | Server Share Basis | Implied 2026 Servers and Short-Lived Assets (USD billion) |
|---|---|---|---|---|
| Amazon | 131.8 (2025) | about 220 (2026 cash) | not disclosed; 60% assumed | 132.00 |
| Microsoft | 115.9 (fiscal 2026 cash) | about 170 (calendar 2026) | about 75% short-lived assets (Q1 fiscal 2027) | 127.50 |
| Alphabet | about 90 (2025) | 195-205 (2026) | about 65% servers and networking (Q3 2026) | 130.00 |
| Meta | 72.22 (2025) | 135-145 (2026) | not disclosed; 60% assumed | 84.00 |
| Oracle | 55.7 (fiscal 2026) | no guidance in release | not disclosed; 60% assumed | 33.42 |
| Total | about 465.6 | about 730 (four buyers) | weighted about 66% | 506.92 |
Read together, the bridge shows three things. First, the five buyers alone imply about USD 506.92 billion of servers, networking and other short-lived assets in 2026; the DC Market Insights cloud server estimate of USD 362.50 billion is 71.51% of that, the gap being network switches, storage arrays and timing of finance leases, while the USD 362.50 billion also includes Chinese, GPU and regional clouds. Second, Microsoft and Alphabet together account for about USD 257.50 billion, half of the bridge, because both disclose high server shares. Third, Oracle publishes no capital expenditure guidance for fiscal 2027, so the bridge holds it at its fiscal 2026 level; a higher Oracle figure moves the 2026 estimate toward the high case.
Regional Insights: Which Region Buys the Most Cloud Servers?
North America leads cloud server spending with 58.00% of 2025 value, and the Middle East and Africa grows fastest at 17.73% a year.
| Region | 2025 (USD million) | Share 2025 | 2035 (USD million) | CAGR 2025-2035 |
|---|---|---|---|---|
| North America | 146,740.00 | 58.00% | 448,656.00 | 11.82% |
| Asia Pacific | 60,720.00 | 24.00% | 224,328.00 | 13.96% |
| Europe | 27,830.00 | 11.00% | 103,536.00 | 14.04% |
| Middle East and Africa | 10,120.00 | 4.00% | 51,768.00 | 17.73% |
| Latin America | 7,590.00 | 3.00% | 34,512.00 | 16.35% |
North America
North America leads with USD 146.74 billion in 2025, because Amazon, Microsoft, Alphabet, Meta and Oracle install most of their servers in U.S. regions; Amazon Web Services (AWS) sales rose 39% to USD 46.0 billion in the third quarter of 2026 (Source: Amazon).
Europe
Europe grows 14.04% a year from USD 27.83 billion, helped by the EUR 20 billion InvestAI facility for AI gigafactories and by data residency rules that keep public-sector workloads in EU cloud regions.
Asia Pacific
Asia Pacific grows 13.96% a year from USD 60.72 billion. Alibaba plans to invest at least RMB 380 billion in cloud and AI infrastructure over three years (Source: Alibaba Group, 24 February 2025), and India’s subsidised GPU portal reached 38,000 GPUs.
Latin America
Latin America grows 16.35% a year from USD 7.59 billion, led by cloud regions in Brazil, Mexico and Chile.
Middle East and Africa
The Middle East and Africa is the fastest region at 17.73% a year, from USD 10.12 billion to USD 51.77 billion: Stargate UAE plans 1 GW with the first 200 MW expected in 2026 (Source: OpenAI), and G42 says the U.S. approved advanced chip exports to it (Source: G42, 20 November 2025).
Country Analysis: Which Countries Spend Most on Cloud Servers?
The United States is the largest cloud server country with USD 136.62 billion in 2025, and India is the fastest large country at 20.48% a year.
| Rank | Country | Region | 2025 (USD million) | 2035 (USD million) | CAGR 2025-2035 |
|---|---|---|---|---|---|
| 1 | United States | North America | 136,620.00 | 414,144.00 | 11.73% |
| 2 | China | Asia Pacific | 32,890.00 | 114,752.40 | 13.31% |
| 3 | Japan | Asia Pacific | 8,096.00 | 28,472.40 | 13.40% |
| 4 | Germany | Europe | 6,578.00 | 25,884.00 | 14.68% |
| 5 | United Kingdom | Europe | 6,578.00 | 24,158.40 | 13.89% |
| 6 | Canada | North America | 6,072.00 | 22,432.80 | 13.96% |
| 7 | South Korea | Asia Pacific | 5,060.00 | 18,981.60 | 14.13% |
| 8 | India | Asia Pacific | 4,554.00 | 29,335.20 | 20.48% |
| 9 | France | Europe | 4,048.00 | 15,530.40 | 14.39% |
| 10 | Australia | Asia Pacific | 3,795.00 | 13,804.80 | 13.78% |
| 11 | Saudi Arabia | Middle East and Africa | 3,542.00 | 22,432.80 | 20.27% |
| 12 | Singapore | Asia Pacific | 3,289.00 | 10,353.60 | 12.15% |
The top 12 countries hold 87.40% of 2025 cloud server value. Saudi Arabia grows 20.27% a year, almost as fast as India, because HUMAIN’s first phase alone is an 18,000-chip GB300 supercomputer.
Forecast Scenarios: How Big Could Cloud Server Spending Be by 2035?
Cloud server spending reaches USD 862.80 billion by 2035 in the base case, within a range of USD 690.24 billion to USD 1,052.62 billion.
| Scenario | 2035 (USD million) | CAGR 2025-2035 | Assumption |
|---|---|---|---|
| Low | 690,240.00 | 10.56% | Power and building delays and export limits hold accelerators in cloud servers near 24 million in 2035. |
| Base | 862,800.00 | 13.05% | 30.0 million accelerators at USD 24,000 each plus 10.5 million general-purpose servers at USD 13,600. |
| High | 1,052,616.00 | 15.32% | Inference demand and sovereign clouds lift accelerators to about 36 million in 2035. |
Key Players and Market Share: Who Supplies Cloud Servers?
Original design manufacturers (ODMs) build most cloud servers to the providers’ own designs, and the top five suppliers hold about 65% of 2025 value (DC Market Insights estimate based on company revenue disclosures).
- Foxconn (Hon Hai Precision Industry)
- Quanta Computer (QCT)
- Wiwynn
- Inventec
- Dell Technologies
- Super Micro Computer
- Hewlett Packard Enterprise
- Lenovo
- Inspur Electronic Information
- xFusion
- Celestica
- Gigabyte Technology
- ASUS
- MiTAC Computing
- Jabil
Dell Technologies reported USD 60.8 billion of Infrastructure Solutions Group revenue in fiscal 2026, more than USD 64 billion of AI-optimized server orders and a USD 43 billion backlog (Source: Dell, 26 February 2026). Super Micro Computer guided fiscal 2027 net sales of USD 65 to 72 billion (Source: Super Micro, 11 August 2026). NVIDIA, whose fiscal 2026 data center revenue was USD 193.7 billion (Source: NVIDIA, 25 February 2026), and AMD supply the accelerators inside most of these systems. Concentration is high on the buyer side too: hyperscale cloud providers account for 66.00% of 2025 cloud server spending.
Recent Developments in Cloud Servers
Six dated events from August to October 2026 show cloud server budgets still rising.
- In October 2026, Amazon raised its 2026 cash capital expenditure plan to about USD 220 billion (Source: Amazon, 29 October 2026).
- In October 2026, Microsoft reported USD 45.2 billion of quarterly capital expenditure, roughly three quarters on short-lived assets (Source: Microsoft, 28 October 2026).
- In October 2026, Alphabet kept 2026 capital expenditure guidance at USD 195 to 205 billion and said 2027 spending will increase significantly (Source: Alphabet, 28 October 2026).
- In October 2026, Meta narrowed its 2026 capital expenditure range to USD 135 to 145 billion (Source: Meta third-quarter 2026 results).
- In August 2026, NVIDIA reported USD 89 billion of quarterly data center revenue, USD 49 billion of it from hyperscale customers (Source: NVIDIA, 26 August 2026).
- In August 2026, Super Micro Computer reported USD 39.1 billion of fiscal 2026 net sales (Source: Super Micro, 11 August 2026).
Research Methodology: How the Cloud Servers Model Works
DC Market Insights sizes cloud servers bottom-up as accelerators installed in cloud servers × server value per accelerator, plus general-purpose cloud server units × average selling price: 8.0 million × USD 23,750 = USD 190.00 billion, plus 7.0 million × USD 9,000 = USD 63.00 billion, for USD 253.00 billion in 2025.
Accelerators in cloud servers rise from 0.45 million in 2020 to 30.0 million in 2035, and general-purpose units from 5.2 million to 10.5 million. Server type, cloud provider type, form factor, workload, region and country splits are DC Market Insights shares that sum to the total every year. Three bound checks:
- Ceiling 1: USD 253.00 billion is 69.24% of the DC Market Insights Data Center Server Market (USD 365.40 billion in 2025), leaving the rest for enterprise and colocation buyers.
- Ceiling 2: 2025-fiscal 2026 capital expenditure of Amazon (USD 131.8 billion), Microsoft (USD 115.9 billion), Alphabet (about USD 90 billion), Meta (USD 72.22 billion) and Oracle (USD 55.7 billion) totals about USD 465.6 billion; cloud servers equal 54.34% of it, below Alphabet’s 65% servers and networking share, even though the estimate also covers Chinese, GPU and regional clouds.
- Floor: NVIDIA’s hyperscale customers at about 55% of USD 193.7 billion fiscal 2026 data center revenue bought about USD 106.54 billion of accelerators and systems, below the USD 190.00 billion accelerated cloud server value, as expected once CPUs, memory, chassis and assembly are added.
Sources are company filings, investor releases and government documents listed in the fact ledger; the method is described in DC Market Insights research methodology. Related edition: AI Server Market.
Table of contents
- 01Introduction
- 1.1Report Description
- 1.2Market Definition and Scope
- 1.3Research Methodology
- 02Executive Summary
- 2.1Market Snapshot, 2025, 2026 and 2035
- 2.2Key Market Statistics
- 2.3Key Takeaways
- 03Market Scope and Estimate Comparison
- 3.1Included and Excluded
- 3.2How the Segments Fit Together
- 3.3Why Estimates Differ
- 04Market Dynamics
- 4.1Three Quarters of Microsoft's USD 45.2 Billion Quarter Went to Chips and Servers
- 4.2Cloud Backlogs of USD 561 Billion and USD 638 Billion
- 4.3GPU Clouds: CoreWeave's USD 66.8 Billion Backlog
- 4.4Rack-Scale Systems on Open Rack Wide
- 4.5Custom ASIC Servers Rise to 23.37% of Value
- 4.6Five to Five and a Half Year Server Lives
- 4.7Export Licences for China and D:5-Owned Buyers
- 4.8Delayed Third-Party Capacity and a 25% Chip Duty
- 4.9Inference Servers: USD 457.28 billion by 2035
- 4.10Sovereign Clouds: USD 60.40 billion by 2035
- 05Pricing Analysis
- 5.1Server Value per Accelerator, 2020-2035
- 5.2Public Price Anchors
- 06Standards and Regulation
- 6.1EU Ecodesign Regulation 2019/424
- 6.2EU Delegated Regulation 2024/1364
- 6.3EU Data Centre Rating Scheme
- 6.4BIS Licence Review for H200-Class Chips
- 6.5Section 232 Advanced Chip Duty
- 6.6Open Compute Project Open Rack Wide
- 6.7Japan METI GPU Cloud Support
- 07Market Segmentation by Server Type
- 7.1GPU Accelerated Servers
- 7.2Custom ASIC Servers
- 7.3General Purpose Servers
- 08Market Segmentation by Cloud Provider Type
- 8.1Hyperscale Cloud Providers
- 8.2Internet Platform Clouds
- 8.3GPU Cloud Providers
- 8.4Tier-2 and Regional Clouds
- 8.5Sovereign and Telecom Clouds
- 09Market Segmentation by Form Factor
- 9.1Rack-Scale Systems
- 9.2Standard Rack Servers
- 9.3Multi-Node and Blade Servers
- 10Market Segmentation by Workload
- 10.1AI Training
- 10.2AI Inference
- 10.3General Compute and Storage
- 11DC Exclusive: Hyperscaler Capex-to-Server Bridge
- 11.1Five Buyers, Capex and Server Shares
- 11.2What the Bridge Implies for 2026
- 12Regional Insights
- 12.1North America
- 12.2Asia Pacific
- 12.3Europe
- 12.4Middle East and Africa
- 12.5Latin America
- 13Country Analysis
- 13.1United States
- 13.2China
- 13.3Japan
- 13.4Germany
- 13.5United Kingdom
- 13.6Canada
- 13.7South Korea
- 13.8India
- 13.9France
- 13.10Australia
- 13.11Saudi Arabia
- 13.12Singapore
- 14Forecast Scenarios
- 14.1Low Case
- 14.2Base Case
- 14.3High Case
- 15Competitive Insights
- 15.1Foxconn (Hon Hai Precision Industry)
- 15.2Quanta Computer (QCT)
- 15.3Wiwynn
- 15.4Dell Technologies
- 15.5Super Micro Computer
- 15.6NVIDIA and AMD as Accelerator Suppliers
- 15.7Market Concentration
- 16Recent Developments
- 16.1Hyperscaler Capex Updates, October 2026
- 16.2Supplier Results, August 2026
- Fig. 1Cloud Servers Market Size, 2020-2035 (USD Billion)
- Table 1Report Attributes
- Table 2Cloud Servers Scope Comparison
- Table 3Cloud Server Pricing, 2020-2035
- Table 4Market by Server Type, 2025 and 2035
- Table 5Market by Cloud Provider Type, 2025 and 2035
- Table 6Market by Form Factor, 2025 and 2035
- Table 7Market by Workload, 2025 and 2035
- Table 8Hyperscaler Capex-to-Server Bridge
- Table 9Market by Region, 2025 and 2035
- Table 10Top 12 Countries, 2025 and 2035
- Table 11Forecast Scenarios, 2035
About this report
Written by Amit Jain and reviewed by Deepti Agrawal, Senior Editor, Research. Figures are built top-down and bottom-up and reconciled before publication, with 2025 as the base year.
Read our methodologyHow we built this
- Historical period2020-2024
- Base year2025
- Forecast period2026-2035
- Sizing approachTop-down + bottom-up
Need more than the report?
Advisory on this market
Due diligence, site selection and market entry work, by the analysts who wrote this report.
See consulting servicesFrequently asked questions
USD 362.50 billion in 2026, up 43.28% from USD 253.00 billion in 2025, according to DC Market Insights estimates. The market is projected to reach USD 862.80 billion by 2035, a CAGR of 13.05% from 2025.
13.05% a year from 2025 to 2035, after 42.67% a year from 2020 to 2025, as accelerators installed in cloud servers rise from 8.0 million to 30.0 million.
USD 253.00 billion of server systems were bought by cloud service providers in 2025: GPU accelerated, custom ASIC and general-purpose servers. Enterprise-owned servers, virtual server rental, switches and storage arrays are excluded.
About USD 23,750 per accelerator installed in 2025, or about USD 190,000 for an 8-GPU system, DC Market Insights estimates. A general-purpose cloud server costs about USD 9,000.
About 65% of Alphabet’s third-quarter 2026 technical infrastructure spending went to servers and networking, and roughly three quarters of Microsoft’s USD 45.2 billion quarter went to short-lived assets such as CPUs and GPUs.
Rack-scale systems grow fastest at 22.23% a year to USD 414.14 billion by 2035. By workload, AI inference leads at 19.67%, and by buyer, sovereign and telecom clouds at 19.56%.
North America, with USD 146.74 billion or 58.00% of 2025 value. The Middle East and Africa grows fastest at 17.73% a year, and India is the fastest large country at 20.48%.
About 65% of 2025 value comes from the top five suppliers (DC Market Insights estimate), led by Foxconn, Quanta, Wiwynn, Dell Technologies and Super Micro Computer. NVIDIA and AMD supply most accelerators inside.
Custom ASIC servers grow 19.41% a year, from USD 34.20 billion in 2025 to USD 201.60 billion in 2035, rising to 23.37% of cloud server value.
USD 362.50 billion in 2026 counts only server hardware bought by cloud providers. Estimates that add enterprise servers, virtual server rental, switches or storage arrays come out larger; CPU-only estimates come out much smaller.
Get this report
How do I get the full report?
Request a quote; we reply by email within one business day.
How and when will I receive the report?
By email, within 24–48 business hours of payment.
How can I pay?
Once you accept the quote, we email you a secure payment link.
Can I see a sample first?
Yes. Request a free sample and we will email it to you.
Can the report be tailored to my needs?
Yes. We can add countries, segments or data cuts. Talk to an analyst about the scope you need.
Can I get an invoice or pay against a purchase order?
Write to sales@dcmarketinsights.com and our team will help.