
Edge Server Market Size, Share & Forecast to 2035
Market at a glance
The Edge Server market was worth USD 11.49 billion in 2025 and is forecast to reach USD 37.64 billion by 2035, growing at a 12.6% CAGR.
 By Amit Jain, Senior Consultant, ICT & Emerging Technologies
 Reviewed by Deepti Agrawal
Last updated 26 Oct 2026
Base year 2025 PDF + Excel
Key findings
Virtualized RAN Puts Servers at 20,000 Verizon Cell Sites
Sub-140 W GPU Inference Boxes Reach Stores and Plants
India's 5.63 Lakh 5G Base Stations
What is inside the report
- 01Introduction
- 02Executive Summary
- 03Market Scope
- 04Why Market Estimates Differ
- 05Market Drivers
- 06Market Trends
- 07Market Challenges and Restraints
- 08Market Opportunities
- 09Pricing Analysis
- 10Standards and Regulation
- 18chapters
- 2020-2024Historical period
- 2026-2035Forecast period
- —Companies profiled
Segmentation
Recent developments
the O-RAN ALLIANCE released 59 new or updated technical documents, taking its catalogue to 157 titles (Source: O-RAN ALLIANCE).
the Council of the EU published the Digital Decade annex estimating about 7,451 edge nodes in Member States in 2025 (Source: Council of the European Union).
Supermicro launched short-depth 1U and 2U edge systems with up to four RTX PRO GPUs (Source: Supermicro).
Dell Technologies announced the IP66 PowerEdge XR9700 for Cloud RAN and edge AI, with Rakuten Mobile as launch customer (Source: Dell Technologies).
Cisco Systems announced its Unified Edge platform for distributed AI workloads (Source: Cisco).
ETSI released its first MEC Phase 4 specifications (Source: ETSI).
Full analysis
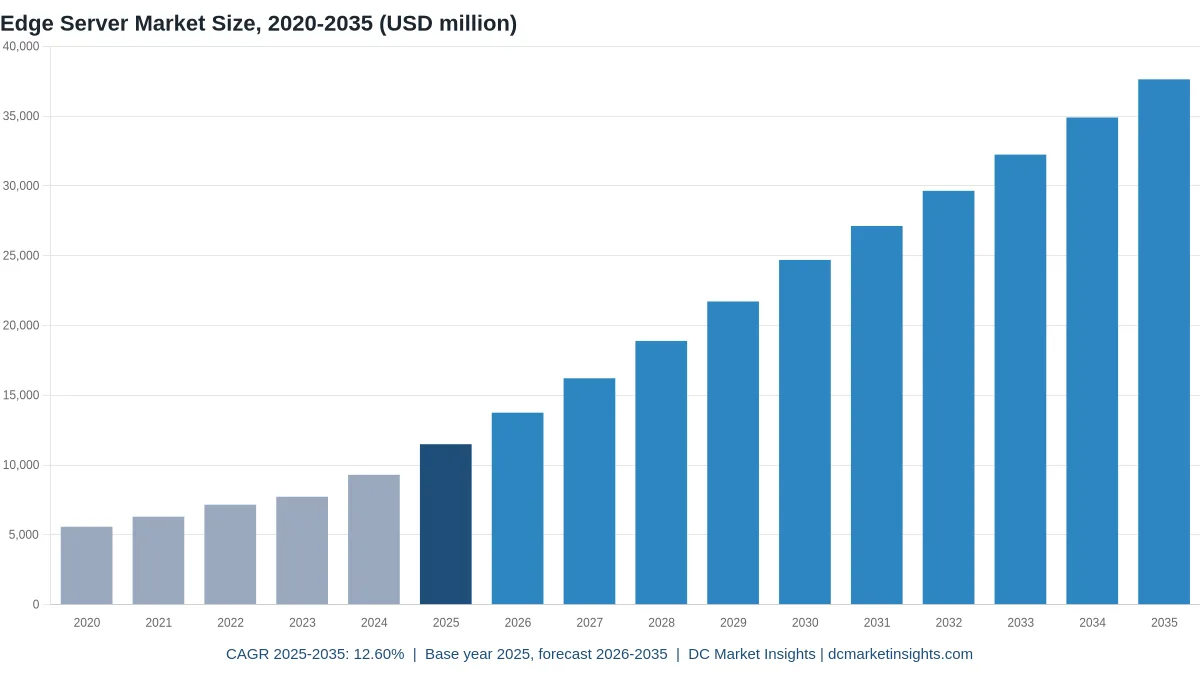
The Edge Server Market is valued at USD 13.75 billion in 2026 and is projected to reach USD 37.64 billion by 2035, up from USD 11.49 billion in 2025, a CAGR of 12.60% from 2025 to 2035 (DC Market Insights estimate). The money here moves with the radio network: telecom operators are taking baseband processing out of proprietary boxes and running it as software on servers at masts and cabinets, and Verizon alone counted more than 10,000 virtualized radio access network (vRAN) sites in May 2023 against a goal of more than 20,000 by the end of 2025 (Verizon, May 2023). The second lever is the graphics processing unit (GPU): compact boxes that draw under 140 watts (W), such as Lenovo’s ThinkEdge SE100, now run AI inference in stores and plants, which lifts the average edge server price from USD 10,448 in 2025 to USD 15,816 in 2035. The build receipt: 1.10 million edge servers shipped in 2025 x USD 10,448 average price = USD 11.49 billion, of which GPU-accelerated edge AI servers are USD 2.99 billion. GPU-accelerated edge AI servers are the fastest server type at 21.09% a year, and Asia Pacific is the fastest region at 14.05% because China alone ran 4.84 million 5G base stations at the end of 2025.
Key Market Statistics: How Big Is the Edge Server Market in 2026?
DC Market Insights values the Edge Server Market at USD 13.75 billion in 2026, 19.67% more than in 2025, as cell-site vRAN refreshes and GPU inference boxes ship faster than branch servers are retired.
- Edge server market size 2025: USD 11.49 billion
- Edge server market size 2026: USD 13.75 billion
- Edge server market size 2030: USD 24.70 billion
- Edge server market size 2035: USD 37.64 billion
- CAGR 2025-2035: 12.60% (low case 10.65%, high case 14.08%)
- Largest server type: short-depth rack edge servers, USD 5.19 billion or 45.1% of 2025 value
- Fastest server type: GPU-accelerated edge AI servers, 21.09% a year to USD 20.28 billion by 2035
- Largest application: telecom edge and multi-access edge computing (MEC), USD 3.10 billion in 2025, also the fastest application at 13.79%
- Leading region: North America, USD 4.14 billion or 36.0% of 2025 value; fastest region: Asia Pacific at 14.05%
- Largest country: United States, USD 3.68 billion in 2025; fastest large country: India at 18.96%
- Market leaders: Dell Technologies, Hewlett Packard Enterprise, Lenovo, Supermicro and Inspur (DC Market Insights assessment)
Key Takeaways: What Matters Most in the Edge Server Market?
Four findings explain why the Edge Server Market grows from USD 11.49 billion in 2025 to USD 37.64 billion by 2035.
- Telecom edge and MEC is the largest and fastest application, with 27.0% of 2025 value, because operators move baseband software onto cell-site servers.
- GPU-equipped units rise from 8% of edge server shipments in 2025 to 24% in 2035 because AI inference moves next to cameras, robots and tills.
- Arm processors grow 21.65% a year because power budgets at the mast and in sealed cabinets are fixed at a few hundred watts.
- Far edge sites overtake near edge sites in edge server value because each new 5G site, store or production line needs its own server, not a share of a regional hall.
Executive Summary: Edge Server Market Size, 2020-2035
The Global Edge Server Market size was valued at USD 5.58 billion in 2020, reached USD 11.49 billion in 2025, and is anticipated to reach USD 37.64 billion by 2035, at a CAGR of 12.60% during the forecast period. From 2020 to 2025 the edge server market grew 15.56% a year as 5G rollouts, store analytics and plant automation added boxes outside the core data center; from 2025 shipments grow more slowly but each unit carries more accelerator value.
| Attribute | Value |
|---|---|
| Historical period | 2020-2024 |
| Base year | 2025 |
| Forecast period | 2026-2035 |
| Market size 2025 | USD 11.49 billion |
| Market size 2026 | USD 13.75 billion |
| CAGR 2025-2035 | 12.60% |
| Market size 2035 | USD 37.64 billion |
| Segments covered | Server type, processor architecture, application, edge location, region, 12 countries |
Edge server shipments rise from 1.10 million units in 2025 to 2.38 million in 2035, 8.02% a year, while edge server value grows 12.60% a year. The gap is the GPU: the share of edge servers shipped with an accelerator climbs from 8% to 24%, and an accelerated unit sells for about 4 times a CPU-only one.
What Counts as an Edge Server?
The Edge Server Market is the USD 11.49 billion of server hardware shipped in 2025 for use outside core, cloud and hyperscale data centers.
Included: short-depth rack servers in cell sites, telecom central offices and street cabinets; compact and tower servers in stores, branches and clinics; rugged servers on plant floors, rail, vehicles and field sites; GPU-accelerated edge AI servers; servers installed in regional edge data centers of up to about 5 megawatts (MW).
Excluded: IoT gateways and industrial PCs without server-class processors, edge software and orchestration, managed edge services, networking switches, racks, power and cooling, and servers in core colocation or cloud halls.
How the segments fit together: the server type split sums to USD 11.49 billion in 2025; the processor, application and edge location splits and the five regions each sum to the same total in every year. The Rugged Server Market and the Micro Server Market cover adjacent server classes in full; here only their units sold for edge sites are counted.
Why Do Edge Server Market Estimates Differ?
DC Market Insights values the Edge Server Market at USD 13.75 billion in 2026 counting only server-class hardware at edge sites; narrower estimates count only purpose-built edge models, wider ones add gateways, software and services.
Narrow definitions keep only ruggedized or short-depth models sold under an edge brand and leave out the ordinary 1U and tower servers that run in stores and branch rooms, and the GPU servers placed in regional edge sites. Wide definitions add IoT gateways, industrial PCs, edge software platforms, orchestration and managed edge services; the Edge Computing Market counts that full stack and puts its 2025 hardware line at USD 28.87 billion, of which edge servers are 39.8%.
| Element | In this estimate | Why |
|---|---|---|
| Short-depth, compact and rugged CPU servers at edge sites | Yes, 74.0% of value | Server-class hardware outside the core |
| GPU-accelerated edge AI servers | Yes, 26.0% of value | Inference next to the data source |
| Servers in regional edge data centers | Yes, within near edge | Sites of a few MW serving one metro |
| IoT gateways and industrial PCs | No | No server-class processor or memory |
| Edge software, orchestration and managed services | No | Priced per node or per month |
| Racks, power, cooling and enclosures | No | Covered in edge data center reports |
In scope are small and medium-sized enterprises (SMEs) with one server in a shop as well as operators with 20,000 cell sites; out of scope are IoT gateways, industrial PCs, edge software, managed edge services and the building itself, which the Edge Data Center Market covers.
Market Drivers: Why Are Edge Server Shipments Rising?
Three forces add about USD 26.15 billion of yearly edge server spending between 2025 and 2035: vRAN at cell sites, China’s 5G and industrial networks, and the European Union (EU) edge node target.
Virtualized RAN Puts Servers at 20,000 Verizon Cell Sites
Verizon reported 8,000 vRAN sites in September 2022 and more than 10,000 by May 2023, with a goal of more than 20,000 by the end of 2025 (Verizon, May 2023); in the United Kingdom (UK) Samsung supplies vRAN and Open RAN across 2,500 Vodafone sites (Samsung, August 2023), and o2 Telefonica Germany launched Ericsson Cloud RAN on 8 masts in Offenbach (Ericsson, March 2025). Every converted site needs one or more short-depth servers, which is why telecom edge and MEC grows 13.79% a year to USD 11.29 billion by 2035.
China’s 4.84 Million 5G Base Stations and 23,000 Industrial 5G Networks
China had 4.838 million 5G base stations at the end of 2025, 37.6% of all mobile base stations, and 2.888 billion mobile Internet of Things (IoT) connections (Ministry of Industry and Information Technology of China, January 2026). The Ministry of Industry and Information Technology (MIIT) counts more than 23,000 industrial 5G private networks and 1,260 5G factory projects (MIIT, March 2026), and its upgraded plan targets 10,000 5G factories by 2027. Each private network needs local compute for MEC traffic and machine data, so DC Market Insights puts China’s edge server market at USD 1.61 billion in 2025, growing 13.67% a year.
EU Target of 10,000 Edge Nodes by 2030, With About 7,451 Counted in 2025
The EU Digital Decade target is 10,000 climate-neutral, highly secure edge nodes by 2030 (European Commission), and the Council of the EU’s 2026 Digital Decade annex estimated about 7,451 nodes across Member States in 2025 on a new method that cannot be compared with the 1,836 counted in 2024 on the old one. The EU defines an edge node by latency below 20 milliseconds (ms), and the Important Project of Common European Interest on cloud infrastructure and services (IPCEI-CIS) adds up to EUR 1.2 billion of public money for the cloud-to-edge continuum (European Commission, December 2023). Europe’s edge server market grows 11.80% a year to USD 7.72 billion.
Market Trends: How Are Edge Servers Changing?
Edge servers are getting accelerators, system-on-chip processors and sealed outdoor housings; the average edge server price rises from USD 10,448 in 2025 to USD 15,816 by 2035.
Sub-140 W GPU Inference Boxes Reach Stores and Plants
Lenovo’s ThinkEdge SE100, launched in March 2025, is 85% smaller than a standard 1U server and stays under 140 W fully GPU-equipped; Lenovo said it had shipped over a million edge systems with 13 consecutive quarters of edge revenue growth (Lenovo, March 2025). Supermicro’s short-depth 1U and 2U systems take up to four RTX PRO GPUs at as low as 165 W each (Supermicro, March 2026). GPU-accelerated edge AI servers therefore grow 21.09% a year, the fastest edge server type.
System-on-Chip Processors With Built-In vRAN Acceleration
Intel’s Xeon 6 system-on-chip (SoC) delivers up to 2.4 times the radio access network (RAN) capacity of the previous generation and up to 3.2 times the RAN AI performance per core (Intel), and Dell’s PowerEdge XR8720t packs up to 72 cores and 24 SFP28 ports into 2U, with global availability from the first quarter of 2026 (Dell Technologies, September 2025). Integrated accelerators cut the number of servers per cell site, so DC Market Insights holds edge server unit growth to 8.02% a year while Arm processors, the other low-power route, rise from 12.0% to 26.0% of value.
IP66 Servers Mounted on Poles and Rooftops
Dell’s PowerEdge XR9700, announced in February 2026, is an IP66-rated 15-litre server that runs up to 15 5G sectors from -40 degrees Celsius (C) to 46 C and mounts on utility poles and rooftops, with Rakuten Mobile as launch customer and availability in the second half of 2026 (Dell Technologies, February 2026). Sealed outdoor units move edge server value from cabinets to the far edge, so far edge sites grow 14.14% a year.
Market Challenges and Restraints: What Slows Edge Server Demand?
Slow standalone 5G and new AI rules hold the edge server market below DC Market Insights’ high case of USD 42.91 billion by 2035.
Standalone 5G Is Only 20.9% of EU Base Stations
The European Commission’s 2026 5G observatory found that 5G standalone (SA) base stations were only 20.9% of all mobile base stations and that 3.4-3.8 GHz mid-band 5G covered 74.8% of households (European Commission, June 2026); worldwide, 5G covered 55% of people in 2025 but only 4% in low-income countries (International Telecommunication Union, October 2025). MEC needs a standalone core, so slow SA rollout keeps the Middle East and Africa at 4.0% and Latin America at 5.0% of 2025 edge server value.
EU AI Act High-Risk Rules From December 2027
After the AI Omnibus took effect on 27 July 2026, EU AI Act high-risk rules for Annex III AI systems apply from 2 December 2027 and for AI built into products from 2 August 2028 (European Commission, October 2026). Vision systems in plants, stores and transport fall into these classes, and buyers delay edge AI projects until conformity work is clear; DC Market Insights assumes GPU edge server shipments in Europe lag North America by about two years, which holds Europe to 11.80% a year.
Market Opportunities: Where Is the New Edge Server Money?
India’s 5G sites and plant-floor AI add USD 7.03 billion of yearly edge server spending between 2025 and 2035.
India’s 5.63 Lakh 5G Base Stations
India’s Department of Telecommunications (DoT) counted 5.08 lakh (508,000) 5G base transceiver stations on 31 October 2025, and a June 2026 government factsheet put the count at 5.63 lakh (Press Information Bureau). With MEC and enterprise private networks following the radio build, DC Market Insights expects India’s edge server market to grow from USD 344.78 million in 2025 to USD 1.96 billion by 2035, 18.96% a year, the fastest of the 12 countries.
Industrial Edge AI Platforms on the Plant Floor
NVIDIA’s IGX Thor industrial edge platform delivers up to 5,581 FP4 teraflops (TFLOPS), up to eight times the integrated GPU compute of IGX Orin (NVIDIA). Machines with that compute next to the line replace cloud round trips for inspection and robot control, so manufacturing and industrial edge servers grow from USD 2.07 billion in 2025 to USD 7.49 billion by 2035.
Pricing Analysis: How Much Does an Edge Server Cost?
An edge server sold for about USD 10,448 on average in 2025 (DC Market Insights estimate), rising to USD 15,816 by 2035 as GPU units take a larger share of edge server shipments.
| Year | Units shipped (thousand) | CPU-only edge server price | GPU edge server price | Blended price |
|---|---|---|---|---|
| 2020 | 700 | USD 7,600 | USD 26,000 | USD 7,968 |
| 2025 | 1,100 | USD 8,400 | USD 34,000 | USD 10,448 |
| 2030 | 1,760 | USD 9,100 | USD 36,500 | USD 14,032 |
| 2035 | 2,380 | USD 9,600 | USD 35,500 | USD 15,816 |
Public anchors: vendors do not publish edge server list prices, so DC Market Insights uses its own anchors, the USD 8,400 average edge system price in the Edge Computing Market report and the price ladder below. The CPU-only edge server price rises from USD 8,400 in 2025 because SoC processors with vRAN acceleration add value inside the box, while the GPU unit price flattens after 2030 as inference GPUs get cheaper per teraflop.
Standards and Regulation: Which Rules Shape Edge Servers?
Seven standards and laws shape how the USD 11.49 billion of edge servers shipped in 2025 are built and where they are placed.
ETSI MEC Phase 4
The European Telecommunications Standards Institute (ETSI) group on multi-access edge computing released its first Phase 4 specifications on 31 October 2025, including developer application programming interface (API) and distributed computing reports (Source: ETSI).
O-RAN Release 5
The O-RAN ALLIANCE completed Release 5 with the November 2025 specifications, adding AI RAN framework enhancements, and lists 157 technical document titles (Source: O-RAN ALLIANCE, July 2026).
3GPP Release 20
The 3rd Generation Partnership Project (3GPP) targets the Release 20 Stage-3 freeze for March 2027; normative 6G work follows in Release 21 (Source: 3GPP).
ETSI EN 300 019-1-3
The ETSI environmental class standard for stationary equipment at weather-protected locations; Class 3.1 covers +5 to +40 degrees C, the baseline that outdoor edge servers exceed (Source: ETSI).
EU Data Act
Entered into force on 11 January 2024 and applies from 12 September 2025, giving users of connected products access to their data, which favours local processing (Source: European Commission).
EU AI Act
In force since 1 August 2024 with general application from 2 August 2026; high-risk rules for Annex III systems apply from 2 December 2027 (Source: European Commission).
EU Digital Decade Edge Target
10,000 climate-neutral, highly secure edge nodes by 2030, measured by latency below 20 ms (Source: European Commission).
Market Segmentation: Which Edge Server Segment Is Largest?
Short-depth rack edge servers are the largest type with 45.1% of 2025 value, telecom edge and MEC the largest application, and GPU-accelerated edge AI servers the fastest type at 21.09% a year.
By Server Type
GPU-accelerated edge AI servers become the largest edge server type by 2035 with 53.9% of value, overtaking short-depth rack servers.
| Server Type | 2025 (USD million) | Share 2025 | 2035 (USD million) | CAGR 2025-2035 |
|---|---|---|---|---|
| Short-Depth Rack Edge Servers | USD 5,185.49 million | 45.1% | USD 10,592.33 million | 7.40% |
| Compact and Tower Edge Servers | USD 2,550.24 million | 22.2% | USD 4,688.41 million | 6.28% |
| Rugged Edge Servers | USD 765.07 million | 6.7% | USD 2,083.74 million | 10.54% |
| GPU-Accelerated Edge AI Servers | USD 2,992.00 million | 26.0% | USD 20,277.60 million | 21.09% |
By Processor Architecture
x86 processors hold 88.0% of 2025 edge server value; Arm processors grow 21.65% a year as operators and appliance makers chase performance per watt.
| Processor Architecture | 2025 (USD million) | Share 2025 | 2035 (USD million) | CAGR 2025-2035 |
|---|---|---|---|---|
| x86 Processors | USD 10,113.66 million | 88.0% | USD 27,855.14 million | 10.66% |
| Arm Processors | USD 1,379.14 million | 12.0% | USD 9,786.94 million | 21.65% |
By Application
Telecom edge and MEC leads edge server spending with 27.0% of 2025 value; retail and branch offices are second but the slowest-growing large application at 10.52% as store server counts are consolidated.
| Application | 2025 (USD million) | Share 2025 | 2035 (USD million) | CAGR 2025-2035 |
|---|---|---|---|---|
| Telecom Edge and MEC | USD 3,103.06 million | 27.0% | USD 11,292.62 million | 13.79% |
| Retail and Branch Offices | USD 2,298.56 million | 20.0% | USD 6,248.59 million | 10.52% |
| Manufacturing and Industrial | USD 2,068.70 million | 18.0% | USD 7,490.77 million | 13.73% |
| Transportation and Smart Cities | USD 1,149.28 million | 10.0% | USD 4,140.63 million | 13.67% |
| Healthcare | USD 919.42 million | 8.0% | USD 3,086.65 million | 12.87% |
| Government and Defense | USD 1,264.21 million | 11.0% | USD 3,199.58 million | 9.73% |
| Energy and Utilities | USD 689.57 million | 6.0% | USD 2,183.24 million | 12.22% |
By Edge Location
Near edge and regional edge data centers hold 52.0% of 2025 edge server value; far edge sites grow faster and take 55.0% by 2035.
| Edge Location | 2025 (USD million) | Share 2025 | 2035 (USD million) | CAGR 2025-2035 |
|---|---|---|---|---|
| Far Edge Sites | USD 5,516.54 million | 48.0% | USD 20,703.14 million | 14.14% |
| Near Edge and Regional Edge Data Centers | USD 5,976.26 million | 52.0% | USD 16,938.94 million | 10.98% |
DC Exclusive: Edge Server Price Ladder, 5 Classes From USD 6,376 to USD 63,808
This price ladder is a DC Market Insights model built on 10 inputs, a unit count and an average price for each of 5 edge server classes, and it reconciles exactly with the 1.10 million units and USD 11.49 billion of the 2025 edge server market. It shows buyers what each class costs and where the value sits: the two GPU classes are 8.0% of units but 26.0% of value.
| Edge server class | Units 2025 (thousand) | Average price 2025 | Value 2025 (USD million) | Share of value | Typical build |
|---|---|---|---|---|---|
| Compact and tower edge servers | 400 | USD 6,376 | USD 2,550.24 million | 22.2% | 1-socket tower or 1U half-width box for a store or branch room |
| Short-depth 1U/2U rack edge servers | 539 | USD 9,621 | USD 5,185.49 million | 45.1% | Short chassis for cell sites, street cabinets and central offices |
| Rugged edge servers | 73 | USD 10,480 | USD 765.07 million | 6.7% | Wide-temperature, shock-rated box for plants, vehicles and field sites |
| Single-GPU edge inference servers | 62 | USD 21,500 | USD 1,333.00 million | 11.6% | One inference-class GPU for vision and small language models |
| Multi-GPU edge AI servers | 26 | USD 63,808 | USD 1,659.00 million | 14.4% | 2 to 4 GPUs for retrieval, video analytics and local model hosting |
Reading the ladder: a multi-GPU edge AI server costs about 10 times a compact tower edge server, so moving one store in ten from a tower to a GPU box changes edge server spending more than adding a new store. Rugged edge servers cost about 9% more than short-depth rack servers for the sealing and wide temperature range.
Regional Insights: Which Region Leads the Edge Server Market?
North America leads the Edge Server Market with 36.0% of 2025 value; Asia Pacific is the fastest region at 14.05% a year and the largest by 2035.
| Region | 2025 (USD million) | Share 2025 | 2035 (USD million) | CAGR 2025-2035 |
|---|---|---|---|---|
| North America | USD 4,137.41 million | 36.0% | USD 12,233.67 million | 11.45% |
| Asia Pacific | USD 3,792.62 million | 33.0% | USD 14,115.78 million | 14.05% |
| Europe | USD 2,528.42 million | 22.0% | USD 7,716.63 million | 11.80% |
| Latin America | USD 574.64 million | 5.0% | USD 1,957.39 million | 13.04% |
| Middle East and Africa | USD 459.71 million | 4.0% | USD 1,618.61 million | 13.41% |
North America
North America’s edge server market grows 11.45% a year. Verizon’s vRAN programme sets the telecom pace, and the US Department of Energy (DOE) expects data centers to use 6.7% to 12% of US electricity by 2028, up from 4.4% in 2023, which pushes some inference out of grid-limited metro halls to edge sites.
Asia Pacific
Asia Pacific’s edge server market grows 14.05% a year. China’s 4.838 million 5G base stations and 938,000 carrier data center racks lead, Japan had 307,000 5G base stations in March 2025 of which 156,000 were standalone-capable (Ministry of Internal Affairs and Communications), and India adds the fastest country growth.
Europe
Europe’s edge server market grows 11.80% a year. About 7,451 EU edge nodes were counted in 2025, 368 of them in the Netherlands, and Ofcom found 5G standalone available across 83% of UK areas outside premises in November 2025.
Latin America
Latin America’s edge server market grows 13.04% a year, led by Brazil, where retail chains and mining sites buy rugged and compact edge servers ahead of telecom MEC.
Middle East and Africa
The Middle East and Africa edge server market grows 13.41% a year. Saudi Arabia leads and grows 15.34% a year, while 5G reaches only 4% of people in low-income countries (ITU), which keeps most of Africa on branch servers rather than MEC.
Country Analysis: Top 12 Countries in the Edge Server Market
The United States is the largest edge server country with 32.0% of 2025 value and China second with 14.0%; India is the fastest large country at 18.96% a year.
| Rank | Country | Region | 2025 (USD million) | Share 2025 | 2035 (USD million) | CAGR 2025-2035 |
|---|---|---|---|---|---|---|
| 1 | United States | North America | USD 3,677.70 million | 32.0% | USD 10,765.63 million | 11.34% |
| 2 | China | Asia Pacific | USD 1,608.99 million | 14.0% | USD 5,796.88 million | 13.67% |
| 3 | Japan | Asia Pacific | USD 643.60 million | 5.6% | USD 1,919.75 million | 11.55% |
| 4 | Germany | Europe | USD 540.16 million | 4.7% | USD 1,618.61 million | 11.60% |
| 5 | United Kingdom | Europe | USD 390.76 million | 3.4% | USD 1,166.90 million | 11.56% |
| 6 | India | Asia Pacific | USD 344.78 million | 3.0% | USD 1,957.39 million | 18.96% |
| 7 | Canada | North America | USD 333.29 million | 2.9% | USD 1,016.34 million | 11.79% |
| 8 | South Korea | Asia Pacific | USD 321.80 million | 2.8% | USD 1,129.26 million | 13.38% |
| 9 | France | Europe | USD 298.81 million | 2.6% | USD 903.41 million | 11.70% |
| 10 | Brazil | Latin America | USD 252.84 million | 2.2% | USD 865.77 million | 13.10% |
| 11 | Australia | Asia Pacific | USD 218.36 million | 1.9% | USD 715.20 million | 12.60% |
| 12 | Saudi Arabia | Middle East and Africa | USD 126.42 million | 1.1% | USD 526.99 million | 15.34% |
India had about a ninth of China’s 5G base stations in mid-2026 (5.63 lakh against 4.838 million), and its edge server base is about a fifth of China’s, so DC Market Insights expects India to rise from rank 6 to the third-largest edge server country by 2035.
Forecast Scenarios: Edge Server Market in 2035
The base case for the Edge Server Market is USD 37.64 billion by 2035; the range runs from USD 31.62 billion to USD 42.91 billion.
| Scenario | 2035 size | CAGR 2025-2035 | Assumption |
|---|---|---|---|
| Low | USD 31.62 billion | 10.65% | vRAN stalls outside the US, Japan and China and the GPU share of units reaches 18% instead of 24% |
| Base | USD 37.64 billion | 12.60% | 2.38 million units in 2035, 24% GPU-equipped, blended price USD 15,816 |
| High | USD 42.91 billion | 14.08% | EU edge node target met early and 5G standalone covers most of the EU and India by 2030 |
Key Players and Market Share: Who Leads the Edge Server Market?
The five largest edge server vendors, Dell Technologies, HPE, Lenovo, Supermicro and Inspur, hold about 52% of the USD 11.49 billion edge server market in 2025 (DC Market Insights estimate based on vendor server revenue and edge product breadth).
- Dell Technologies
- Hewlett Packard Enterprise (HPE)
- Lenovo
- Super Micro Computer (Supermicro)
- Cisco Systems
- Inspur
- Huawei
- Advantech
- Fujitsu
- NEC
- Kontron
- Siemens
- Samsung Electronics
- Ericsson
- Nokia
- NVIDIA
- Intel
Dell Technologies reported Infrastructure Solutions Group (ISG) revenue of USD 60.8 billion in fiscal 2026, up 40%, with traditional servers and networking at USD 19.51 billion, up 9% (Dell Technologies, February 2026). HPE’s server segment revenue was USD 17.75 billion in fiscal 2025 (HPE, December 2025), Lenovo’s Infrastructure Solutions Group reached a record USD 19.2 billion in fiscal 2025/26, up 32% (Lenovo, May 2026), and Supermicro’s fiscal 2025 net sales were USD 22.0 billion against USD 15.0 billion (Supermicro, August 2025). Together these four report about USD 78.46 billion of server and infrastructure revenue, so the edge server market equals 14.6% of it. Advantech, which sells industrial edge computers and servers, reported 2025 revenue of USD 2.27 billion, up 22% (Advantech, February 2026), and Cisco Systems made its Unified Edge platform orderable in November 2025 (Cisco, November 2025).
Recent Developments in the Edge Server Market
Six dated moves from October 2025 to July 2026 shape the USD 13.75 billion edge server market in 2026.
- In July 2026, the O-RAN ALLIANCE released 59 new or updated technical documents, taking its catalogue to 157 titles (Source: O-RAN ALLIANCE).
- In June 2026, the Council of the EU published the Digital Decade annex estimating about 7,451 edge nodes in Member States in 2025 (Source: Council of the European Union).
- In March 2026, Supermicro launched short-depth 1U and 2U edge systems with up to four RTX PRO GPUs (Source: Supermicro).
- In February 2026, Dell Technologies announced the IP66 PowerEdge XR9700 for Cloud RAN and edge AI, with Rakuten Mobile as launch customer (Source: Dell Technologies).
- In November 2025, Cisco Systems announced its Unified Edge platform for distributed AI workloads (Source: Cisco).
- In October 2025, ETSI released its first MEC Phase 4 specifications (Source: ETSI).
Research Methodology: How DC Market Insights Sized the Edge Server Market
The DC Market Insights model multiplies 1.10 million edge servers shipped in 2025 by an average price of USD 10,448, giving USD 11.49 billion; the general approach is set out in the DC Market Insights research methodology.
Units are split into CPU-only edge servers (1.01 million at USD 8,400) and GPU-equipped edge servers (88 thousand at USD 34,000); shipments, the GPU share and both prices are set for every year from 2020 to 2035, and every segment, region and country split sums to the total each year.
- Bound check 1 (ceiling): the edge server market is 39.8% of the USD 28.87 billion hardware line of the DC Market Insights Edge Computing Market, which also counts gateways and industrial PCs.
- Bound check 2 (ceiling): it is 14.6% of the USD 78.46 billion of server and infrastructure revenue reported by Dell Technologies (traditional servers and networking), HPE, Lenovo ISG and Supermicro for their latest fiscal years.
- Bound check 3 (floor): Lenovo’s more than one million edge systems shipped by March 2025, valued at the USD 6,376 compact class price, give at least USD 6.38 billion across several years for one vendor, below the USD 11.49 billion total for 2025 alone.
Table of contents
- 01Introduction
- 1.1Report Description
- 1.2Key Market Statistics, 2025, 2026, 2030 and 2035
- 1.3Key Takeaways
- 02Executive Summary
- 2.1Market Snapshot, 2025, 2026 and 2035
- 2.2Market Size Chart, 2020-2035
- 03Market Scope
- 3.1Included
- 3.2Excluded
- 3.3How the Segments Fit Together
- 04Why Market Estimates Differ
- 4.1Scope Table: In and Out of This Estimate
- 05Market Drivers
- 5.1Virtualized RAN Puts Servers at 20,000 Verizon Cell Sites
- 5.2China's 4.84 Million 5G Base Stations and 23,000 Industrial 5G Networks
- 5.3EU Target of 10,000 Edge Nodes by 2030, With About 7,451 Counted in 2025
- 06Market Trends
- 6.1Sub-140 W GPU Inference Boxes Reach Stores and Plants
- 6.2System-on-Chip Processors With Built-In vRAN Acceleration
- 6.3IP66 Servers Mounted on Poles and Rooftops
- 07Market Challenges and Restraints
- 7.1Standalone 5G Is Only 20.9% of EU Base Stations
- 7.2EU AI Act High-Risk Rules From December 2027
- 08Market Opportunities
- 8.1India's 5.63 Lakh 5G Base Stations
- 8.2Industrial Edge AI Platforms on the Plant Floor
- 09Pricing Analysis
- 9.1Edge Server Prices, 2020-2035
- 9.2Public Price Anchors
- 10Standards and Regulation
- 10.1ETSI MEC Phase 4
- 10.2O-RAN Release 5
- 10.33GPP Release 20
- 10.4ETSI EN 300 019-1-3
- 10.5EU Data Act
- 10.6EU AI Act
- 10.7EU Digital Decade Edge Target
- 11Market Segmentation
- 11.1By Server Type
- 11.2Short-Depth Rack Edge Servers
- 11.3Compact and Tower Edge Servers
- 11.4Rugged Edge Servers
- 11.5GPU-Accelerated Edge AI Servers
- 11.6By Processor Architecture
- 11.7x86 Processors
- 11.8Arm Processors
- 11.9By Application
- 11.10Telecom Edge and MEC
- 11.11Retail and Branch Offices
- 11.12Manufacturing and Industrial
- 11.13Transportation and Smart Cities
- 11.14Healthcare
- 11.15Government and Defense
- 11.16Energy and Utilities
- 11.17By Edge Location
- 11.18Far Edge Sites
- 11.19Near Edge and Regional Edge Data Centers
- 12DC Exclusive: Edge Server Price Ladder
- 12.1Compact and tower edge servers
- 12.2Short-depth 1U/2U rack edge servers
- 12.3Rugged edge servers
- 12.4Single-GPU edge inference servers
- 12.5Multi-GPU edge AI servers
- 13Regional Insights
- 13.1North America
- 13.2Asia Pacific
- 13.3Europe
- 13.4Latin America
- 13.5Middle East and Africa
- 14Country Analysis
- 14.1United States
- 14.2China
- 14.3Japan
- 14.4Germany
- 14.5United Kingdom
- 14.6India
- 14.7Canada
- 14.8South Korea
- 14.9France
- 14.10Brazil
- 14.11Australia
- 14.12Saudi Arabia
- 15Forecast Scenarios, 2035
- 15.1Low Scenario
- 15.2Base Scenario
- 15.3High Scenario
- 16Key Players and Market Share
- 16.1Dell Technologies
- 16.2Hewlett Packard Enterprise (HPE)
- 16.3Lenovo
- 16.4Super Micro Computer (Supermicro)
- 16.5Cisco Systems
- 16.6Inspur
- 16.7Huawei
- 16.8Advantech
- 16.9Fujitsu
- 16.10NEC
- 16.11Kontron
- 16.12Siemens
- 16.13Samsung Electronics
- 16.14Ericsson
- 16.15Nokia
- 16.16NVIDIA
- 16.17Intel
- 16.18Vendor Concentration, 2025
- 17Recent Developments
- 17.1O-RAN Technical Documents, July 2026
- 17.2EU Edge Node Count, June 2026
- 17.3Supermicro RTX PRO Edge Systems, March 2026
- 17.4Dell PowerEdge XR9700, February 2026
- 17.5Cisco Unified Edge, November 2025
- 17.6ETSI MEC Phase 4, October 2025
- 18Research Methodology
- 18.1Model Inputs
- 18.2Bound Checks
- Fig. 1Edge Server Market Size, 2020-2035 (USD million)
- Table 1Market Snapshot, 2025, 2026 and 2035
- Table 2Scope Table: In and Out of This Estimate
- Table 3Edge Server Prices, 2020-2035
- Table 4Market by Server Type, 2025 and 2035
- Table 5Market by Processor Architecture, 2025 and 2035
- Table 6Market by Application, 2025 and 2035
- Table 7Market by Edge Location, 2025 and 2035
- Table 8Edge Server Price Ladder, 2025
- Table 9Market by Region, 2025 and 2035
- Table 10Top 12 Countries, 2025 and 2035
- Table 112035 Forecast Scenarios
About this report
Written by Amit Jain and reviewed by Deepti Agrawal, Senior Editor, Research. Figures are built top-down and bottom-up and reconciled before publication, with 2025 as the base year.
Read our methodologyHow we built this
- Historical period2020-2024
- Base year2025
- Forecast period2026-2035
- Sizing approachTop-down + bottom-up
Need more than the report?
Advisory on this market
Due diligence, site selection and market entry work, by the analysts who wrote this report.
See consulting servicesFrequently asked questions
USD 13.75 billion in 2026, up 19.67% from USD 11.49 billion in 2025, according to DC Market Insights estimates. The market is projected to reach USD 37.64 billion by 2035, a CAGR of 12.60% from 2025.
12.60% a year from 2025 to 2035, after 15.56% a year from 2020 to 2025. Shipments grow 8.02% a year, from 1.10 million to 2.38 million units, and GPU-equipped units rise from 8% to 24% of shipments.
A server-class computer installed outside core and cloud data centers: at a cell site, telecom central office, store, branch, clinic, plant floor, vehicle or a small regional edge site. IoT gateways and industrial PCs without server-class processors are not counted.
About USD 10,448 on average in 2025 (DC Market Insights estimate): roughly USD 8,400 for a CPU-only unit and USD 34,000 for a GPU-equipped one, from USD 6,376 for a compact tower to USD 63,808 for a multi-GPU edge AI server.
Virtualized RAN runs baseband software on servers at the cell site. Verizon counted more than 10,000 vRAN sites in May 2023 with a goal of more than 20,000 by the end of 2025. Telecom edge and MEC grows 13.79% a year.
GPU-accelerated edge AI servers, at 21.09% a year to USD 20.28 billion by 2035, as sub-140 W inference boxes such as Lenovo’s ThinkEdge SE100 reach stores and plants. Short-depth rack edge servers are the largest type in 2025.
North America, with USD 4.14 billion or 36.0% of 2025 value. Asia Pacific is the fastest region at 14.05% a year and becomes the largest by 2035; India is the fastest large country at 18.96%.
Dell Technologies, Hewlett Packard Enterprise, Lenovo, Supermicro and Inspur hold about 52% of 2025 value (DC Market Insights estimate). Cisco Systems, Huawei, Advantech, Fujitsu, NEC, Kontron and Siemens follow, with Intel and NVIDIA supplying edge processors.
10,000 climate-neutral, highly secure edge nodes, measured by latency below 20 ms. The Council of the EU estimated about 7,451 nodes in 2025 on a new method that cannot be compared with earlier counts.
USD 13.75 billion in 2026 counts only server-class hardware at edge sites. Narrow estimates count only edge-branded rugged or short-depth models; wide ones add IoT gateways, industrial PCs, edge software and managed services.
Licences, delivery and payment
Which licence should I choose?
Single User is a view-only PDF for one person. Multi User adds a printable PDF and the Excel data for unlimited users at one location. Enterprise covers your whole company and includes 100 free analyst hours.
How and when will I receive the report?
By email, within 24–48 business hours of payment, in the formats of your licence.
How can I pay?
Securely through PayPal: with a PayPal account, a debit or credit card, or PayPal Pay Later where available. Prices are in US dollars.
Can I see a sample first?
Yes. Request a free sample and we will email it to you.
Can the report be tailored to my needs?
Yes. We can add countries, segments or data cuts. Talk to an analyst about the scope you need.
Can I get an invoice or pay against a purchase order?
Write to sales@dcmarketinsights.com and our team will help.