
Data Center Air Filtration Market Size, Share & Forecast to 2035
Market at a glance
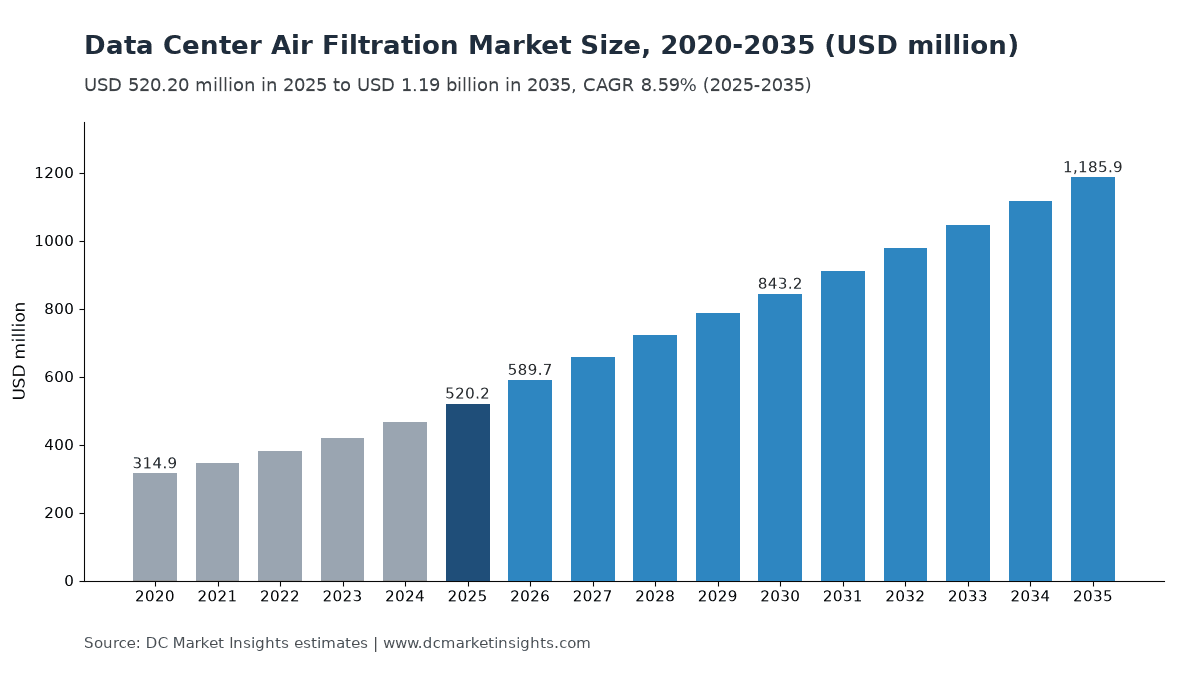
The Data Center Air Filtration market was worth USD 520.2 million in 2025 and is forecast to reach USD 1,185.9 million by 2035, growing at a 8.59% CAGR.
 By Amit Jain, Senior Consultant, ICT & Emerging Technologies
 Reviewed by Deepti Agrawal
Last updated 20 Oct 2026
Base year 2025 PDF + Excel
What is inside the report
- 01Introduction
- 02Research Methodology
- 03Executive Summary
- 04What Does Data Center Air Filtration Cover?
- 05Why Do Data Center Air Filtration Market Estimates Differ?
- 06Market Drivers
- 07Market Trends
- 08Market Challenges
- 09Market Opportunities
- 10Pricing
- 18chapters
- 2020-2024Historical period
- 2026-2035Forecast period
- —Companies profiled
Segmentation
Recent developments
Camfil opened a HEPA and ULPA filter line at its Manesar plant in India (Source: Camfil).
Parker Hannifin agreed to acquire Filtration Group, including Purafil, for USD 9.25 billion in cash (Source: Parker Hannifin).
AAF International launched its AstroSorb molecular filter line in the United States (Source: AAF International).
Camfil acquired Bioconservación (Bion) of Spain to expand its molecular contamination control division (Source: Camfil).
Donaldson completed its acquisition of Facet Filtration, and Camfil broke ground on a 14,400 square metre expansion site in Malaysia (Source: Donaldson; Camfil).
Parker completed the Filtration Group acquisition, which it expects to add about USD 1.8 billion to fiscal 2027 sales (Source: Filtration Group).
Full analysis
The Data Center Air Filtration Market is valued at USD 589.74 million in 2026 and is projected to reach USD 1.19 billion by 2035, up from USD 520.20 million in 2025, a compound annual growth rate (CAGR) of 8.59% from 2025 to 2035 (DC Market Insights estimate). This is a consumables market first: 78.3% of 2025 value is replacement filters and media, bought every few months for the 113.1 gigawatts (GW) of information technology (IT) load that still rejects its heat to air. The American Society of Heating, Refrigerating and Air-Conditioning Engineers (ASHRAE) Technical Committee 9.9 asks data halls to stay at ISO 14644-1 Class 8 cleanliness and, where gases exceed a copper corrosion rate of 300 angstroms (Å) a month or a silver rate of 200 Å a month, recommends gas-phase filtration, so DC Market Insights puts the yearly filter bill at about USD 3,600 per megawatt (MW) of air-handled load in 2025. Gas-phase (chemical) filtration is the fastest filter type at 11.16% a year, and the Middle East and Africa is the fastest region at 12.13% a year, because desert dust shortens filter life on new Gulf campuses.
Key Market Statistics: How Big Is the Data Center Air Filtration Market in 2026?
DC Market Insights values the Data Center Air Filtration Market at USD 589.74 million in 2026, 13.4% above 2025, because about 14.5 GW of new data center capacity is fitted with filters while the air-handled installed base grows to about 123 GW.
- Market size 2025: USD 520.20 million
- Market size 2026: USD 589.74 million
- Market size 2030: USD 843.18 million
- Market size 2035: USD 1.19 billion (USD 1,185.94 million)
- CAGR 2025-2035: 8.59% in the base case, 7.55% in the low case and 9.78% in the high case
- Largest filter type: fine filters (bag and rigid box), 38.0% of 2025 value (USD 197.68 million)
- Fastest-growing filter type: gas-phase (chemical) filtration, 11.16% a year
- Largest purchase type: replacement filters and media, 78.3% of 2025 value
- Leading region: North America, 39.0% of 2025 value (USD 202.87 million)
- Fastest-growing region: Middle East and Africa, 12.13% a year
- Largest country: the United States, USD 189.34 million in 2025
- Market leader: Camfil, about 15% of 2025 value (DC Market Insights assessment)
Executive Summary
The Global Data Center Air Filtration Market size was valued at USD 314.90 million in 2020, reached USD 520.20 million in 2025, and is anticipated to reach USD 1,185.94 million by 2035, at a CAGR of 8.59% during the forecast period.
| Report attribute | Details |
|---|---|
| Historical Period | 2020-2024 |
| Base Year | 2025 |
| Forecast Period | 2026-2035 |
| Data Center Air Filtration Market Size 2025 | USD 520.20 Million |
| Data Center Air Filtration Market Size 2026 | USD 589.74 Million |
| Data Center Air Filtration Market, CAGR | 8.59% |
| Data Center Air Filtration Market Size 2035 | USD 1,185.94 Million |
Growth slowed from 10.56% a year in 2020-2025 to 8.59% a year in 2025-2035 for one reason: liquid cooling takes heat away from the air path. DC Market Insights estimates the installed liquid-cooled base at 3.83 GW in 2025 and 94.07 GW in 2035, and each liquid-cooled MW still sends about 15% to 25% of its heat to room air. The air-handled load therefore grows from 113.1 GW to 231.0 GW, slower than the total installed base of 116 GW to 311 GW, and first-fit filter spending on new builds grows only 5.48% a year, against 9.33% a year for replacement filters and media.
Key Takeaways
- USD 407.26 million, or 78.3% of 2025 value, is replacement spending, because filters on 113.1 GW of air-handled load are changed one to two times a year, so the market tracks the installed base more than new construction.
- USD 3,600 per MW a year is the 2025 fleet-average filter bill, because 1 MW of air-cooled IT load moves about 146,400 cubic feet per minute (CFM) of air through about 73 filter faces (DC Market Insights model).
- 11.16% a year is the gas-phase growth rate, because the ASHRAE G1 corrosion limit (copper below 300 Å a month, silver below 200 Å a month) is hard to meet near traffic, industry and coal power in Asia Pacific hubs.
- 27.0% of 2025 value sits at outside-air economizer intakes, because ASHRAE TC 9.9 and the Lawrence Berkeley National Laboratory (LBNL) both point free-air sites to minimum efficiency reporting value (MERV) 13 filters.
- 5.48% a year is the first-fit growth rate, because Schneider Electric (August 2026) puts 80% or more of a liquid-cooled rack’s heat on cold plates, which shrinks the air path of each new AI hall.
What Does Data Center Air Filtration Cover?
The market covers USD 520.20 million of 2025 spending on air filters, filter media and filter housings bought for data centers, at first fit and as replacements.
Included
Panel and pleated pre-filters; bag and rigid box fine filters rated MERV 11 to MERV 16 or ISO 16890 ePM1 (particulate matter of 1 micron) classes; high-efficiency particulate air (HEPA) and efficient particulate air (EPA) filters used in clean zones and sensitive rooms; gas-phase (chemical) filtration media, modules and stand-alone units that remove corrosive gases such as sulfur dioxide and hydrogen sulfide; filter frames, housings and differential-pressure gauges that tell operators when to change filters. Filters in computer room air handler (CRAH) and computer room air conditioner (CRAC) units, fan walls, outside-air economizer intakes, make-up air units, and generator, battery and electrical rooms are all counted.
Excluded
The air handlers, fans and cooling coils themselves, chillers, cooling towers and dry coolers; water filtration and water treatment; fuel and lubricant filters on diesel generators; air filters for offices, homes, vehicles and cleanroom fabs; and corrosion-monitoring services sold without filters.
How the Segments Fit Together
Every segment table sums to the 2025 total of USD 520.20 million. The filter-type split shows what is bought, the application split shows where it sits in the building, the purchase-type split separates first fit from replacement, and the data center type split shows who pays. Regions add up to the total, and the top 12 countries sit inside their regions.
Why Do Data Center Air Filtration Market Estimates Differ?
USD 589.74 million in 2026 is the DC Market Insights figure for filters, media and housings used in data centers only; estimates that count the air handlers, or filters for all commercial buildings, are several times larger.
Broader definitions add three things. Some add the computer room air handlers, fan walls and economizer dampers that hold the filters, which moves the figure into the cooling-equipment range covered by the Data Center Precision Air Conditioning Market report. Some add cleanroom and semiconductor fab filtration, where ULPA (ultra-low particulate air) filters and molecular filters cost far more per square metre. Others add HVAC (heating, ventilation and air conditioning) filters for every commercial building, which is a general-ventilation market, not a data center market. DC Market Insights keeps those out, so its value equals what data center owners, operators and their facility contractors spend on filters and media.
| Element | In this report | Why |
|---|---|---|
| Filters, media and housings in data centers | Yes, USD 520.20 million in 2025 | Bought and replaced by data center operators |
| Gas-phase (chemical) filtration for data halls | Yes, USD 98.84 million in 2025 | Protects IT hardware from corrosive gases |
| CRAH, CRAC and fan-wall units | No | Cooling equipment; filters inside them are counted |
| Cleanroom and semiconductor fab filtration | No | Different buyer and ISO class |
| Commercial-building HVAC filters | No | General ventilation outside data centers |
| Generator fuel and oil filters | No | Engine consumables, not air filtration |
Outside the scope are commercial HVAC air filters, cleanroom air filtration, residential air purifiers and automotive cabin filters. Inside the scope sit all data center buyers, including small and medium-sized enterprises (SMEs) that run server rooms, edge sites at telecom towers and government data centers, as well as information technology (IT) and telecom operators.
Why Are Data Centers Spending More on Air Filtration?
Three forces add about USD 666 million of yearly filter spending between 2025 and 2035: free-air cooling, corrosion limits for lead-free electronics and longer wildfire smoke seasons.
ASHRAE Points Free-Air Cooling Sites to MERV 13 Intake Filters
Outside-air economizer intakes take 27.0% of 2025 value and grow 10.10% a year, faster than the market. ASHRAE’s TC 9.9 contamination guideline (2011) says recirculated room air may be filtered with MERV 8 filters, air entering a data center with MERV 11 or MERV 13, and that free-air cooling sites should use MERV 11 or, preferably, MERV 13 filters to keep the hall at ISO 14644-1 Class 8. The LBNL data center design guide for the Federal Energy Management Program (revised July 2024) adds that with MERV 13 filters “the negative effects of outside air pollutants are small”. Each economizer site therefore buys a rigid MERV 13 intake bank (a 24 x 24 x 12 inch rigid cell lists at about USD 107 per filter at an online reseller) on top of the room filters.
Lead-Free Solder and the G1 Corrosion Limit Push Gas-Phase Filtration
Gas-phase filtration grows from 19.0% of 2025 value to 24.0% in 2035, 11.16% a year. The European Union’s Restriction of Hazardous Substances (RoHS) Directive 2011/65/EU caps lead at 0.1% in electronics, and ASHRAE’s guideline lists the change from lead-containing solder to lead-free copper-tin-silver solder as a cause of more corrosion failures. ASHRAE sets the gaseous limit at severity level G1 of the International Society of Automation (ISA) standard 71.04, a copper reactivity rate below 300 Å a month and silver below 200 Å a month, and recommends gas-phase filtration where a site does not meet it. DC Market Insights estimates that about one data center in five outside North America and western Europe needs chemical media to stay inside G1.
Wildfire Smoke Seasons Raise Change-Out Frequency in North America
The United States Environmental Protection Agency (US EPA) planning framework for commercial buildings (updated September 2026) recommends MERV 13 or higher filters during smoke events, and the agency’s AirNow service reported smoke affecting air quality in several states in October 2026. A smoke week can load a pre-filter bank in days instead of months, so DC Market Insights adds 0.3 extra change-outs a year for economizer sites in the western United States and Canada. That lifts the North American replacement bill by about USD 6 million a year by 2030.
How Is Data Center Air Filtration Changing?
Filter makers are buying gas-phase specialists, adding plants near Asian data center hubs and preparing for a new ISO 16890 edition, while the market grows 8.59% a year.
Filter Makers Buy Gas-Phase and Molecular Filtration Specialists
Parker Hannifin agreed in November 2025 to buy Filtration Group, the parent of gas-phase specialist Purafil, for USD 9.25 billion in cash, and completed the deal in August 2026; Parker said Filtration Group expected calendar 2025 sales of USD 2 billion (Parker Hannifin, November 2025). Camfil bought Spain’s Bioconservación (Bion) in March 2026 to expand its molecular contamination control division. Both moves put corrosive-gas media, the fastest filter type at 11.16% a year, inside larger air filtration groups.
Japan’s Data Center Build Lifts Filter Media Demand
Freudenberg’s Annual Report 2025 says the filter business of its Japan Vilene unit grew partly on strong demand for filters for new data center construction, while Daikin Industries, owner of American Air Filter (AAF), named data centers among the high-end markets for its filter business in its Integrated Report 2025. Japan is the fifth-largest country market, at USD 21.85 million in 2025 (DC Market Insights estimate).
ISO 16890 and Filter Alarms Move Filters from Calendar to Condition
ISO 16890-1:2016 classifies general-ventilation filters by ePM1, ePM2.5 and ePM10 efficiency, and the ISO 16890-1 page says a new edition is expected within months. The European Union’s ecodesign regulation for ventilation units (EU) No 1253/2014 requires a visual signal or alarm when a filter reaches its maximum pressure drop. Housings, frames and pressure monitoring hold 17.0% of 2025 value, USD 88.43 million, because operators now change filters on measured pressure drop rather than on a fixed calendar.
What Holds Back Data Center Air Filtration Spending?
Liquid cooling and fan energy limit the market: if every 2035 MW were air-cooled, DC Market Insights estimates the 2035 market would be about USD 1.67 billion, 41% above the USD 1.19 billion base case.
Cold Plates Remove 70% to 80% of AI Rack Heat from the Air Path
Schneider Electric wrote in August 2026 that direct-to-chip systems can move 80% or more of rack heat to cold plates, leaving about 20% for air, and Vertiv describes 70% to 75% removal by liquid. NVIDIA’s GB200 NVL72 is a rack-scale liquid-cooled design with 36 Grace CPUs and 72 Blackwell GPUs (graphics processing units). DC Market Insights therefore counts each liquid-cooled MW as 0.25 MW of air-handled load in 2025 and 0.15 MW in 2035, which is why first-fit filter spending grows only 5.48% a year while new capacity more than doubles from 12.0 GW to 27 GW.
Filter Pressure Drop Eats Economizer Savings
The LBNL design guide (July 2024) warns that careful design may be needed so that cooling savings are not lost to excessive filtration requirements. A MERV 13 bank adds fan power on every hour of operation, so operators of large free-air halls weigh a higher filter class against fan energy. DC Market Insights keeps MERV 8 as the recirculation default for 75% of filter faces in its 2025 model, which holds the fleet-average bill at USD 3,600 per MW a year.
Where Are the Openings in Data Center Air Filtration?
Two openings stand out: replacement contracts worth USD 993.47 million a year by 2035 and gas-phase media worth USD 284.63 million a year by 2035, partly inside the replacement pool.
Replacement Contracts on 231 GW of Air-Handled Load by 2035
Replacement filters and media grow from USD 407.26 million to USD 993.47 million by 2035, 9.33% a year, as the air-handled base doubles from 113.1 GW to 231.0 GW and the change-out bill rises from USD 3,600 to USD 4,300 per MW a year. Multi-site supply-and-change contracts with colocation and hyperscale operators, priced per MW or per filter face, are the largest single pool of value in the market.
Gas-Phase Media for Asia Pacific and India Hubs
Gas-phase filtration reaches USD 284.63 million in 2035 (DC Market Insights estimate). India, the fastest large country at 13.30% a year, and China, the second-largest market at USD 70.23 million in 2025, both build campuses near industrial corridors where G1 corrosion limits are hard to meet. Camfil added a HEPA and ULPA line at Manesar, India, in September 2025 and broke ground on a 14,400 square metre site in Malaysia in May 2026, close to these buyers.
How Much Does Data Center Air Filtration Cost per MW?
DC Market Insights puts the 2025 filter bill at USD 3,600 per MW of air-handled IT load a year for replacements and USD 11,000 per new air-handled MW at first fit, including housings and initial filter sets.
| Price point | 2020 | 2025 | 2030 | 2035 |
|---|---|---|---|---|
| Replacement filters and media, USD per air-handled MW a year | 3,300 | 3,600 | 4,000 | 4,300 |
| First fit, USD per new air-handled MW | 10,000 | 11,000 | 11,800 | 12,500 |
| Air-handled share of a liquid-cooled MW | 30% | 25% | 18% | 15% |
Prices rise 1.8% a year for replacements because more sites move from MERV 8 to MERV 13 and add chemical media; per-MW first-fit content rises more slowly because liquid-cooled halls need smaller filter banks. Public price anchors: a 24 x 24 x 12 inch MERV 13 rigid cell filter lists at USD 107.25 at an online reseller (October 2026), and Purafil’s permanganate media bulletin gives a bulk density of 50 pounds per cubic foot, which turns quoted media prices per pound into a price per module. Gas-phase media is sold on quotation, so the model uses USD 450 per air-handled MW a year as its fleet-average chemical media bill.
Which Standards Set Data Center Air Filtration Requirements?
Six documents set the filter classes that the USD 520.20 million of 2025 spending buys.
- ASHRAE TC 9.9 Gaseous and Particulate Contamination Guidelines for Data Centers (2011): ISO 14644-1 Class 8; MERV 8 for recirculated air, MERV 11 or MERV 13 for incoming air; G1 gas limits (ASHRAE guideline).
- ISA-71.04 severity level G1: copper below 300 Å a month and silver below 200 Å a month, as modified by ASHRAE for data centers.
- ASHRAE Standard 52.2-2017: rates filters by MERV from particle-size efficiency between 0.30 and 10 micrometres.
- ISO 16890-1:2016 and ISO 29463: ePM classes for general-ventilation filters up to 99% ePM1, and HEPA and ULPA classes above that.
- EU Ecodesign Regulation (EU) No 1253/2014: ventilation units with filters must signal when filter pressure drop reaches its limit.
- EU RoHS Directive 2011/65/EU: lead limit of 0.1%, the reason lead-free solder and its corrosion risk dominate server boards.
California’s Title 24 energy code (2022 compliance manual) requires MERV 13 filters for occupied spaces, which reaches data center offices and support areas but not the data halls themselves, and the US EPA recommends MERV 13 or higher during wildfire smoke events.
Which Filter Types and Buyers Lead Data Center Air Filtration?
Fine filters lead the filter types with 38.0% of 2025 value, CRAH and fan-wall recirculation leads the applications with 46.0%, replacement leads the purchase types with 78.3%, and hyperscale and AI cloud data centers lead the buyer types with 38.0%. Searches for “data centre air filters” and “server room air filtration” fall in the same scope.
By Filter Type: Fine Filters Lead with 38.0%
Fine filters grow 8.30% a year to USD 438.80 million, while gas-phase filtration grows 11.16% a year and becomes the second-largest filter type by 2035.
| Filter Type | 2025 Value | Share 2025 | 2035 Value | CAGR 2025-2035 |
|---|---|---|---|---|
| Pre-Filters (Panel and Pleated) | USD 109.24 million | 21.0% | USD 213.46 million | 6.93% |
| Fine Filters (Bag and Rigid Box) | USD 197.68 million | 38.0% | USD 438.80 million | 8.30% |
| HEPA and EPA Filters | USD 26.01 million | 5.0% | USD 59.30 million | 8.59% |
| Gas-Phase (Chemical) Filtration | USD 98.84 million | 19.0% | USD 284.63 million | 11.16% |
| Housings Frames and Pressure Monitoring | USD 88.43 million | 17.0% | USD 189.75 million | 7.93% |
| Total | USD 520.20 million | 100.0% | USD 1,185.94 million | 8.59% |
By Application: Recirculation Filters Lead with 46.0%
Outside-air economizer intakes grow fastest, at 10.10% a year, as more new sites in cool climates use free-air cooling.
| Application | 2025 Value | Share 2025 | 2035 Value | CAGR 2025-2035 |
|---|---|---|---|---|
| CRAH CRAC and Fan-Wall Recirculation | USD 239.30 million | 46.0% | USD 474.38 million | 7.08% |
| Outside-Air Economizer Intakes | USD 140.45 million | 27.0% | USD 367.64 million | 10.10% |
| Make-Up Air and Pressurization Units | USD 88.43 million | 17.0% | USD 213.47 million | 9.21% |
| Generator Battery and Electrical Rooms | USD 52.02 million | 10.0% | USD 130.45 million | 9.63% |
| Total | USD 520.20 million | 100.0% | USD 1,185.94 million | 8.59% |
By Purchase Type: Replacement Filters and Media Take 78.3%
Replacement grows 9.33% a year and first fit 5.48% a year, so replacement reaches 83.8% of value by 2035.
| Purchase Type | 2025 Value | Share 2025 | 2035 Value | CAGR 2025-2035 |
|---|---|---|---|---|
| First-Fit with New Builds | USD 112.94 million | 21.7% | USD 192.47 million | 5.48% |
| Replacement Filters and Media | USD 407.26 million | 78.3% | USD 993.47 million | 9.33% |
| Total | USD 520.20 million | 100.0% | USD 1,185.94 million | 8.59% |
By Data Center Type: Hyperscale and AI Cloud Buyers Take 38.0%
Hyperscale and AI cloud data centers grow 10.44% a year; enterprise and edge sites grow 5.00% a year as workloads move to colocation and cloud.
| Data Center Type | 2025 Value | Share 2025 | 2035 Value | CAGR 2025-2035 |
|---|---|---|---|---|
| Hyperscale and AI Cloud Data Centers | USD 197.67 million | 38.0% | USD 533.67 million | 10.44% |
| Colocation Data Centers | USD 176.87 million | 34.0% | USD 415.08 million | 8.90% |
| Enterprise and Edge Data Centers | USD 145.66 million | 28.0% | USD 237.19 million | 5.00% |
| Total | USD 520.20 million | 100.0% | USD 1,185.94 million | 8.59% |
DC Exclusive: The 1 MW Filter Change-Out Ledger, USD 3,600 a Year
This DC Market Insights model shows what 1 MW of air-handled IT load spends on filters in a year, built from 13 inputs: airflow physics, filter-face rating, change frequency and filter prices.
Removing 1 MW of heat with a 12 kelvin air temperature rise takes about 69 cubic metres a second, or 146,400 CFM. At 2,000 CFM per 24 x 24 inch filter face, that is 73 faces in the CRAH and fan-wall units. The fleet-average ledger below combines halls with and without economizers and with and without gas-phase media, so each line is an average per MW.
| Ledger line (per MW of air-handled load, 2025) | Inputs | USD a year | Share |
|---|---|---|---|
| Recirculation pre-filters (MERV 8) | 73 faces x 1.5 changes x USD 8 | 876 | 24.3% |
| Recirculation fine filters where specified | 18 faces (25%) x 1 change x USD 45 | 810 | 22.5% |
| Economizer intake rigid MERV 13 filters | 7 faces (fleet average) x 1 change x USD 107.25 | 751 | 20.9% |
| Make-up air and pressurization filters | 4 faces x 2 changes x USD 60 | 480 | 13.3% |
| Gas-phase media change-out | Fleet average where G1 is not met | 450 | 12.5% |
| Generator, battery and electrical room filters | Room intake and exhaust sets | 233 | 6.5% |
| Total | 13 inputs | 3,600 | 100.0% |
The ledger explains the market’s shape. Recirculation filters make up nearly half of the bill because every air-handled MW needs them, whatever the climate. Economizer and gas-phase lines are smaller per MW on the fleet average but grow faster, because they are concentrated in new free-air sites and in polluted hubs. A 100 MW air-cooled campus spends about USD 360,000 a year on filters, while a 100 MW liquid-cooled AI campus at 15% air-handled load spends about USD 54,000.
Which Regions Buy the Most Data Center Air Filters?
North America leads with 39.0% of 2025 value, USD 202.87 million, and the Middle East and Africa grows fastest at 12.13% a year.
| Region | 2025 Value | Share 2025 | 2035 Value | CAGR 2025-2035 |
|---|---|---|---|---|
| North America | USD 202.87 million | 39.0% | USD 426.93 million | 7.72% |
| Asia Pacific | USD 156.06 million | 30.0% | USD 391.36 million | 9.63% |
| Europe | USD 119.65 million | 23.0% | USD 249.05 million | 7.61% |
| Middle East and Africa | USD 23.41 million | 4.5% | USD 73.53 million | 12.13% |
| Latin America | USD 18.21 million | 3.5% | USD 45.07 million | 9.49% |
| Total | USD 520.20 million | 100.0% | USD 1,185.94 million | 8.59% |
North America Buys 39.0% of Data Center Filter Value
The United States holds the largest installed base: the United States Department of Energy (DOE) reported that US data centers used 176 terawatt-hours (TWh) of electricity in 2023, 4.4% of the country’s total, and could use 325 to 580 TWh by 2028 (US Department of Energy, December 2024). Wildfire smoke in the western states and Canada adds extra change-outs, and North America grows 7.72% a year.
Asia Pacific Holds 30.0% and Leads Gas-Phase Demand
Asia Pacific grows 9.63% a year to USD 391.36 million by 2035, with China, Japan, India, Australia, Singapore and South Korea all in the top 12. DC Market Insights expects hubs near industrial and traffic emissions, such as Johor in Malaysia and Mumbai in India, to buy the most new gas-phase media in the region.
Europe Holds 23.0% Share
Europe grows 7.61% a year. Nordic and Irish sites use outside air for most of the year, and the Ecodesign filter-alarm rule pushes pressure monitoring into every ventilation unit.
Latin America Holds 3.5% Share
Latin America grows 9.49% a year to USD 45.07 million by 2035, led by Brazil and Mexico, where most new halls are air-cooled colocation sites with recirculation and make-up air filters.
Middle East and Africa Is the Fastest-Growing Region at 12.13%
Saudi Arabia and the United Arab Emirates (UAE) lead the region. Sand and dust loads on Gulf campuses shorten pre-filter life, so sites there change filters more often than the fleet average, and the region’s share rises from 4.5% to 6.2% by 2035.
Which Countries Spend the Most on Data Center Air Filtration?
The United States leads with USD 189.34 million in 2025, 36.4% of the world total, and India is the fastest-growing large country at 13.30% a year.
| Rank | Country | Region | 2025 Value | 2035 Value | CAGR 2025-2035 |
|---|---|---|---|---|---|
| 1 | United States | North America | USD 189.34 million | USD 393.72 million | 7.60% |
| 2 | China | Asia Pacific | USD 70.23 million | USD 166.03 million | 8.98% |
| 3 | Germany | Europe | USD 26.01 million | USD 54.55 million | 7.69% |
| 4 | United Kingdom | Europe | USD 22.89 million | USD 47.44 million | 7.56% |
| 5 | Japan | Asia Pacific | USD 21.85 million | USD 45.07 million | 7.51% |
| 6 | India | Asia Pacific | USD 17.69 million | USD 61.67 million | 13.30% |
| 7 | Canada | North America | USD 13.53 million | USD 33.21 million | 9.39% |
| 8 | Australia | Asia Pacific | USD 12.48 million | USD 29.65 million | 9.04% |
| 9 | France | Europe | USD 11.96 million | USD 24.90 million | 7.61% |
| 10 | Netherlands | Europe | USD 11.44 million | USD 22.53 million | 7.01% |
| 11 | Singapore | Asia Pacific | USD 9.88 million | USD 18.98 million | 6.75% |
| 12 | South Korea | Asia Pacific | USD 9.36 million | USD 22.53 million | 9.18% |
India grows from USD 17.69 million to USD 61.67 million by 2035 because its new capacity is concentrated in Mumbai, Chennai and Hyderabad, where both dust and corrosive gases require fine filters and chemical media; Singapore grows slowest, at 6.75% a year, because its installed base grows the least among the top 12 countries in the DC Market Insights capacity series.
How Could the 2035 Air Filtration Forecast Change?
The 2035 market ranges from USD 1.08 billion to USD 1.32 billion across three scenarios, depending on how much heat liquid cooling removes from the air path and how fast filter prices rise.
| Scenario | Assumption | 2035 Value | CAGR 2025-2035 |
|---|---|---|---|
| Low | Liquid-cooled MW sends only 8% of heat to air; replacement bill USD 4,000 per MW | USD 1,076.82 million | 7.55% |
| Base | 15% to air; USD 4,300 per MW | USD 1,185.94 million | 8.59% |
| High | 22% to air; USD 4,700 per MW with wider MERV 13 and gas-phase use | USD 1,322.78 million | 9.78% |
Who Are the Leading Data Center Air Filtration Companies?
The top five suppliers hold about 50% of 2025 value (DC Market Insights assessment based on product ranges, data center references and filter sales), with Camfil the largest at about 15%, followed by AAF International (Daikin Industries), Parker Hannifin (Filtration Group and Purafil), Freudenberg Filtration Technologies and MANN+HUMMEL.
- Camfil
- AAF International (Daikin Industries)
- Parker Hannifin (Filtration Group and Purafil)
- Freudenberg Filtration Technologies (Viledon)
- MANN+HUMMEL
- Donaldson Company
- Japan Vilene Company
- Ahlstrom
- Circul-Aire (Dectron)
- Koch Filter
- Nederman
- Troy Filters
- 3M
- Hollingsworth and Vose
Camfil reports turnover of 14.3 billion Swedish kronor (SEK) and runs a data center filtration product page in the United States covering particulate and gaseous threats. Freudenberg Filtration Technologies reported sales of EUR 634.6 million in 2025, down from EUR 664.4 million in 2024 mainly on currency, while industrial filtration sales rose slightly (Freudenberg Annual Report 2025). MANN+HUMMEL reported 2025 sales of about EUR 4.2 billion and names data centers among the growth applications of its Life Sciences and Environment business. Donaldson reported fiscal 2026 sales of USD 3.89 billion, with Industrial Solutions at USD 1.13 billion (Donaldson, August 2026); its fiscal 2025 annual report lists demand for cloud computing capacity among its growth drivers. Ahlstrom reported 2025 net sales of EUR 2,930 million for its filter media and specialty materials business.
Recent Developments
Six dated events from September 2025 to August 2026 show filter groups consolidating and adding gas-phase and Asian capacity.
- In September 2025, Camfil opened a HEPA and ULPA filter line at its Manesar plant in India (Source: Camfil).
- In November 2025, Parker Hannifin agreed to acquire Filtration Group, including Purafil, for USD 9.25 billion in cash (Source: Parker Hannifin).
- In November 2025, AAF International launched its AstroSorb molecular filter line in the United States (Source: AAF International).
- In March 2026, Camfil acquired Bioconservación (Bion) of Spain to expand its molecular contamination control division (Source: Camfil).
- In May 2026, Donaldson completed its acquisition of Facet Filtration, and Camfil broke ground on a 14,400 square metre expansion site in Malaysia (Source: Donaldson; Camfil).
- In August 2026, Parker completed the Filtration Group acquisition, which it expects to add about USD 1.8 billion to fiscal 2027 sales (Source: Filtration Group).
Methodology: How Is the Data Center Air Filtration Market Sized?
DC Market Insights sizes the market at USD 520.20 million in 2025 as air-handled installed load times a yearly replacement bill per MW, plus new air-handled capacity times first-fit content per MW.
New data center IT capacity follows the DC Market Insights capacity series used across its reports: 12.0 GW in 2025, 22 GW in 2030 and 27 GW in 2035, with an installed base of 116 GW in 2025 and 311 GW in 2035. AI takes 35% of new capacity in 2025, 60% in 2030 and 66% in 2035, and the liquid-cooled share of new AI capacity rises from 55% to 90% and 95%, which gives an installed liquid-cooled base of 3.83 GW in 2025 and 94.07 GW in 2035. A liquid-cooled MW counts as 0.25 MW of air-handled load in 2025 and 0.15 MW in 2035. The 2025 receipt: 113.1 GW of air-handled installed load x USD 3,600 per MW a year = USD 407.26 million; 10.27 GW of new air-handled capacity x USD 11,000 per MW = USD 112.94 million. Filter types, applications, regions, countries and buyer types are shares of the total that move linearly from 2025 to 2035; the purchase-type split follows the model lines.
The estimate passes three bound checks. First (ceiling): if all 116 GW of 2025 installed capacity were air-handled and all 12.0 GW of new capacity were fitted at the first-fit rate, filters would cost about USD 549.6 million, above the USD 520.20 million estimate. Second (ceiling): the whole market equals about 26% of the USD 2 billion of 2025 sales Filtration Group expected and about 57% of Donaldson’s USD 914.2 million of Industrial Filtration Solutions sales in fiscal 2025, a plausible size for one end market of the air filtration industry. Third (floor): one change a year of MERV 8 recirculation filters at USD 8 on 73 faces per MW of the 113.1 GW base (USD 66.0 million) plus USD 4,000 of first fit per new air-handled MW (USD 41.1 million) gives USD 107.1 million, below the estimate. Full method: DC Market Insights research methodology; filters sit inside the cooling spend of the Data Center Thermal Management Market report, next to the Data Center Water Treatment Market report on the water side.
Table of contents
- 01Introduction
- 1.1Market Definition
- 1.2Historical Period, Base Year and Forecast Period
- 1.3Report Attributes
- 02Research Methodology
- 2.1The Installed-Load-Times-Filter-Bill Model in Numbers
- 2.2Bound Checks: All-Air Ceiling, Supplier Sales Ceiling and MERV 8 Floor
- 03Executive Summary
- 3.1Market Snapshot, 2025, 2026 and 2035
- 3.2Key Market Statistics
- 3.3Key Takeaways
- 04What Does Data Center Air Filtration Cover?
- 4.1Included: Filters, Gas-Phase Media and Housings
- 4.2Excluded: Air Handlers, Water Treatment, Fuel Filters and Cleanroom Fabs
- 4.3How the Segments Fit Together
- 05Why Do Data Center Air Filtration Market Estimates Differ?
- 5.1Air Handlers, Cleanrooms and Commercial HVAC in Broader Definitions
- 5.2Scope Comparison: What Is In and Out
- 5.3Buyers Inside the Scope
- 06Market Drivers
- 6.1ASHRAE Points Free-Air Cooling Sites to MERV 13 Intake Filters
- 6.2Lead-Free Solder and the G1 Corrosion Limit Push Gas-Phase Filtration
- 6.3Wildfire Smoke Seasons Raise Change-Out Frequency in North America
- 07Market Trends
- 7.1Filter Makers Buy Gas-Phase and Molecular Filtration Specialists
- 7.2Japan's Data Center Build Lifts Filter Media Demand
- 7.3ISO 16890 and Filter Alarms Move Filters from Calendar to Condition
- 08Market Challenges
- 8.1Cold Plates Remove 70% to 80% of AI Rack Heat from the Air Path
- 8.2Filter Pressure Drop Eats Economizer Savings
- 09Market Opportunities
- 9.1Replacement Contracts on 231 GW of Air-Handled Load by 2035
- 9.2Gas-Phase Media for Asia Pacific and India Hubs
- 10Pricing
- 10.1Price per MW: Replacement and First Fit, 2020-2035
- 10.2Public Price Anchors: MERV 13 Rigid Cell Filter and Permanganate Media
- 11Standards and Regulation
- 11.1ASHRAE TC 9.9 Contamination Guidelines
- 11.2ISA-71.04 Severity Level G1
- 11.3ASHRAE Standard 52.2-2017
- 11.4ISO 16890-1 and ISO 29463
- 11.5EU Ecodesign Regulation 1253/2014
- 11.6EU RoHS Directive 2011/65/EU
- 11.7California Title 24 and US EPA Wildfire Guidance
- 12Market Segmentation
- 12.1By Filter Type
- 12.1.1Pre-Filters (Panel and Pleated)
- 12.1.2Fine Filters (Bag and Rigid Box)
- 12.1.3HEPA and EPA Filters
- 12.1.4Gas-Phase (Chemical) Filtration
- 12.1.5Housings Frames and Pressure Monitoring
- 12.2By Application
- 12.2.1CRAH CRAC and Fan-Wall Recirculation
- 12.2.2Outside-Air Economizer Intakes
- 12.2.3Make-Up Air and Pressurization Units
- 12.2.4Generator Battery and Electrical Rooms
- 12.3By Purchase Type
- 12.3.1First-Fit with New Builds
- 12.3.2Replacement Filters and Media
- 12.4By Data Center Type
- 12.4.1Hyperscale and AI Cloud Data Centers
- 12.4.2Colocation Data Centers
- 12.4.3Enterprise and Edge Data Centers
- 13DC Exclusive: The 1 MW Filter Change-Out Ledger
- 13.1Airflow and Filter Faces per MW
- 13.2Ledger Lines: Recirculation, Intake, Make-Up Air, Gas-Phase and Rooms
- 13.3Air-Cooled vs Liquid-Cooled Campus Filter Bill
- 14Regional Insights
- 14.1North America
- 14.2Asia Pacific
- 14.3Europe
- 14.4Latin America
- 14.5Middle East and Africa
- 15Country Analysis
- 15.1United States
- 15.2China
- 15.3Germany
- 15.4United Kingdom
- 15.5Japan
- 15.6India
- 15.7Canada
- 15.8Australia
- 15.9France
- 15.10Netherlands
- 15.11Singapore
- 15.12South Korea
- 16Forecast Scenarios
- 16.1Low Scenario
- 16.2Base Scenario
- 16.3High Scenario
- 17Competitive Insights
- 17.1Market Concentration
- 17.2Camfil
- 17.3AAF International (Daikin Industries)
- 17.4Parker Hannifin (Filtration Group and Purafil)
- 17.5Freudenberg Filtration Technologies
- 17.6MANN+HUMMEL
- 17.7Donaldson Company
- 17.8Ahlstrom
- 18Recent Developments
- 18.1Acquisitions: Filtration Group, Bion and Facet Filtration
- 18.2Capacity: Manesar and Malaysia
- 18.3Products: AstroSorb Molecular Filters
- Fig. 1Data Center Air Filtration Market Size, 2020-2035 (USD million)
- Table 1Report Attributes
- Table 2Scope Comparison
- Table 3Price per MW, 2020-2035
- Table 4Market by Filter Type, 2025 and 2035
- Table 5Market by Application, 2025 and 2035
- Table 6Market by Purchase Type, 2025 and 2035
- Table 7Market by Data Center Type, 2025 and 2035
- Table 8The 1 MW Filter Change-Out Ledger
- Table 9Market by Region, 2025 and 2035
- Table 10Top 12 Countries, 2025 and 2035
- Table 11Forecast Scenarios, 2035
About this report
Written by Amit Jain and reviewed by Deepti Agrawal, Senior Editor, Research. Figures are built top-down and bottom-up and reconciled before publication, with 2025 as the base year.
Read our methodologyHow we built this
- Historical period2020-2024
- Base year2025
- Forecast period2026-2035
- Sizing approachTop-down + bottom-up
Need more than the report?
Advisory on this market
Due diligence, site selection and market entry work, by the analysts who wrote this report.
See consulting servicesFrequently asked questions
USD 589.74 million in 2026, up 13.4% from USD 520.20 million in 2025, according to DC Market Insights estimates. The market is projected to reach USD 1.19 billion by 2035, a CAGR of 8.59% from 2025.
8.59% a year from 2025 to 2035, after 10.56% a year from 2020 to 2025, because liquid cooling moves 75% to 85% of AI rack heat off the air path while the air-handled base still doubles to 231.0 GW.
USD 520.20 million of 2025 spending on pre-filters, fine filters, HEPA and EPA filters, gas-phase (chemical) media and housings bought for data centers. Air handlers, water treatment, generator fuel filters and cleanroom fab filtration are excluded.
USD 3,600 per MW of air-handled IT load a year for replacement filters and media in 2025, and USD 11,000 per new air-handled MW at first fit (DC Market Insights estimates).
MERV 8 for recirculated room air and MERV 11 or, preferably, MERV 13 for outside air, according to ASHRAE TC 9.9 guidance, which keeps data halls at ISO 14644-1 Class 8 cleanliness.
300 angstroms a month of copper corrosion is the ASHRAE G1 limit (silver 200). Sites above it need chemical media because lead-free solder corrodes faster; gas-phase filtration grows 11.16% a year to USD 284.63 million by 2035.
Fine filters (bag and rigid box), with 38.0% of 2025 value or USD 197.68 million. Gas-phase (chemical) filtration grows fastest, at 11.16% a year.
North America, with 39.0% of 2025 value or USD 202.87 million. The Middle East and Africa grows fastest, at 12.13% a year, as dust loads on Gulf campuses shorten filter life.
About 50% of 2025 value sits with the top five: Camfil, AAF International (Daikin Industries), Parker Hannifin (Filtration Group and Purafil), Freudenberg Filtration Technologies and MANN+HUMMEL (DC Market Insights assessment).
USD 589.74 million in 2026 is the DC Market Insights figure for filters, media and housings in data centers only. Estimates that add air handlers, cleanroom filtration or commercial HVAC filters are several times larger.
Licences, delivery and payment
Which licence should I choose?
Single User is a view-only PDF for one person. Multi User adds a printable PDF and the Excel data for unlimited users at one location. Enterprise covers your whole company and includes 100 free analyst hours.
How and when will I receive the report?
By email, within 24–48 business hours of payment, in the formats of your licence.
How can I pay?
Securely through PayPal: with a PayPal account, a debit or credit card, or PayPal Pay Later where available. Prices are in US dollars.
Can I see a sample first?
Yes. Request a free sample and we will email it to you.
Can the report be tailored to my needs?
Yes. We can add countries, segments or data cuts. Talk to an analyst about the scope you need.
Can I get an invoice or pay against a purchase order?
Write to sales@dcmarketinsights.com and our team will help.