
Data Center Disaster Resilience and Business Continuity Market Size, Share & Forecast to 2035
Market at a glance
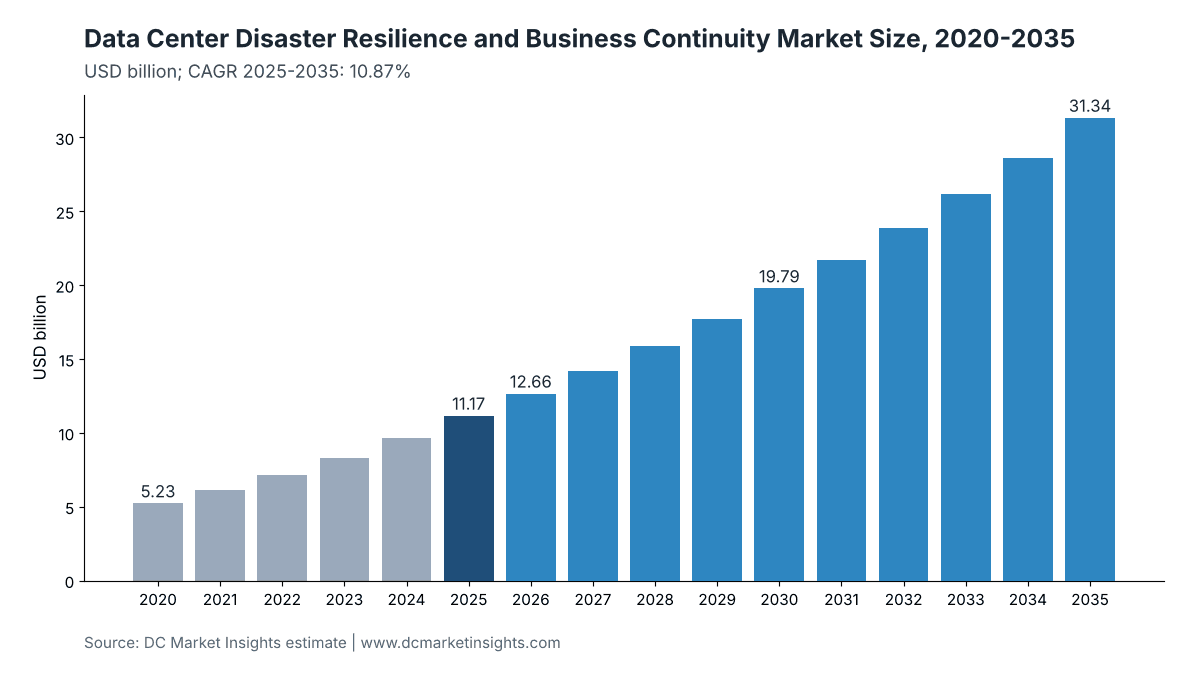
The Data Center Disaster Resilience and Business Continuity market was worth USD 11.17 billion in 2025 and is forecast to reach USD 31.34 billion by 2035, growing at a 10.87% CAGR.
 By Amit Jain, Senior Consultant, ICT & Emerging Technologies
 Reviewed by Deepti Agrawal
Last updated 4 Nov 2026
Base year 2025 PDF + Excel
Key findings
DORA Requires Yearly Tests of ICT Continuity and Recovery Plans From 17 January 2025
Pay-per-Server Recovery Replaces Standby Halls
Paying for 2,784 MW of Recovery Capacity That Waits for a Disaster
Government and Public Sector Recovery Reaches USD 5.64 billion by 2035
What is inside the report
- 01Introduction
- 02Executive Summary
- 03Market Scope
- 04Market Dynamics
- 05Pricing Analysis
- 06Standards and Regulation
- 07Market Segmentation by Component
- 08Market Segmentation by Deployment Model
- 09Market Segmentation by End User
- 10Market Segmentation by Data Center Type
- 17chapters
- 2020-2024Historical period
- 2026-2035Forecast period
- 17Companies profiled
Segmentation
Companies profiled
- Veeam
- Rubrik
- Commvault
- Cohesity (with Veritas)
- Microsoft (Azure Site Recovery)
- Amazon Web Services (Elastic Disaster Recovery)
- Google Cloud
- HPE (Zerto)
- Dell Technologies
- IBM
- Kyndryl
- Druva
- 11:11 Systems
- Iron Mountain
- Equinix
- Digital Realty
- NTT DATA
Recent developments
a faulty CrowdStrike update affected 8.5 million Windows devices (Source: Microsoft).
the EU Digital Operational Resilience Act began to apply, with yearly recovery plan tests (Source: EUR-Lex).
the UK deadline for firms to remain within impact tolerances passed (Source: Bank of England).
APRA Prudential Standard CPS 230 came into force in Australia (Source: APRA).
a fire at Korea's NIRS Daejeon centre caused failures in 647 government systems; all 709 affected systems were restored by 30 December 2025 (Source: Ministry of the Interior and Safety).
an outage in the AWS US-EAST-1 region lasted from 11:48 PM PDT on 19 October to 2:20 PM PDT on 20 October (Source: Amazon Web Services).
Veeam completed its USD 1.725 billion acquisition of Securiti AI (Source: Veeam).
Commvault reported fiscal 2026 revenue of USD 1,184 million, up 19% (Source: Commvault).
Full analysis
The Data Center Disaster Resilience and Business Continuity Market is valued at USD 12.66 billion in 2026 and is projected to reach USD 31.34 billion by 2035, up from USD 11.17 billion in 2025, a CAGR of 10.87% from 2025 to 2035 (DC Market Insights estimate). Spending here is set less by new capacity than by regulators and outages: the EU Digital Operational Resilience Act (DORA) has required financial firms to test their ICT business continuity and recovery plans at least yearly since 17 January 2025, and the fire at Korea’s National Information Resources Service (NIRS) in Daejeon on 26 September 2025 knocked out 647 government systems, with the last of 709 affected systems restored only on 30 December 2025, according to the Ministry of the Interior and Safety. The 2025 receipt is 2,784 MW of dedicated recovery capacity × USD 1.30 million per MW-year = USD 3.62 billion, plus 8,120 MW of workloads under disaster recovery as a service (DRaaS) × USD 0.36 million = USD 2.92 billion, plus 116 GW of installed IT × USD 22,000 of replication and orchestration software = USD 2.55 billion, plus 12,000 MW of new builds × USD 0.11 million of hazard engineering = USD 1.32 billion, plus 116 GW × USD 6,500 of continuity testing and recovery services = USD 754.00 million. Cloud-Based Recovery grows fastest at 15.67% a year as recovery moves from owned second sites into cloud regions, and Asia Pacific is the fastest region at 12.99%, led by India at 17.25% after the Reserve Bank of India made half-yearly recovery drills mandatory for banks.
Key Market Statistics: How Big Is the Data Center Disaster Resilience and Business Continuity Market in 2026?
The Data Center Disaster Resilience and Business Continuity Market reaches USD 12.66 billion in 2026, 13.39% above the USD 11.17 billion of 2025, according to DC Market Insights estimates, as regulated sectors fund yearly recovery tests and move recovery into the cloud.
- Market size 2025: USD 11.17 billion
- Market size 2026: USD 12.66 billion
- Market size 2030: USD 19.79 billion
- Market size 2035: USD 31.34 billion
- CAGR 2025-2035: 10.87% (low case 8.42%, high case 13.00%)
- Largest component: Recovery Site Capacity, USD 3.62 billion or 32.4% of 2025 value
- Fastest component: Disaster Recovery as a Service, 13.59% a year
- Leading region: North America, 41.0% of 2025 value; fastest region Asia Pacific at 12.99%
- Largest country: United States, USD 4.19 billion in 2025
- Leading suppliers: Veeam, Rubrik, Commvault, Cohesity and Microsoft together hold about 22% of 2025 value (DC Market Insights estimate)
Key Takeaways: What Drives Disaster Recovery Spending for Data Centers?
- Rules set the floor, because DORA, the UK operational resilience regime and India’s IT Master Direction all require recovery to be tested on a fixed clock: BFSI buyers spend USD 3.46 billion, or 31.0% of the Data Center Disaster Resilience and Business Continuity Market in 2025.
- Idle capacity is the biggest cost, because 2,784 MW of recovery space sits mostly unused until a disaster: Recovery Site Capacity is 32.4% of 2025 value.
- Cloud takes the second site, because pay-per-server recovery replaces standby halls: Cloud-Based Recovery rises from 36.0% to 55.0% of value by 2035.
- Hazards reach new campuses, because the United States recorded 27 billion-dollar weather disasters in 2024: Site Resilience Engineering grows to USD 3.51 billion by 2035.
Executive Summary: What Is the Data Center Disaster Resilience and Business Continuity Market Worth?
The Global Data Center Disaster Resilience and Business Continuity Market size was valued at USD 5.23 billion in 2020, reached USD 11.17 billion in 2025, and is anticipated to reach USD 31.34 billion by 2035, at a CAGR of 10.87% during the forecast period.
| Attribute | Value |
|---|---|
| Historical period | 2020-2024 |
| Base year | 2025 |
| Forecast period | 2026-2035 |
| Market size 2025 | USD 11.17 billion |
| Market size 2026 | USD 12.66 billion |
| CAGR 2025-2035 | 10.87% |
| Market size 2035 | USD 31.34 billion |
| Recovery capacity 2025 | 2,784 MW |
| Unit | USD million, current prices |
Growth in the Data Center Disaster Resilience and Business Continuity Market averaged 16.37% a year from 2020 to 2025, as the installed IT base rose from 70 GW to 116 GW and the share of workloads protected by DRaaS rose from 3.0% to 7.0% (DC Market Insights estimate). From 2026 the pace settles at 10.87% a year: dedicated recovery capacity falls from 2.4% to 1.8% of the installed base by 2035 as recovery shifts into cloud regions, while DRaaS cover rises to 12.0% of installed IT and resilience engineering follows completions toward 27 GW a year.
What Does the Data Center Disaster Resilience and Business Continuity Market Include?
The Data Center Disaster Resilience and Business Continuity Market covers USD 11.17 billion of 2025 spending that keeps data center services running through, or brings them back after, a fire, flood, earthquake, power loss, cyberattack or provider outage.
Included
- Dedicated recovery capacity: standby halls, colocation recovery suites and work-area recovery space held for failover
- Disaster Recovery as a Service (DRaaS) subscriptions from cloud and managed providers
- Replication, backup-for-recovery and recovery orchestration software protecting data center workloads
- Site resilience engineering: hazard studies, flood defences, seismic isolation and hardened envelopes in new builds
- Continuity planning, recovery testing and drills, audits against ISO 22301, and post-incident recovery services
Excluded
- Primary power backup such as uninterruptible power supplies and generators, and fire suppression, covered in the Data Center Fire Detection and Suppression Market
- Insurance premiums for data center property and business interruption, covered in the Data Center Insurance Market
- Backup of endpoints and software-as-a-service applications, cybersecurity software and the primary production capacity itself
How the segments fit together
Each segment dimension of the Data Center Disaster Resilience and Business Continuity Market sums to the same USD 11.17 billion in 2025: the component view splits it by what is bought, the deployment view by where recovery runs, the end-user view by buyer industry and the data-center-type view by whose facility is protected.
Why Do Data Center Disaster Resilience and Business Continuity Market Estimates Differ?
Estimates differ because some count all backup software and all business continuity consulting, while the DC Market Insights figure of USD 12.66 billion for 2026 counts only spending tied to data center recovery and site resilience.
Broader definitions add backup for laptops and software-as-a-service suites, cyber recovery and incident response retainers, crisis communication tools and enterprise-wide continuity consulting that never touches a data center. Some also count the whole cost of active-active hyperscale regions, which this edition treats as production capacity. Smaller buyers sit inside the scope: mid-sized banks, hospitals, local governments and regional colocation tenants that buy recovery suites or DRaaS.
| Element | Counted here | Why |
|---|---|---|
| Recovery site capacity | Yes, USD 3.62 billion | Capacity held for failover |
| DRaaS subscriptions | Yes, USD 2.92 billion | Recovery of data center workloads |
| Replication and orchestration software | Yes, USD 2.55 billion | Data center workloads only |
| Endpoint and SaaS backup | No | Not data center recovery |
| Cyber incident response retainers | No | Security services |
| Active-active hyperscale regions | No | Production capacity |
Market Drivers: Why Are Data Center Operators Spending More on Disaster Recovery?
Three forces add USD 8.62 billion to the Data Center Disaster Resilience and Business Continuity Market between 2025 and 2030: recovery-testing rules for financial firms, a government data center fire that exposed single-site risk, and cloud region outages that hit thousands of tenants at once.
DORA Requires Yearly Tests of ICT Continuity and Recovery Plans From 17 January 2025
Regulation (EU) 2022/2554, the Digital Operational Resilience Act, applies from 17 January 2025; Article 11 requires financial entities to test their ICT business continuity plans and ICT response and recovery plans at least yearly, Article 12 requires restoration with minimum downtime, and Article 26 adds threat-led penetration testing at least every 3 years. The UK Prudential Regulation Authority set 31 March 2025 as the date by which firms had to stay within impact tolerances. DC Market Insights puts European BFSI recovery spending at about USD 900 million in 2025, part of the USD 3.46 billion global BFSI segment.
Korea’s NIRS Daejeon Fire Took 647 Government Systems Offline in September 2025
The fire at the National Information Resources Service centre in Daejeon on 26 September 2025 caused failures in 647 systems, 96 of them directly damaged in server room 7-1, according to the Ministry of the Interior and Safety. The ministry reported 696 of 709 systems restored by 18 November and all 709 restored at 09:30 on 30 December 2025, with damaged systems moved to a public-private cloud at the Daegu centre. South Korea’s share of the Data Center Disaster Resilience and Business Continuity Market grows from USD 245.70 million in 2025 at 12.30% a year, as public bodies fund second sites.
The AWS US-EAST-1 Outage Ran About 14.5 Hours in October 2025
Amazon Web Services’ post-event summary says the disruption in its Northern Virginia region started at 11:48 PM PDT on 19 October and ended at 2:20 PM PDT on 20 October 2025, caused by a latent race condition in the DynamoDB DNS management system. In July 2024 a faulty CrowdStrike update affected 8.5 million Windows devices, according to Microsoft. Such shared-provider events push tenants to recover into a second region or provider, and Hyperscale and Cloud recovery grows at 15.32% a year in the Data Center Disaster Resilience and Business Continuity Market.
Market Trends: How Is Data Center Disaster Recovery Changing?
Recovery in the Data Center Disaster Resilience and Business Continuity Market is moving from owned second sites to pay-per-use cloud recovery, with Cloud-Based Recovery rising from USD 4.02 billion in 2025 to USD 17.24 billion by 2035.
Pay-per-Server Recovery Replaces Standby Halls
AWS Elastic Disaster Recovery is priced at USD 0.028 per source server per hour, about USD 20 a month, with no upfront cost or minimum fee, according to its pricing page; Google Cloud Backup and DR charges a management fee per GiB of protected capacity. Against a standby hall at USD 1.30 million per MW-year (DC Market Insights estimate), that pricing moves recovery for smaller estates into the cloud, so On-Premises and Owned Recovery Sites grow only 4.75% a year to 2035.
Backup Vendors Become Recovery Platforms: Veeam Pays USD 1.725 Billion for Securiti AI
Veeam reported USD 1.7 billion of annualised recurring revenue in December 2024 and completed its USD 1.725 billion acquisition of Securiti AI in December 2025, according to company releases. Rubrik’s fiscal 2026 revenue rose 48% to USD 1.32 billion, and HPE bought the replication specialist Zerto for USD 374 million in 2021. Replication and Recovery Orchestration Software in the Data Center Disaster Resilience and Business Continuity Market grows from USD 2.55 billion to USD 6.22 billion by 2035 as these platforms bundle recovery testing and orchestration.
Market Challenges: What Holds Back Data Center Disaster Recovery Budgets?
Idle capacity and concentration risk are the two main brakes on the Data Center Disaster Resilience and Business Continuity Market: recovery space costs USD 3.62 billion a year in 2025 while it waits for a disaster.
Paying for 2,784 MW of Recovery Capacity That Waits for a Disaster
DC Market Insights estimates that 2,784 MW, or 2.4% of the 116 GW installed base, was held as dedicated recovery capacity in 2025 at about USD 108 per kW-month. Finance teams cut that line first in a downturn, which is why the share falls to 1.8% by 2035 and Recovery Site Capacity grows only 9.14% a year, the slowest component.
One Faulty Update Can Hit Both the Primary and the Recovery Site
The CrowdStrike update of July 2024 affected 8.5 million Windows devices, less than 1% of all Windows machines, according to Microsoft, and recovery sites running the same software image failed with the primary. Buyers therefore pay for isolated, immutable recovery copies and separate control planes, adding cost per protected MW: DRaaS prices fall only from USD 0.36 million to USD 0.28 million per protected MW-year by 2035 (DC Market Insights estimate).
Market Opportunities: Where Will Data Center Recovery Spending Grow Most?
Two opportunities stand out in the Data Center Disaster Resilience and Business Continuity Market: government recovery programmes worth USD 5.64 billion by 2035 and hazard engineering for new campuses worth USD 3.51 billion.
Government and Public Sector Recovery Reaches USD 5.64 billion by 2035
Government and Public Sector grows from USD 1.79 billion in 2025 at 12.18% a year, the fastest buyer group, after the NIRS fire showed what a single-site failure costs a state. Korea moved damaged systems to a public-private cloud at Daegu; DC Market Insights expects other governments running consolidated centres, covered in the Government Data Center Market, to fund second sites and cloud recovery the same way.
Seismic and Flood Hardening for New Campuses, USD 3.51 billion by 2035
The United States recorded 27 weather and climate disasters with losses above USD 1 billion each in 2024, totalling USD 182.7 billion, according to the National Oceanic and Atmospheric Administration (NOAA). NTT’s Kansai data center in Japan, 30 MW of IT load, sits on a seismic-isolated structure about 94 metres above sea level. At USD 0.11 million per new MW in 2025, rising to USD 0.13 million by 2035, Site Resilience Engineering grows at 10.27% a year (DC Market Insights estimate).
Pricing: What Does Data Center Disaster Recovery Cost per MW?
Dedicated recovery capacity costs USD 1.32 million per MW-year in 2026, about USD 110 per kW-month, while DRaaS costs USD 0.35 million per protected MW-year (DC Market Insights estimates).
| Year | Recovery capacity (USD million per MW-year) | DRaaS (USD million per protected MW-year) | Software (USD thousand per installed MW-year) | Resilience engineering (USD thousand per new MW) | Testing and services (USD thousand per MW-year) |
|---|---|---|---|---|---|
| 2020 | 1.20 | 0.40 | 20.00 | 100.00 | 5.00 |
| 2025 | 1.30 | 0.36 | 22.00 | 110.00 | 6.50 |
| 2026 | 1.32 | 0.35 | 21.80 | 112.00 | 6.70 |
| 2030 | 1.42 | 0.32 | 21.00 | 120.00 | 7.50 |
| 2035 | 1.55 | 0.28 | 20.00 | 130.00 | 8.00 |
Public anchors: AWS Elastic Disaster Recovery at USD 0.028 per source server per hour with no minimum fee, Azure Site Recovery with a 31-day free period per protected instance, and Google Cloud Backup and DR charged per GiB of protected capacity. Unit costs per MW are DC Market Insights estimates; 2026-2035 values are DC Market Insights assumptions.
Standards and Regulation: Which Rules Require Data Center Disaster Recovery?
Six financial and cyber rules in force between June 2023 and July 2025 set how often recovery must be proven in the Data Center Disaster Resilience and Business Continuity Market, and two standards set how sites are designed and audited.
- DORA, Regulation (EU) 2022/2554: applies from 17 January 2025; ICT continuity and recovery plans tested at least yearly, threat-led penetration testing at least every 3 years (Source: EUR-Lex).
- NIS2, Directive (EU) 2022/2555: Article 21 lists business continuity, backup management and disaster recovery as required measures; national rules from 18 October 2024 (Source: EUR-Lex).
- UK operational resilience: firms had to remain within impact tolerances by 31 March 2025 (Source: Bank of England Prudential Regulation Authority and Financial Conduct Authority).
- APRA Prudential Standard CPS 230 Operational Risk Management: in force from 1 July 2025 (Source: Australian Prudential Regulation Authority).
- MAS Guidelines on Business Continuity Management: issued 6 June 2022, with 12 months to comply (Source: Monetary Authority of Singapore).
- Reserve Bank of India Master Direction on IT Governance: in effect from 1 April 2024; disaster recovery drills for critical systems at least half-yearly, with geographically separate primary and recovery sites (Source: Reserve Bank of India).
- ANSI/TIA-942-C, released 9 May 2024, and the EN 50600 series set data center availability classes; ISO 22301 sets the business continuity management system that recovery tests are audited against (Source: Telecommunications Industry Association, CEN-CENELEC, ISO).
Market Segmentation: Which Segments Lead the Data Center Disaster Resilience and Business Continuity Market?
Recovery Site Capacity leads the Data Center Disaster Resilience and Business Continuity Market with 32.4% of 2025 value, Cloud-Based Recovery is the largest deployment model at 36.0%, and Cloud-Based Recovery also grows fastest at 15.67% a year.
Data Center Disaster Resilience and Business Continuity Market by Component
Recovery Site Capacity is the largest component segment at USD 3.62 billion in 2025; Disaster Recovery as a Service grows fastest at 13.59% a year to USD 10.45 billion by 2035.
| Component | 2025 (USD million) | Share 2025 | 2035 (USD million) | CAGR 2025-2035 |
|---|---|---|---|---|
| Recovery Site Capacity | 3,619.20 | 32.4% | 8,676.90 | 9.14% |
| Disaster Recovery as a Service | 2,923.20 | 26.2% | 10,449.60 | 13.59% |
| Replication and Recovery Orchestration Software | 2,552.00 | 22.9% | 6,220.00 | 9.32% |
| Site Resilience Engineering | 1,320.00 | 11.8% | 3,510.00 | 10.27% |
| Continuity Planning Testing and Recovery Services | 754.00 | 6.8% | 2,488.00 | 12.68% |
Data Center Disaster Resilience and Business Continuity Market by Deployment Model
Cloud-Based Recovery is the largest deployment model segment at USD 4.02 billion in 2025 and also grows fastest at 15.67% a year to USD 17.24 billion by 2035.
| Deployment Model | 2025 (USD million) | Share 2025 | 2035 (USD million) | CAGR 2025-2035 |
|---|---|---|---|---|
| Cloud-Based Recovery | 4,020.62 | 36.0% | 17,239.48 | 15.67% |
| Colocation Recovery Sites | 3,797.26 | 34.0% | 8,776.46 | 8.74% |
| On-Premises and Owned Recovery Sites | 3,350.52 | 30.0% | 5,328.57 | 4.75% |
Data Center Disaster Resilience and Business Continuity Market by End User
BFSI is the largest end user segment at USD 3.46 billion in 2025; Government and Public Sector grows fastest at 12.18% a year to USD 5.64 billion by 2035.
| End User | 2025 (USD million) | Share 2025 | 2035 (USD million) | CAGR 2025-2035 |
|---|---|---|---|---|
| BFSI | 3,462.20 | 31.0% | 9,089.90 | 10.13% |
| IT and Telecom | 2,122.00 | 19.0% | 6,268.90 | 11.44% |
| Government and Public Sector | 1,786.94 | 16.0% | 5,642.01 | 12.18% |
| Retail and Manufacturing | 1,563.58 | 14.0% | 4,074.79 | 10.05% |
| Healthcare | 1,116.84 | 10.0% | 3,447.89 | 11.93% |
| Other | 1,116.84 | 10.0% | 2,821.01 | 9.71% |
Data Center Disaster Resilience and Business Continuity Market by Data Center Type
Enterprise-Owned is the largest data center type segment at USD 4.47 billion in 2025; Hyperscale and Cloud grows fastest at 15.32% a year to USD 12.54 billion by 2035.
| Data Center Type | 2025 (USD million) | Share 2025 | 2035 (USD million) | CAGR 2025-2035 |
|---|---|---|---|---|
| Enterprise-Owned | 4,467.36 | 40.0% | 8,463.02 | 6.60% |
| Colocation | 3,685.57 | 33.0% | 10,343.69 | 10.87% |
| Hyperscale and Cloud | 3,015.47 | 27.0% | 12,537.80 | 15.32% |
DC Exclusive: The Recovery Test Clock, 7 Rules That Decide How Often Data Center Recovery Is Proven
This tracker is a DC Market Insights model built on 7 inputs: seven rules and programmes in six jurisdictions now fix a date and a test frequency for recovery, and together they cover the BFSI and government buyers that make up 47.0% of the Data Center Disaster Resilience and Business Continuity Market in 2025, or USD 5.25 billion.
| Rule | Jurisdiction | Applies from | What must be proven | Who is covered |
|---|---|---|---|---|
| DORA (EU) 2022/2554 | European Union | 17 Jan 2025 | Yearly continuity and recovery plan test; TLPT every 3 years | Financial entities and their ICT providers |
| NIS2 (EU) 2022/2555 | European Union | 18 Oct 2024 | Business continuity, backup and disaster recovery measures | Essential and important entities incl. data centers |
| PRA and FCA operational resilience | United Kingdom | 31 Mar 2025 | Stay within impact tolerances; scenario tests | Banks, insurers, investment firms |
| APRA CPS 230 | Australia | 1 Jul 2025 | Business continuity plan tested; tolerance levels | Banks, insurers, superannuation |
| MAS BCM Guidelines | Singapore | Jun 2023 | BCM audit plan; recovery time objectives | Financial institutions |
| RBI IT Master Direction | India | 1 Apr 2024 | Recovery drills at least half-yearly; separate sites | Banks and regulated entities |
| NIRS recovery programme | South Korea | Sep-Dec 2025 | 709 systems restored; damaged systems moved to Daegu cloud | Central government |
The tracker shows a clear clock: India asks for two recovery drills a year, the EU for one, and the EU adds threat-led testing every three years. Each drill means a full failover to recovery capacity or a cloud region, which is why Continuity Planning Testing and Recovery Services grow at 12.68% a year, faster than the market, and why a buyer under two regimes, such as a bank in India and the EU, budgets for three tests a year (DC Market Insights estimate).
Regional Insights: Which Region Spends the Most on Data Center Disaster Recovery?
North America leads the Data Center Disaster Resilience and Business Continuity Market with USD 4.58 billion or 41.0% of 2025 value, and Asia Pacific grows fastest at 12.99% a year.
| Region | 2025 (USD million) | Share 2025 | 2035 (USD million) | CAGR 2025-2035 |
|---|---|---|---|---|
| North America | 4,579.04 | 41.0% | 11,597.47 | 9.74% |
| Europe | 2,903.78 | 26.0% | 7,522.68 | 9.99% |
| Asia Pacific | 2,680.42 | 24.0% | 9,089.90 | 12.99% |
| Latin America | 446.74 | 4.0% | 1,410.50 | 12.18% |
| Middle East and Africa | 558.42 | 5.0% | 1,723.95 | 11.93% |
North America Data Center Disaster Resilience and Business Continuity Market
The North America Data Center Disaster Resilience and Business Continuity Market grows from USD 4.58 billion in 2025 to USD 11.60 billion by 2035 at 9.74% a year. The United States takes USD 4.19 billion of the region; the 14.5-hour AWS outage in Northern Virginia in October 2025 and 27 billion-dollar weather disasters in 2024 keep second-region recovery on bank and hospital budgets.
Europe Data Center Disaster Resilience and Business Continuity Market
The Europe Data Center Disaster Resilience and Business Continuity Market grows from USD 2.90 billion in 2025 to USD 7.52 billion by 2035 at 9.99% a year. DORA’s yearly tests from January 2025 and NIS2’s disaster recovery measures from October 2024 drive the region; the OVHcloud fire in Strasbourg on 10 March 2021 destroyed 14,046 servers in one building, according to OVHcloud.
Asia Pacific Data Center Disaster Resilience and Business Continuity Market
The Asia Pacific Data Center Disaster Resilience and Business Continuity Market grows from USD 2.68 billion in 2025 to USD 9.09 billion by 2035 at 12.99% a year. India grows 17.25% a year under the Reserve Bank of India’s half-yearly drills, and Korea rebuilt government recovery after the NIRS fire; Japan’s seismic-isolated sites such as NTT’s 30 MW Kansai centre set the engineering bar.
Latin America Data Center Disaster Resilience and Business Continuity Market
The Latin America Data Center Disaster Resilience and Business Continuity Market grows from USD 446.74 million in 2025 to USD 1.41 billion by 2035 at 12.18% a year. Brazil holds USD 201.03 million of 2025 value; banks and payment firms buy colocation recovery suites in São Paulo rather than build second sites (DC Market Insights estimate).
Middle East and Africa Data Center Disaster Resilience and Business Continuity Market
The Middle East and Africa Data Center Disaster Resilience and Business Continuity Market grows from USD 558.42 million in 2025 to USD 1.72 billion by 2035 at 11.93% a year. New campuses in the Gulf are built with recovery zones from day one, so a high share of spending is cloud recovery and engineering rather than standby halls (DC Market Insights estimate).
Country Analysis: Which Countries Spend the Most on Data Center Recovery?
The United States is the largest country in the Data Center Disaster Resilience and Business Continuity Market with USD 4.19 billion in 2025, and India is the fastest large country at 17.25% a year.
| Rank | Country | Region | 2025 (USD million) | 2035 (USD million) | CAGR 2025-2035 |
|---|---|---|---|---|---|
| 1 | United States | North America | 4,188.15 | 10,594.44 | 9.72% |
| 2 | China | Asia Pacific | 781.79 | 2,758.32 | 13.44% |
| 3 | Japan | Asia Pacific | 670.10 | 1,817.98 | 10.50% |
| 4 | Germany | Europe | 580.76 | 1,504.54 | 9.99% |
| 5 | United Kingdom | Europe | 558.42 | 1,441.85 | 9.95% |
| 6 | Canada | North America | 390.89 | 1,003.02 | 9.88% |
| 7 | France | Europe | 357.39 | 908.99 | 9.78% |
| 8 | India | Asia Pacific | 268.04 | 1,316.47 | 17.25% |
| 9 | South Korea | Asia Pacific | 245.70 | 783.61 | 12.30% |
| 10 | Australia | Asia Pacific | 223.37 | 658.23 | 11.41% |
| 11 | Brazil | Latin America | 201.03 | 658.23 | 12.59% |
| 12 | Singapore | Asia Pacific | 178.69 | 564.20 | 12.18% |
Forecast Scenarios: How Large Could the Data Center Disaster Resilience and Business Continuity Market Be by 2035?
The Data Center Disaster Resilience and Business Continuity Market ranges from USD 25.08 billion to USD 37.93 billion in 2035 across three DC Market Insights scenarios, with the base case at USD 31.34 billion.
| Scenario | 2035 (USD million) | CAGR 2025-2035 | Assumption |
|---|---|---|---|
| Low | 25,075.60 | 8.42% | Faster shift to cheap cloud recovery, DRaaS cover 10% of installed IT, recovery capacity 1.5% |
| Base | 31,344.50 | 10.87% | DRaaS cover 12% of installed IT, recovery capacity 1.8%, 27 GW completions in 2035 |
| High | 37,926.85 | 13.00% | More rules with fixed test clocks, a second major region outage, recovery capacity 2.2% |
Competitive Insights: Who Leads Data Center Disaster Recovery?
The five largest suppliers, Veeam, Rubrik, Commvault, Cohesity and Microsoft, hold about 22% of the Data Center Disaster Resilience and Business Continuity Market in 2025 (DC Market Insights estimate based on disclosed recurring revenue and the data center share of their workloads), with colocation providers selling recovery suites and cloud providers selling recovery by the server.
- Veeam
- Rubrik
- Commvault
- Cohesity (with Veritas)
- Microsoft (Azure Site Recovery)
- Amazon Web Services (Elastic Disaster Recovery)
- Google Cloud
- HPE (Zerto)
- Dell Technologies
- IBM
- Kyndryl
- Druva
- 11:11 Systems
- Iron Mountain
- Equinix
- Digital Realty
- NTT DATA
Commvault reported fiscal 2026 revenue of USD 1,184 million, up 19%, and total annualised recurring revenue of USD 1,122 million, up 21%, according to its fourth-quarter fiscal 2026 results. Rubrik’s subscription annualised recurring revenue reached USD 1.46 billion at 31 January 2026, up 34% (Source: Rubrik fiscal 2026 results). Druva passed USD 200 million of software-as-a-service annualised recurring revenue in August 2023 (Source: Druva). Iron Mountain’s data center business, with a 1,372.9 MW portfolio across 21 markets, earned about USD 262.9 million in the second quarter of 2026 (Source: Iron Mountain supplemental report). In December 2025 HPE and Chunghwa Telecom announced a disaster recovery centre taking checkpoints every 5 to 10 seconds (Source: HPE).
Recent Developments in the Data Center Disaster Resilience and Business Continuity Market
Eight dated events between July 2024 and April 2026 changed how recovery is bought and tested in the Data Center Disaster Resilience and Business Continuity Market.
- In July 2024, a faulty CrowdStrike update affected 8.5 million Windows devices (Source: Microsoft).
- In January 2025, the EU Digital Operational Resilience Act began to apply, with yearly recovery plan tests (Source: EUR-Lex).
- In March 2025, the UK deadline for firms to remain within impact tolerances passed (Source: Bank of England).
- In July 2025, APRA Prudential Standard CPS 230 came into force in Australia (Source: APRA).
- In September 2025, a fire at Korea’s NIRS Daejeon centre caused failures in 647 government systems; all 709 affected systems were restored by 30 December 2025 (Source: Ministry of the Interior and Safety).
- In October 2025, an outage in the AWS US-EAST-1 region lasted from 11:48 PM PDT on 19 October to 2:20 PM PDT on 20 October (Source: Amazon Web Services).
- In December 2025, Veeam completed its USD 1.725 billion acquisition of Securiti AI (Source: Veeam).
- In April 2026, Commvault reported fiscal 2026 revenue of USD 1,184 million, up 19% (Source: Commvault).
Research Methodology: How DC Market Insights Sized the Data Center Disaster Resilience and Business Continuity Market
DC Market Insights sized the Data Center Disaster Resilience and Business Continuity Market bottom-up at USD 11.17 billion for 2025 from installed and new IT capacity, five unit costs and three bound checks; the full approach is set out in our research methodology.
- Capacity: installed IT base 70 GW in 2020, 116 GW in 2025, 189.9 GW in 2030 and 311 GW in 2035; new IT capacity 12.0 GW in 2025, 22 GW in 2030 and 27 GW in 2035.
- Recovery capacity: 2.6% of installed IT in 2020, 2.4% in 2025 (2,784 MW) and 1.8% in 2035, at USD 1.20, 1.30 and 1.55 million per MW-year.
- DRaaS: 3.0% of installed IT protected in 2020, 7.0% in 2025 (8,120 MW) and 12.0% in 2035, at USD 0.40, 0.36 and 0.28 million per protected MW-year; software USD 20,000-22,000 per installed MW-year; engineering USD 0.10-0.13 million per new MW; testing and services USD 5,000-8,000 per MW-year.
- Bound check 1 (ceiling): USD 11.17 billion is 1.96% of the DC Market Insights global data center market of USD 570.04 billion in 2025.
- Bound check 2 (ceiling): the software layer of USD 2.55 billion is 61% of the USD 4.20 billion combined revenue and recurring revenue of Commvault, Rubrik and Veeam, which also protect endpoints and software-as-a-service data.
- Bound check 3 (floor): at a 45% data center workload share, those three vendors alone imply at least USD 1.89 billion of data center recovery software, below the modelled layer.
- Splits: every segment, region and country split sums to the total in every year from 2020 to 2035; CAGRs are recomputed from endpoint values.
Related DC Market Insights research includes the Data Center Colocation Market, where recovery suites are sold alongside production space.
Table of contents
- 01Introduction
- 1.1Market Definition and Scope
- 1.2Research Methodology
- 02Executive Summary
- 2.1Market Snapshot, 2025, 2026 and 2035
- 2.2Key Market Statistics
- 2.3Key Takeaways
- 03Market Scope
- 3.1Included
- 3.2Excluded
- 3.3Why Estimates Differ
- 04Market Dynamics
- 4.1DORA Yearly Recovery Tests
- 4.2Korea NIRS Daejeon Fire
- 4.3AWS US-EAST-1 Outage
- 4.4Pay-per-Server Cloud Recovery
- 4.5Backup Vendors as Recovery Platforms
- 4.6Idle Recovery Capacity
- 4.7Shared-Provider Risk
- 4.8Government and Public Sector Recovery
- 4.9Seismic and Flood Hardening
- 05Pricing Analysis
- 5.1Recovery Cost per MW, 2020-2035
- 5.2Public Price Anchors
- 06Standards and Regulation
- 6.1DORA
- 6.2NIS2
- 6.3UK Operational Resilience
- 6.4APRA CPS 230
- 6.5MAS BCM Guidelines
- 6.6RBI IT Master Direction
- 6.7TIA-942-C, EN 50600 and ISO 22301
- 07Market Segmentation by Component
- 7.1Recovery Site Capacity
- 7.2Disaster Recovery as a Service
- 7.3Replication and Recovery Orchestration Software
- 7.4Site Resilience Engineering
- 7.5Continuity Planning Testing and Recovery Services
- 08Market Segmentation by Deployment Model
- 8.1Cloud-Based Recovery
- 8.2Colocation Recovery Sites
- 8.3On-Premises and Owned Recovery Sites
- 09Market Segmentation by End User
- 9.1BFSI
- 9.2IT and Telecom
- 9.3Government and Public Sector
- 9.4Retail and Manufacturing
- 9.5Healthcare
- 9.6Other
- 10Market Segmentation by Data Center Type
- 10.1Enterprise-Owned
- 10.2Colocation
- 10.3Hyperscale and Cloud
- 11DC Exclusive
- 11.1The Recovery Test Clock: 7 Rules and Programmes
- 12Regional Insights
- 12.1North America
- 12.2Europe
- 12.3Asia Pacific
- 12.4Latin America
- 12.5Middle East and Africa
- 13Country Analysis
- 13.1United States
- 13.2China
- 13.3Japan
- 13.4Germany
- 13.5United Kingdom
- 13.6Canada
- 13.7France
- 13.8India
- 13.9South Korea
- 13.10Australia
- 13.11Brazil
- 13.12Singapore
- 14Forecast Scenarios
- 14.1Low Scenario
- 14.2Base Scenario
- 14.3High Scenario
- 15Competitive Insights
- 15.1Market Concentration
- 15.2Veeam
- 15.3Rubrik
- 15.4Commvault
- 15.5Cohesity (with Veritas)
- 15.6Microsoft (Azure Site Recovery)
- 15.7Amazon Web Services (Elastic Disaster Recovery)
- 15.8Google Cloud
- 15.9HPE (Zerto)
- 15.10Dell Technologies
- 15.11IBM
- 15.12Kyndryl
- 15.13Druva
- 15.1411:11 Systems
- 15.15Iron Mountain
- 15.16Equinix
- 15.17Digital Realty
- 15.18NTT DATA
- 16Recent Developments
- 16.1July 2024 to April 2026
- 17Research Methodology
- 17.1Capacity and Unit Costs
- 17.2Bound Checks
- Fig. 1Data Center Disaster Resilience and Business Continuity Market Size, 2020-2035
- Table 1Market Snapshot, 2025, 2026 and 2035
- Table 2Scope Comparison
- Table 3Recovery Cost per MW, 2020-2035
- Table 4Market by Component, 2025 and 2035
- Table 5Market by Deployment Model, 2025 and 2035
- Table 6Market by End User, 2025 and 2035
- Table 7Market by Data Center Type, 2025 and 2035
- Table 8The Recovery Test Clock: 7 Rules and Programmes
- Table 9Market by Region, 2025 and 2035
- Table 10Top 12 Countries, 2025 and 2035
- Table 11Forecast Scenarios, 2035
About this report
Written by Amit Jain and reviewed by Deepti Agrawal, Senior Editor, Research. Figures are built top-down and bottom-up and reconciled before publication, with 2025 as the base year.
Read our methodologyHow we built this
- Historical period2020-2024
- Base year2025
- Forecast period2026-2035
- Sizing approachTop-down + bottom-up
Need more than the report?
Advisory on this market
Due diligence, site selection and market entry work, by the analysts who wrote this report.
See consulting servicesFrequently asked questions
USD 12.66 billion in 2026, up 13.39% from USD 11.17 billion in 2025, according to DC Market Insights estimates. The market is projected to reach USD 31.34 billion by 2035, a CAGR of 10.87% from 2025.
10.87% a year from 2025 to 2035, after 16.37% a year from 2020 to 2025, as the installed IT base grew from 70 GW to 116 GW and DRaaS cover rose from 3.0% to 7.0% of installed IT.
About USD 1.30 million per MW-year in 2025, or about USD 108 per kW-month, for dedicated recovery space; DRaaS costs about USD 0.36 million per protected MW-year (DC Market Insights estimates).
Recovery Site Capacity, with USD 3.62 billion or 32.4% of 2025 value. Disaster Recovery as a Service grows fastest at 13.59% a year.
Since 17 January 2025, DORA has required EU financial entities to test ICT business continuity and recovery plans at least yearly and to run threat-led penetration tests at least every 3 years, so banks fund recovery capacity and drills.
On 26 September 2025 a fire at the NIRS Daejeon centre caused failures in 647 government systems. All 709 affected systems were restored by 30 December 2025, with damaged systems moved to a cloud at the Daegu centre.
North America, with USD 4.58 billion or 41.0% of 2025 value. Asia Pacific grows fastest at 12.99% a year, and India is the fastest large country at 17.25%.
At least twice a year in India under the Reserve Bank of India’s IT Master Direction, and at least yearly under the EU’s DORA; Australia’s CPS 230 and Singapore’s MAS guidelines also require tested continuity plans.
About 22% of 2025 value is held by Veeam, Rubrik, Commvault, Cohesity and Microsoft together (DC Market Insights estimate). Amazon Web Services, Google Cloud, HPE Zerto, Iron Mountain and Equinix also sell recovery.
The DC Market Insights figure of USD 12.66 billion for 2026 counts only recovery and site resilience spending for data centers. Estimates that add endpoint and SaaS backup, cyber response or active-active hyperscale regions are larger.
Get this report
How do I get the full report?
Request a quote; we reply by email within one business day.
How and when will I receive the report?
By email, within 24–48 business hours of payment.
How can I pay?
Once you accept the quote, we email you a secure payment link.
Can I see a sample first?
Yes. Request a free sample and we will email it to you.
Can the report be tailored to my needs?
Yes. We can add countries, segments or data cuts. Talk to an analyst about the scope you need.
Can I get an invoice or pay against a purchase order?
Write to sales@dcmarketinsights.com and our team will help.