
Data Center Insurance Market Size, Share & Forecast to 2035
Market at a glance
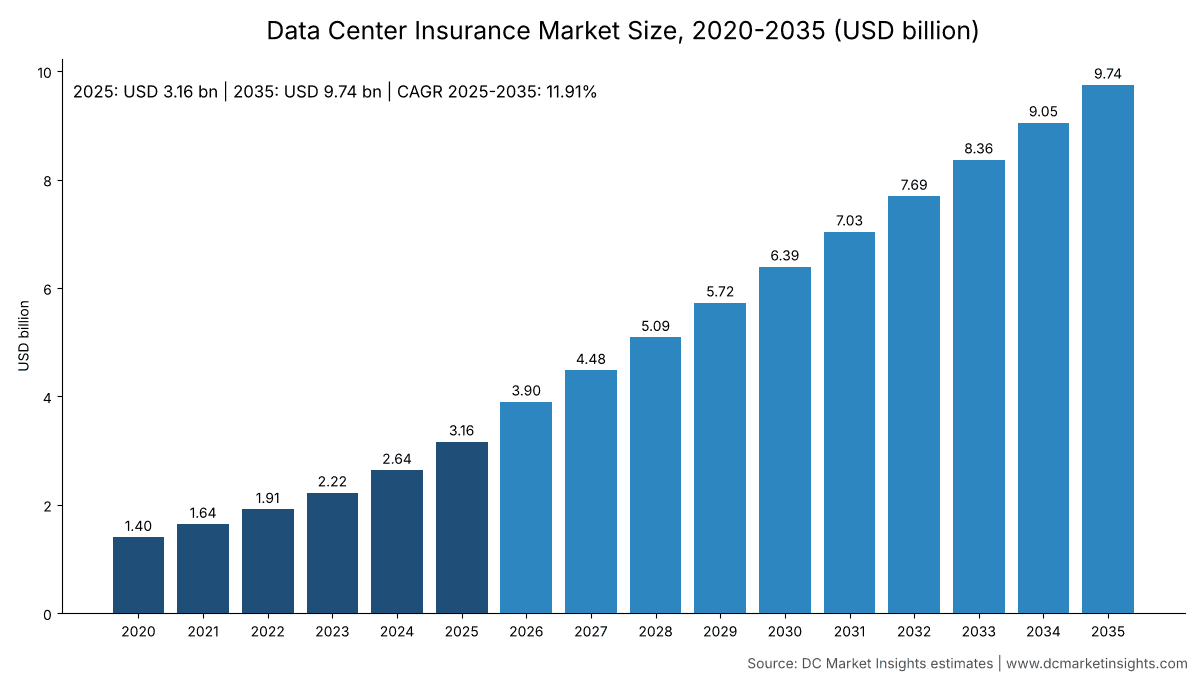
The Data Center Insurance market was worth USD 3,160.0 million in 2025 and is forecast to reach USD 9,740.0 million by 2035, growing at a 11.91% CAGR.
 By Amit Jain, Senior Consultant, ICT & Emerging Technologies
 Reviewed by Deepti Agrawal
Last updated 2 Nov 2026
Base year 2025 PDF + Excel
Key findings
US Data Center Construction Doubles to a USD 96.46 Billion Annual Rate
Facilities Climb From USD 1.5 Billion to USD 5 Billion in a Year
Operators Self-Insure Earthquake and Windstorm
Insuring GPU Clusters Worth USD 30 Million per MW
What is inside the report
- 01Introduction
- 02Executive Summary
- 03Market Scope
- 04Why Market Estimates Differ
- 05Market Drivers
- 06Market Trends
- 07Market Challenges
- 08Market Opportunities
- 09Pricing Analysis
- 10Standards and Regulation
- 18chapters
- 2020-2024Historical period
- 2026-2035Forecast period
- —Companies profiled
Segmentation
Recent developments
Zurich extended Data Center Project Guard to Europe and Latin America and placed a quota-share reinsurance with up to USD 1 billion of capacity (Source: Zurich Insurance Group).
Aon lifted its Data Center Lifecycle facility to up to USD 5 billion (Source: Aon).
Lockton launched a global Data Centers and Digital Infrastructure Practice (Source: Lockton).
FM raised its data center capacity to up to USD 5 billion (Source: FM).
Zurich North America launched Data Center Project Guard for US projects starting 1 January 2026 (Source: Zurich North America).
The Fidelis Partnership launched a USD 250 million Lloyd's construction consortium for AI data centres (Source: The Fidelis Partnership).
Full analysis
The Data Center Insurance Market is valued at USD 3.90 billion in 2026 and is projected to reach USD 9.74 billion by 2035, up from USD 3.16 billion in 2025, a CAGR of 11.91% from 2025 to 2035 (DC Market Insights estimate). Data center insurance premiums are driven by two clocks: the construction clock, where a 1 GW AI campus at USD 11.2 million per MW puts more than USD 11 billion of project value on one builder’s risk policy, and the operating clock, where every megawatt that goes live joins the property, equipment and liability base. The US Census Bureau counted USD 49.74 billion of private data center construction put in place in 2025, against USD 34.80 billion in 2024, and its seasonally adjusted annual rate for September 2026 reached USD 96.46 billion, so the construction book is still widening faster than the operating book. Capacity has followed: FM raised its data center line to up to USD 5 billion in January 2026, and Zurich added a USD 1 billion construction quota-share reinsurance in August 2026. The market covers premiums written for data center risks: construction all risks (CAR) and delay in start-up (DSU), operational property damage and business interruption, IT and electronic equipment, liability, technology errors and omissions (Tech E&O) and cyber written for operators, plus cargo and parametric covers. IT and electronic equipment is the fastest coverage type at 15.55% a year because AI racks carry about USD 30 million of hardware per MW, and the Middle East and Africa is the fastest region at 18.36% as Gulf campuses move from groundbreaking to operation.
Key Market Statistics: How Big Is the Data Center Insurance Market in 2026?
The data center insurance market reaches USD 3.90 billion in 2026, 23.28% above 2025, according to DC Market Insights estimates.
- Market size 2025: USD 3.16 billion
- Market size 2026: USD 3.90 billion
- Market size 2030: USD 6.39 billion
- Market size 2035: USD 9.74 billion
- CAGR 2025-2035: 11.91% (low case 9.45%, high case 14.16%)
- Largest coverage type 2025: Liability, Tech E&O and Cyber, 32.8% of premiums
- Fastest coverage type: IT and Electronic Equipment, 15.55% a year
- Leading region: North America, 52% of 2025 premiums; fastest region: Middle East and Africa, 18.36%
- Largest country: United States, USD 1.49 billion in 2025; fastest large country: Saudi Arabia, 21.10%
- Average premium per installed MW: about USD 27,250 in 2025 (DC Market Insights estimate)
- Largest single-risk capacity announced: up to USD 5 billion (FM, January 2026)
Key Takeaways: What Should Buyers of Data Center Insurance Know?
Four points explain where data center insurance premiums go next, according to DC Market Insights.
- Construction premiums grow only 6.62% a year to 2035 because the CAR and DSU rate falls from 0.52% to 0.36% of project value as dedicated facilities add capacity.
- IT and electronic equipment premiums more than quadruple to USD 2.44 billion because installed IT value per MW rises from USD 11.0 million to USD 16.0 million with AI racks.
- Broker facilities and Lloyd’s consortia rise from 22.0% to 34.0% of premiums because single campuses now need USD 2.5-5 billion of limit.
- Self-insurance caps the market because the largest operators keep earthquake and windstorm risk in captives, as Equinix and Digital Realty disclose in their 2025 annual reports.
Executive Summary: What Is the Data Center Insurance Market Worth?
The Global Data Center Insurance Market size was valued at USD 1.40 billion in 2020, reached USD 3.16 billion in 2025, and is anticipated to reach USD 9.74 billion by 2035, at a CAGR of 11.91% during the forecast period.
| Attribute | Value |
|---|---|
| Historical period | 2020-2024 |
| Base year | 2025 |
| Forecast period | 2026-2035 |
| Market size 2025 | USD 3.16 billion |
| Market size 2026 | USD 3.90 billion |
| CAGR 2025-2035 | 11.91% |
| Market size 2035 | USD 9.74 billion |
Data center insurance grew 17.72% a year from 2020 to 2025 because three things moved at once: new IT capacity rose from 4.5 GW to 12.0 GW a year, project value per MW rose from USD 9.0 million to USD 11.2 million, and the CAR and DSU rate rose from 0.40% to 0.52% after liquid-cooling and fire losses. From 2026 the rate cycle turns while volume keeps rising, so growth slows to 11.91% a year. By 2035 the installed base reaches about 311 GW and operating covers make up 83.8% of premiums, against 75.0% in 2025.
Market Scope: What Does Data Center Insurance Cover?
Data center insurance in this estimate is USD 3.16 billion of gross written premium in 2025 for risks that sit inside or around a data center.
Included
- Construction all risks and builder’s risk, delay in start-up and advance loss of profits for data center projects, including the electrical and mechanical plant.
- Operational property damage and business interruption for completed facilities, including contingent business interruption from utility failure.
- IT and electronic equipment cover (servers, storage, network gear and cooling distribution units) where the equipment owner buys it commercially.
- General liability, umbrella, environmental, Tech E&O and service-level liability, and cyber cover written for data center operators.
- Project cargo for transformers, generators and racks, terrorism, and parametric weather or power-outage covers.
Excluded
- Premiums retained in captives with no reinsurance or fronting, and self-insured losses.
- General corporate cyber and property programmes of companies that only rent cloud services.
- Surety bonds, credit insurance and warranty contracts sold by equipment makers.
- Broker fees and risk-engineering consulting fees.
How the Segments Fit Together
Every dimension sums to USD 3.16 billion in 2025: coverage type follows the five premium lines of the model, while insured party, placement channel and data center type split the same total by who buys, how it is placed and which kind of site is insured.
Why Do Data Center Insurance Market Estimates Differ?
DC Market Insights puts the data center insurance market at USD 3.90 billion in 2026, a commercial-premium measure that is narrower than the widest published views.
Swiss Re Institute wrote in July 2026 that global insurance premiums tied to data centres stand at USD 10.6 billion and could reach USD 24.2 billion by 2030. Broader measures of that kind add risks that never reach an open-market policy: hyperscalers retain earthquake, flood and windstorm in captives, colocation tenants insure their own servers inside general corporate programmes, and the energy assets that feed a campus (gas turbines, substations, batteries) are often written as power risks. Adding general cyber premiums of every cloud customer, warranty contracts and surety bonds lifts the figure further. This estimate counts only premiums written for data center risks and placed with insurers, including fronted captive programmes.
| Element | In this estimate | Why |
|---|---|---|
| CAR and DSU for data center projects | Yes, USD 698.88 million in 2025 | Written per project |
| Operating property and business interruption | Yes, USD 760.03 million | Facility owner buys it |
| IT equipment bought commercially | Yes, USD 574.20 million | 30% of installed IT value is insured on the open market |
| Self-insured and unreinsured captive retentions | No | No premium reaches the market |
| Power plants built for campuses | No | Written as energy risks |
| General cyber of cloud customers | No | Not a data center risk |
Buyer groups inside the scope include small enterprise server rooms and edge sites as well as hyperscale campuses, so small and medium enterprises that own a data hall count here.
Market Drivers: Why Are Data Center Insurance Premiums Rising?
Data center insurance premiums rose 23.28% in 2026 because three forces push the insured base up at once, per DC Market Insights.
US Data Center Construction Doubles to a USD 96.46 Billion Annual Rate
The US Census Bureau’s construction spending survey shows data center construction at a seasonally adjusted annual rate of USD 96.46 billion in September 2026, nearly double the USD 50.7 billion of September 2025. Every dollar of that value sits on a builder’s risk or CAR policy for 18 to 30 months. At a 0.55% CAR and DSU rate in 2026, the US build alone carries more than USD 500 million a year of premium, which is why Zurich reported 18% growth in its construction premiums in the first half of 2026 and named data center demand as the cause.
Hyperscaler Capital Spending Passes USD 360 Billion
Amazon (USD 131.82 billion), Alphabet (USD 91.45 billion), Meta (USD 72.22 billion including finance leases) and Microsoft (USD 64.55 billion in the year to June 2025) together reported more than USD 360 billion of capital spending for 2025 in their filings with the US Securities and Exchange Commission (SEC). Meta guided USD 115-135 billion for 2026. The hardware share of that spending is what lifts the IT and electronic equipment line: DC Market Insights puts installed IT value at USD 11.0 million per MW in 2025, rising to USD 15.0 million by 2030.
Liquid Cooling Changes the Loss Profile
Swiss Re Institute, citing an FM loss study, wrote in July 2026 that fire caused 10.9% of data center loss events but 42.3% of loss costs, and that liquid-related losses made up nearly 24% of loss costs. Direct-to-chip loops put water inside racks worth USD 3-4 million each, so insurers price water damage and electrical fire into both the CAR rate and the operating property rate, which rose from 0.11% to 0.13% of insured value between 2020 and 2025 (DC Market Insights estimate).
Market Trends: How Is Data Center Insurance Changing?
Data center insurance is moving to dedicated facilities: broker facilities and Lloyd’s consortia grow 16.89% a year, the fastest placement channel.
Facilities Climb From USD 1.5 Billion to USD 5 Billion in a Year
Aon launched its Data Center Lifecycle facility at up to USD 1.5 billion in July 2025, lifted it to USD 2.5 billion in January 2026 and to up to USD 5 billion in July 2026, with a separate USD 400 million cyber and Tech E&O layer. Marsh widened its Nimbus facility to USD 2.7 billion in January 2026. WTW said in July 2026 that the market can field up to USD 15 billion for one large data center risk. These facilities let one placement cover a whole campus, so their share of premiums rises from 22.0% in 2025 to 34.0% by 2035.
Builder’s Risk Policies Run Into the First Operating Year
Zurich North America’s Data Center Project Guard, launched in December 2025 for US projects from January 2026, adds a weather parametric cover for the first construction year and up to 12 months of operating property and business interruption after completion. Zurich extended it to Europe and Latin America in August 2026. Lifecycle wording removes the gap between the contractor’s policy and the owner’s property programme, which is where hand-over losses used to fall.
Lloyd’s Consortia Bring New Capital
The Fidelis Partnership launched a Lloyd’s construction consortium for AI data centres with USD 250 million of capacity in November 2025, backed by Syndicate 3123 and joined by Syndicate 2126 from January 2026. Third-party capital in such consortia keeps excess construction layers available as single projects pass USD 10 billion.
Market Challenges: What Holds Back Data Center Insurance?
Data center insurance loses about 20% of potential premium to self-insurance and captives, the main brake on the market (DC Market Insights estimate).
Operators Self-Insure Earthquake and Windstorm
Equinix states in its 2025 annual report that it self-insures its data centers in high-risk earthquake zones, including California and Japan. Digital Realty insures through commercial cover, self-insurance and a wholly owned captive, and says it may stop buying earthquake, flood or windstorm cover where premiums exceed the value of the cover. When the two largest colocation operators keep catastrophe risk in-house, premium growth in seismic markets such as Japan stays below volume growth.
Natural Catastrophe Exposure Concentrates in a Few Corridors
Swiss Re Institute estimates that about 40% of US data center capacity could sit in zones with significant tornado activity and that more than a quarter faces frequent large hail. Concentration in Northern Virginia, Texas and the US Midwest makes accumulation the limiting factor for property capacity, so insurers ration catastrophe limits and push deductibles up rather than writing more premium.
Market Opportunities: Where Is the Growth in Data Center Insurance?
Data center insurance gains USD 1.86 billion of IT equipment premium and USD 2.21 billion of liability, Tech E&O and cyber premium between 2025 and 2035 (DC Market Insights estimate).
Insuring GPU Clusters Worth USD 30 Million per MW
GPU clouds and AI labs that lease space in colocation halls own racks worth about USD 30 million per MW, far more than the building around them. IT and electronic equipment premiums rise from USD 574.20 million in 2025 to USD 2.44 billion by 2035 as the insured share of installed IT value climbs from 30% to 35%, since lenders financing GPU purchases ask for equipment cover.
Service-Level and Cyber Cover for Operators Under DORA
The three European supervisory authorities designated the first critical ICT (information and communication technology) third-party providers under the EU Digital Operational Resilience Act (DORA) on 18 November 2025. Banks now write tighter service-level and liability terms into contracts with cloud and data center providers, which raises demand for Tech E&O and service-level liability. The liability, Tech E&O and cyber line grows 12.08% a year to USD 3.24 billion by 2035.
Pricing Analysis: What Does Data Center Insurance Cost per MW?
Data center insurance cost about USD 27,250 per installed MW in 2025 across all lines, and a CAR and DSU policy cost about 0.52% of project value, according to DC Market Insights estimates.
| Year | CAR and DSU rate (% of project value) | Operating property and BI rate (% of insured value) | Project value per new MW (USD million) | Premium per installed MW (USD thousand) |
|---|---|---|---|---|
| 2020 | 0.40% | 0.110% | 9.00 | 17.53 |
| 2025 | 0.52% | 0.130% | 11.20 | 27.25 |
| 2030 | 0.42% | 0.122% | 12.43 | 32.20 |
| 2035 | 0.36% | 0.115% | 13.65 | 31.36 |
Public anchors: Digital Realty reported in its 2025 annual report that its September 2024 Singapore data center incident cost about USD 16 million initially and that it had received USD 36.8 million of insurance proceeds by 31 December 2025, of which USD 21.6 million was for business interruption. Zurich says it has insured more than 250 data center projects worth over USD 350 billion of project value. DC Market Insights models rate softening from 2027 as FM, Aon, Marsh and Lloyd’s consortia add capacity, with the CAR and DSU rate back to 0.36% by 2035.
Standards and Regulation: Which Rules Shape Data Center Insurance?
Data center insurance terms follow six named standards and rules, and FM’s property data sheets set the engineering baseline for 24.0% of 2025 premiums written as operating property cover.
- NFPA 75, Standard for the Fire Protection of Information Technology Equipment (National Fire Protection Association), and NFPA 76 for telecommunications facilities, which underwriters use to rate fire protection.
- FM Property Loss Prevention Data Sheet 5-32, Data Centers and Related Facilities (FM), which sets sprinkler, battery-room and cooling-loop guidance for FM-insured sites.
- EN 50600, the European standard series for data center facilities and infrastructure (CENELEC), used to evidence resilience classes.
- EU Digital Operational Resilience Act (DORA), Regulation (EU) 2022/2554, with oversight of critical ICT third-party providers since the designation of 18 November 2025 (Source: EIOPA).
- Lloyd’s Market Bulletin Y5381, which requires state-backed cyber-attack exclusions in standalone cyber policies from 31 March 2023 (Source: Lloyd’s).
- The National Association of Insurance Commissioners (NAIC) cyber supplement, which shows US cyber direct written premiums of about USD 9.46 billion in 2025 (Source: NAIC 2026 report).
Market Segmentation: Which Data Center Insurance Lines Are Largest?
Liability, Tech E&O and cyber is the largest data center insurance line at 32.8% of 2025 premiums, and IT and electronic equipment is the fastest at 15.55% a year (DC Market Insights estimate).
By Coverage Type
Construction cover is the most cyclical line: it rises with new GW and with the rate, so its share falls from 22.1% to 13.6% as rates soften.
| Coverage Type | 2025 (USD million) | Share 2025 | 2035 (USD million) | CAGR 2025-2035 |
|---|---|---|---|---|
| Liability Tech E&O and Cyber | 1,036.00 | 32.8% | 3,241.20 | 12.08% |
| Operational Property and Business Interruption | 760.03 | 24.0% | 2,485.26 | 12.58% |
| Construction All Risks and Delay in Start-Up | 698.88 | 22.1% | 1,326.78 | 6.62% |
| IT and Electronic Equipment | 574.20 | 18.2% | 2,435.74 | 15.55% |
| Cargo Parametric and Other | 91.80 | 2.9% | 253.94 | 10.71% |
| Total | 3,160.91 | 100.0% | 9,742.91 | 11.91% |
By Insured Party
Hyperscale and cloud operators are the largest buyers at 34.0% and grow 13.17% a year, while developers and contractors lose share as owners buy lifecycle policies themselves.
| Insured Party | 2025 (USD million) | Share 2025 | 2035 (USD million) | CAGR 2025-2035 |
|---|---|---|---|---|
| Hyperscale and Cloud Operators | 1,074.71 | 34.0% | 3,702.31 | 13.17% |
| Colocation and Wholesale Operators | 948.27 | 30.0% | 3,117.73 | 12.64% |
| Developers and Contractors | 568.96 | 18.0% | 1,266.58 | 8.33% |
| Enterprises and Government | 568.96 | 18.0% | 1,656.29 | 11.28% |
| Total | 3,160.91 | 100.0% | 9,742.91 | 11.91% |
By Placement Channel
Open-market placement still writes 58.0% of premiums, but facilities and consortia grow 16.89% a year.
| Placement Channel | 2025 (USD million) | Share 2025 | 2035 (USD million) | CAGR 2025-2035 |
|---|---|---|---|---|
| Open-Market Placement | 1,833.33 | 58.0% | 4,384.31 | 9.11% |
| Broker Facilities and Lloyd's Consortia | 695.40 | 22.0% | 3,312.59 | 16.89% |
| Captive Fronting and Direct Placement | 632.18 | 20.0% | 2,046.01 | 12.46% |
| Total | 3,160.91 | 100.0% | 9,742.91 | 11.91% |
By Data Center Type
Hyperscale and AI campuses rise from 46.0% to 58.0% of premiums because single sites now pass 1 GW.
| Data Center Type | 2025 (USD million) | Share 2025 | 2035 (USD million) | CAGR 2025-2035 |
|---|---|---|---|---|
| Hyperscale and AI Campuses | 1,454.02 | 46.0% | 5,650.89 | 14.54% |
| Multi-Tenant Colocation | 1,011.49 | 32.0% | 2,825.44 | 10.82% |
| Enterprise and Edge | 695.40 | 22.0% | 1,266.58 | 6.18% |
| Total | 3,160.91 | 100.0% | 9,742.91 | 11.91% |
DC Exclusive: Data Center Insurance Capacity Ladder and 100 MW Premium Teardown
The DC Market Insights capacity ladder lists 9 named data center facilities and lines from USD 67.5 million to USD 5 billion, and the teardown is a DC Market Insights model built on 7 inputs that prices a 100 MW AI campus at about USD 5.8 million of construction premium.
| Facility or line | Type | Capacity | Date |
|---|---|---|---|
| FM Intellium data center capacity | Insurer line | Up to USD 5 billion | Jan 2026 |
| Aon Data Center Lifecycle facility | Broker facility (CAR, DSU, property) | Up to USD 5 billion | Jul 2026 |
| Marsh Nimbus | Broker facility (CAR, DSU, BI) | Up to USD 2.7 billion | Jan 2026 |
| Marsh UK and Europe construction facility | Broker facility | EUR 1 billion CAR + EUR 350 million DSU | Jun 2025 |
| Zurich construction quota share | Reinsurance capacity | Up to USD 1 billion | Aug 2026 |
| Aon cyber and Tech E&O layer | Broker facility | USD 400 million | Jul 2026 |
| The Fidelis Partnership Lloyd’s consortium | Excess construction | USD 250 million | Nov 2025 |
| Marsh Nimbus Casualty | Excess casualty, US | USD 75 million | Feb 2026 |
| MS Amlin Lloyd’s property treaty consortium | Per-risk line | USD 67.5 million | May 2026 |
| Line (100 MW AI campus, 2025) | Basis | USD million |
|---|---|---|
| Project value | 100 MW x USD 11.2 million per MW | 1,120.00 |
| CAR and DSU premium, whole build | 0.52% of project value | 5.82 |
| Cargo for transformers, generators and racks | 0.045% of USD 3.0 billion of AI racks | 1.35 |
| Operating property and BI, per year | USD 700 million x 72% insured x 0.13% | 0.66 |
| IT equipment cover, per year | USD 3.0 billion AI racks x 50% insured x 0.15% | 2.25 |
| Liability, Tech E&O and cyber, per year | 1.60% of USD 150 million operator revenue | 2.40 |
| First operating year, all lines | sum of yearly lines | 5.31 |
The teardown shows why owners now buy lifecycle cover: the construction premium of about USD 5.8 million is paid once, but the yearly operating premium of about USD 5.3 million repeats, and 42% of it is IT equipment cover that only appears once AI racks are installed. A conventional 100 MW hall with USD 10 million per MW of IT would pay about USD 3.8 million a year.
Regional Insights: Which Region Leads Data Center Insurance?
North America leads the data center insurance market with 52% of 2025 premiums, and the Middle East and Africa grows fastest at 18.36% a year (DC Market Insights estimate).
| Region | 2025 (USD million) | Share 2025 | 2035 (USD million) | CAGR 2025-2035 |
|---|---|---|---|---|
| North America | 1,643.67 | 52% | 4,579.17 | 10.79% |
| Europe | 695.40 | 22% | 1,851.15 | 10.29% |
| Asia Pacific | 600.57 | 19% | 2,240.87 | 14.07% |
| Latin America | 94.83 | 3% | 389.72 | 15.18% |
| Middle East and Africa | 126.44 | 4% | 682.00 | 18.36% |
North America
North America’s data center insurance premiums grow 10.79% a year. US Census data put 2025 data center construction at USD 49.74 billion, and Zurich’s Project Guard and Marsh’s Nimbus Casualty were written first for US projects.
Europe
Europe holds 22% of 2025 premiums and grows 10.29% a year; Marsh’s EUR 1 billion construction facility of June 2025 and DORA oversight of critical ICT providers anchor demand in the UK, Ireland, Germany and France.
Asia Pacific
Asia Pacific grows 14.07% a year; Digital Realty’s Singapore incident of September 2024 and the Daejeon government data center fire in South Korea in September 2025, which took 647 government systems offline, pushed fire and battery-room surveys up underwriters’ lists. Chubb’s February 2026 Asia Pacific data centre wording covers CAR, DSU, cargo, property, Tech E&O and cyber in one programme.
Latin America
Latin America grows 15.18% a year from 3% of 2025 premiums, helped by Zurich’s August 2026 extension of Project Guard to Latin American projects.
Middle East and Africa
The Middle East and Africa grows 18.36% a year, the fastest region, as gigawatt campuses in Saudi Arabia and the United Arab Emirates move from construction cover to operating property and equipment cover after 2027.
Country Analysis: Which Countries Pay the Most for Data Center Insurance?
The United States pays USD 1.49 billion of 2025 data center insurance premiums, 47.0% of the world, and Saudi Arabia is the fastest large country at 21.10% a year (DC Market Insights estimate).
| Rank | Country | Region | 2025 (USD million) | 2035 (USD million) | CAGR 2025-2035 |
|---|---|---|---|---|---|
| 1 | United States | North America | 1,485.63 | 4,092.02 | 10.66% |
| 2 | China | Asia Pacific | 164.37 | 535.86 | 12.54% |
| 3 | United Kingdom | Europe | 158.05 | 389.72 | 9.45% |
| 4 | Germany | Europe | 126.44 | 341.00 | 10.43% |
| 5 | Japan | Asia Pacific | 123.28 | 370.23 | 11.62% |
| 6 | Canada | North America | 94.83 | 292.29 | 11.91% |
| 7 | France | Europe | 79.02 | 214.34 | 10.49% |
| 8 | Australia | Asia Pacific | 66.38 | 214.34 | 12.44% |
| 9 | Ireland | Europe | 63.22 | 146.14 | 8.74% |
| 10 | India | Asia Pacific | 50.57 | 292.29 | 19.18% |
| 11 | Singapore | Asia Pacific | 47.41 | 136.40 | 11.15% |
| 12 | Saudi Arabia | Middle East and Africa | 31.61 | 214.34 | 21.10% |
India is the second-fastest large country at 19.18% a year as new colocation campuses move from construction cover to operating cover, while Ireland grows slowest at 8.74% because grid limits around Dublin slow new construction cover.
Forecast Scenarios: How Large Could Data Center Insurance Be in 2035?
Data center insurance reaches USD 9.74 billion in 2035 in the base case, with a range of USD 7.79 billion to USD 11.89 billion (DC Market Insights estimate).
| Scenario | 2035 (USD million) | CAGR 2025-2035 | Assumption |
|---|---|---|---|
| Low | 7,794.33 | 9.45% | Rates soften twice as fast as capacity grows; new IT capacity stays near 20 GW a year |
| Base | 9,742.91 | 11.91% | 27 GW a year by 2035; CAR rate 0.36%, property rate 0.115% |
| High | 11,886.35 | 14.16% | A large liquid-cooling or fire loss hardens rates; insured share of IT value reaches 45% |
Key Players and Market Share: Who Writes Data Center Insurance?
The five largest carriers write about 32% of data center insurance premiums, according to a DC Market Insights estimate based on announced capacity and project counts; the rest is spread across Lloyd’s syndicates, regional insurers and captives.
- FM
- Zurich Insurance Group
- Chubb
- AIG
- Allianz Commercial
- AXA XL
- Munich Re
- Swiss Re
- Tokio Marine HCC
- Liberty Mutual
- Beazley
- The Fidelis Partnership
- MS Amlin
- Marsh (broker)
- Aon (broker)
- WTW (broker)
- Lockton (broker)
FM can provide up to USD 5 billion of capacity to data center clients after its January 2026 increase. Zurich says it supports more than USD 1 trillion of data center assets and projects and formed a Data Center Risk Advisory practice with more than 100 risk engineers in January 2026. Munich Re puts the global cyber insurance market at USD 15.3 billion in 2024, the pool from which operators’ cyber cover is drawn. Among brokers, Aon, Marsh and WTW run dedicated facilities, and Lockton launched a global Data Centers and Digital Infrastructure Practice in July 2026.
Recent Developments: What Changed in Data Center Insurance in 2025-2026?
Six dated moves in data center insurance added more than USD 11 billion of announced limit between November 2025 and August 2026.
- In August 2026, Zurich extended Data Center Project Guard to Europe and Latin America and placed a quota-share reinsurance with up to USD 1 billion of capacity (Source: Zurich Insurance Group).
- In July 2026, Aon lifted its Data Center Lifecycle facility to up to USD 5 billion (Source: Aon).
- In July 2026, Lockton launched a global Data Centers and Digital Infrastructure Practice (Source: Lockton).
- In January 2026, FM raised its data center capacity to up to USD 5 billion (Source: FM).
- In December 2025, Zurich North America launched Data Center Project Guard for US projects starting 1 January 2026 (Source: Zurich North America).
- In November 2025, The Fidelis Partnership launched a USD 250 million Lloyd’s construction consortium for AI data centres (Source: The Fidelis Partnership).
Research Methodology: How DC Market Insights Sized Data Center Insurance
DC Market Insights sized the data center insurance market at USD 3.16 billion for 2025 from five premium lines, each a physical base times a rate.
- Construction: 12.0 GW of new IT capacity x USD 11.2 million per MW = USD 134.4 billion of project value x 0.52% CAR and DSU rate = USD 698.88 million.
- Operating property and BI: 116 GW installed x USD 7.0 million insured facility value per MW x 72% commercially insured x 0.13% = USD 760.03 million.
- IT and electronic equipment: 116 GW x USD 11.0 million IT value per MW x 30% insured x 0.15% = USD 574.20 million.
- Liability, Tech E&O and cyber: USD 64.75 billion of colocation revenue x 1.60% = USD 1.04 billion.
- Cargo, parametric and other: USD 204 billion of IT and plant delivered to new sites x 0.045% = USD 91.80 million.
Capacity inputs match the DC Market Insights base used across its reports: 12.0 GW of new IT capacity in 2025, 22 GW in 2030 and 27 GW in 2035, and an installed base of 116 GW in 2025 rising to about 311 GW in 2035. Three bound checks hold:
- Ceiling: the estimate is 30% of the USD 10.6 billion that Swiss Re Institute ties to data centres in its wider measure, which includes retained and energy-asset risks.
- Ceiling: the construction line equals 0.52% of the global project value, of which US construction put in place (USD 49.74 billion in 2025, US Census Bureau) is 37%.
- Floor: Zurich’s book of more than USD 350 billion of project value at a 0.40% minimum rate implies about USD 1.4 billion of premium over three-year builds, about USD 470 million a year from one insurer, below the USD 698.88 million construction line.
Read more about the approach on the research methodology page. Related DC Market Insights reports: the Data Center Construction Market, the Data Center Design Market, the Wholesale Colocation Market and the Retail Colocation Market.
Table of contents
- 01Introduction
- 1.1Report Description
- 1.2Key Market Statistics, 2025, 2026, 2030 and 2035
- 1.3Key Takeaways
- 02Executive Summary
- 2.1Market Snapshot, 2025, 2026 and 2035
- 2.2Market Size Chart, 2020-2035
- 03Market Scope
- 3.1Included
- 3.2Excluded
- 3.3How the Segments Fit Together
- 04Why Market Estimates Differ
- 4.1Scope Table: In and Out of This Estimate
- 05Market Drivers
- 5.1US Data Center Construction Doubles to a USD 96.46 Billion Annual Rate
- 5.2Hyperscaler Capital Spending Passes USD 360 Billion
- 5.3Liquid Cooling Changes the Loss Profile
- 06Market Trends
- 6.1Facilities Climb From USD 1.5 Billion to USD 5 Billion in a Year
- 6.2Builder's Risk Policies Run Into the First Operating Year
- 6.3Lloyd's Consortia Bring New Capital
- 07Market Challenges
- 7.1Operators Self-Insure Earthquake and Windstorm
- 7.2Natural Catastrophe Exposure Concentrates in a Few Corridors
- 08Market Opportunities
- 8.1Insuring GPU Clusters Worth USD 30 Million per MW
- 8.2Service-Level and Cyber Cover for Operators Under DORA
- 09Pricing Analysis
- 9.1Rates and Premium per MW, 2020-2035
- 9.2Public Price Anchors
- 10Standards and Regulation
- 10.1NFPA 75 and NFPA 76
- 10.2FM Data Sheet 5-32
- 10.3EN 50600
- 10.4EU Digital Operational Resilience Act
- 10.5Lloyd's Market Bulletin Y5381
- 10.6NAIC Cyber Supplement
- 11Market Segmentation
- 11.1By Coverage Type
- 11.2Liability Tech E&O and Cyber
- 11.3Operational Property and Business Interruption
- 11.4Construction All Risks and Delay in Start-Up
- 11.5IT and Electronic Equipment
- 11.6Cargo Parametric and Other
- 11.7By Insured Party
- 11.8Hyperscale and Cloud Operators
- 11.9Colocation and Wholesale Operators
- 11.10Developers and Contractors
- 11.11Enterprises and Government
- 11.12By Placement Channel
- 11.13Open-Market Placement
- 11.14Broker Facilities and Lloyd's Consortia
- 11.15Captive Fronting and Direct Placement
- 11.16By Data Center Type
- 11.17Hyperscale and AI Campuses
- 11.18Multi-Tenant Colocation
- 11.19Enterprise and Edge
- 12DC Exclusive: Data Center Insurance Capacity Ladder and 100 MW Premium Teardown
- 12.1Capacity Ladder: 9 Facilities and Lines
- 12.2100 MW AI Campus Premium Teardown
- 13Regional Insights
- 13.1North America
- 13.2Europe
- 13.3Asia Pacific
- 13.4Latin America
- 13.5Middle East and Africa
- 14Country Analysis
- 14.1United States
- 14.2China
- 14.3United Kingdom
- 14.4Germany
- 14.5Japan
- 14.6Canada
- 14.7France
- 14.8Australia
- 14.9Ireland
- 14.10India
- 14.11Singapore
- 14.12Saudi Arabia
- 15Forecast Scenarios, 2035
- 15.1Low Scenario
- 15.2Base Scenario
- 15.3High Scenario
- 16Competitive Insights
- 16.1Carrier Concentration, 2025
- 16.2FM
- 16.3Zurich Insurance Group
- 16.4Chubb
- 16.5AIG
- 16.6Allianz Commercial
- 16.7AXA XL
- 16.8Munich Re
- 16.9Swiss Re
- 16.10Tokio Marine HCC
- 16.11Liberty Mutual
- 16.12Beazley
- 16.13The Fidelis Partnership
- 16.14MS Amlin
- 16.15Marsh
- 16.16Aon
- 16.17WTW
- 16.18Lockton
- 17Recent Developments
- 17.1Zurich Europe and Latin America Extension, August 2026
- 17.2Aon USD 5 Billion Facility, July 2026
- 17.3Lockton Data Center Practice, July 2026
- 17.4FM USD 5 Billion Capacity, January 2026
- 17.5Zurich Data Center Project Guard, December 2025
- 17.6Fidelis Lloyd's Consortium, November 2025
- 18Research Methodology
- 18.1Model Inputs
- 18.2Bound Checks
- Fig. 1Data Center Insurance Market Size, 2020-2035 (USD million)
- Table 1Market Snapshot, 2025, 2026 and 2035
- Table 2Scope Table: In and Out of This Estimate
- Table 3Rates and Premium per MW, 2020-2035
- Table 4Market by Coverage Type, 2025 and 2035
- Table 5Market by Insured Party, 2025 and 2035
- Table 6Market by Placement Channel, 2025 and 2035
- Table 7Market by Data Center Type, 2025 and 2035
- Table 8Data Center Insurance Capacity Ladder
- Table 9100 MW AI Campus Premium Teardown
- Table 10Market by Region, 2025 and 2035
- Table 11Top 12 Countries, 2025 and 2035
- Table 122035 Forecast Scenarios
About this report
Written by Amit Jain and reviewed by Deepti Agrawal, Senior Editor, Research. Figures are built top-down and bottom-up and reconciled before publication, with 2025 as the base year.
Read our methodologyHow we built this
- Historical period2020-2024
- Base year2025
- Forecast period2026-2035
- Sizing approachTop-down + bottom-up
Need more than the report?
Advisory on this market
Due diligence, site selection and market entry work, by the analysts who wrote this report.
See consulting servicesFrequently asked questions
USD 3.90 billion in 2026, up 23.28% from USD 3.16 billion in 2025, according to DC Market Insights estimates. The market is projected to reach USD 9.74 billion by 2035, a CAGR of 11.91% from 2025.
11.91% a year from 2025 to 2035, after 17.72% a year from 2020 to 2025, because new IT capacity rises from 12.0 GW to 27 GW a year while the construction rate softens from 0.52% to 0.36% of project value.
USD 3.16 billion of 2025 premiums covered construction all risks and delay in start-up, operating property and business interruption, IT equipment, liability, Tech E&O and cyber, and cargo and parametric covers. Self-insured and captive-retained risks are not counted.
About USD 27,250 per installed MW in 2025 across all lines, and 0.52% of project value for a construction all risks and delay in start-up policy, according to DC Market Insights estimates. A 100 MW AI campus pays about USD 5.3 million a year once operating.
IT and electronic equipment, at 15.55% a year to USD 2.44 billion by 2035, because installed IT value rises from USD 11.0 million to USD 16.0 million per MW with AI racks. Liability, Tech E&O and cyber is the largest line.
Up to USD 5 billion from FM since January 2026 and up to USD 5 billion through Aon’s lifecycle facility since July 2026. WTW said in July 2026 that the market can field up to USD 15 billion for one large risk.
North America, with 52% of 2025 premiums and USD 1.49 billion in the United States. The Middle East and Africa grows fastest at 18.36% a year, and Saudi Arabia is the fastest large country at 21.10%.
About 20% of potential premium stays in captives because catastrophe cover is costly. Equinix self-insures its California and Japan sites against earthquake, and Digital Realty may stop buying earthquake, flood or windstorm cover where premiums exceed its value.
FM, Zurich, Chubb, AIG, Allianz Commercial, AXA XL, Munich Re, Swiss Re and Tokio Marine HCC lead, with Lloyd’s consortia such as The Fidelis Partnership’s USD 250 million facility. The five largest carriers write about 32% of premiums (DC Market Insights estimate).
USD 3.90 billion in 2026 counts only premiums placed with insurers for data center risks. Wider measures add captive retentions, colocation tenants’ corporate programmes, power plants built for campuses and general cyber premiums, so they come out about three times larger.
Get this report
How do I get the full report?
Request a quote; we reply by email within one business day.
How and when will I receive the report?
By email, within 24–48 business hours of payment.
How can I pay?
Once you accept the quote, we email you a secure payment link.
Can I see a sample first?
Yes. Request a free sample and we will email it to you.
Can the report be tailored to my needs?
Yes. We can add countries, segments or data cuts. Talk to an analyst about the scope you need.
Can I get an invoice or pay against a purchase order?
Write to sales@dcmarketinsights.com and our team will help.