
Data Center Piping Market Size, Share & Forecast to 2035
Market at a glance
The Data Center Piping market was worth USD 1,170.0 million in 2025 and is forecast to reach USD 4,500.0 million by 2035, growing at a 29.12% CAGR.
 By Amit Jain, Senior Consultant, ICT & Emerging Technologies
 Reviewed by Deepti Agrawal
Last updated 21 Oct 2026
Base year 2025 PDF + Excel
Key findings
OCP Stainless-Steel TCS Loops Raise Piping per MW from USD 70,000 to USD 190,000
Polymer TCS Pipe Challenges Stainless Steel
A 50% United States Steel Tariff and 13.2% Pipe Inflation
TCS Loops and Rack Manifolds: USD 177.12 million to USD 1.58 billion
What is inside the report
- 01Introduction
- 02Executive Summary
- 03Market Scope
- 04Why Market Estimates Differ
- 05Market Drivers
- 06Market Trends
- 07Market Challenges
- 08Market Opportunities
- 09Pricing Analysis
- 10Standards and Regulation
- 19chapters
- 2020-2024Historical period
- 2026-2035Forecast period
- 8Companies profiled
Segmentation
Companies profiled
- Belimo: valves and actuators; 2025 sales CHF 1,120.8 million
- Viega: press fitting systems for chilled water and TCS loops
- NIBCO: ball, butterfly, check and balancing valves for liquid cooling
- Kingspan (Advnsys): liquid cooling manifolds and containment
- Armacell: flexible pipe insulation, including ArmaFlex Ultima
- Aliaxis (IPEX): thermoplastic pipe systems; 2025 revenue EUR 3.5 billion
- Schneider Electric (Motivair): TCS loops alongside CDUs
- nVent: TCS manifolds and rack liquid cooling
Recent developments
GF supplied COOL-FIT 2.0 and 4.0 pre-insulated pipe for the facility water loop of an NTT FACILITIES liquid cooling testbed (Source: GF).
GF launched LiquidCore, a polymer piping system from the CDU to the cold plate (Source: GF).
Vertiv completed its purchase of PurgeRite, a flushing, purging and filtration services firm, for about USD 1.0 billion (Source: Vertiv).
Perma-Pipe reported fiscal 2025 net sales of USD 210.9 million and a new Ohio plant lease for AI data centers (Source: Perma-Pipe).
GF reported that data center order intake doubled in the first half of 2026 (Source: GF).
nVent and AMD showed cooling for the AMD Helios rack, including manifolds (Source: nVent).
Full analysis
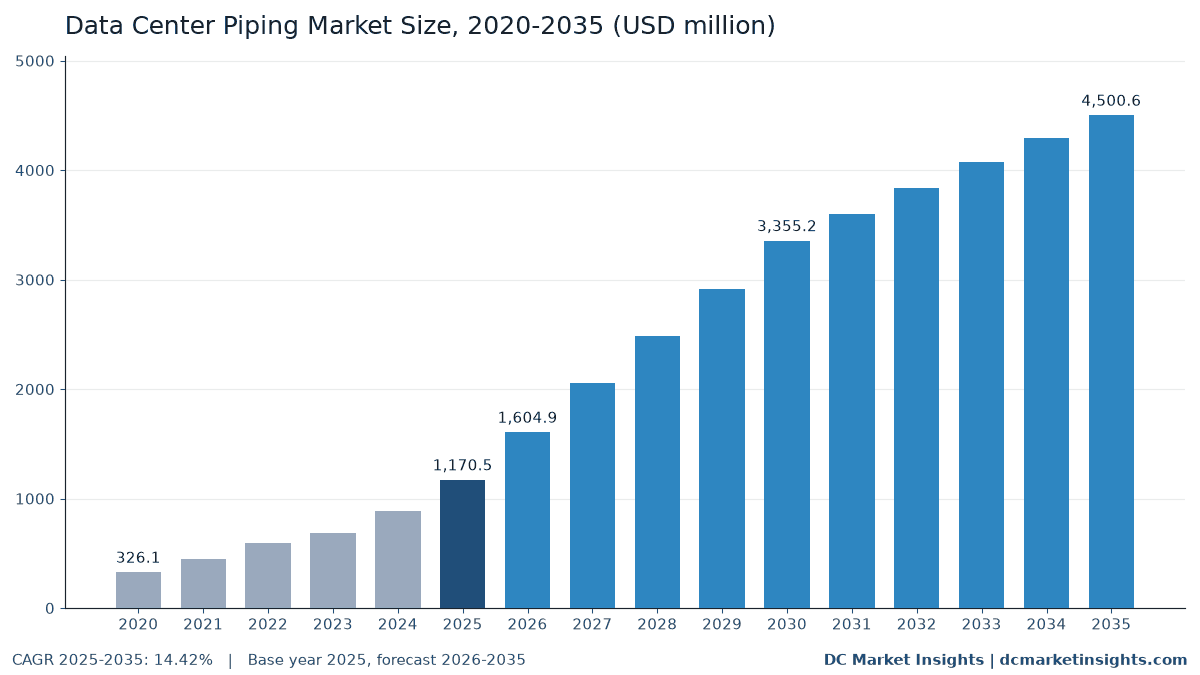
The Data Center Piping Market is valued at USD 1.60 billion in 2026 and is projected to reach USD 4.50 billion by 2035, up from USD 1.17 billion in 2025, a CAGR of 14.42% from 2025 to 2035 (DC Market Insights estimate). The money follows the cooling loop rather than floor area: a 1 MW air-cooled hall on chilled water needs about USD 70,000 of pipe, fittings, valves and insulation, while a liquid-cooled artificial intelligence (AI) hall adds a technology cooling system (TCS) loop to every rack and needs about USD 190,000 per MW. The Open Compute Project (OCP) set the material in January 2025 by asking for TCS row manifolds in stainless steel of at least grade 304, and NVIDIA’s GB300 NVL72 rack, liquid-cooled at up to 142 kW, made that loop standard in AI halls. Supplier order books show the shift: IMI reported GBP 18 million of data centre orders in 2025, more than double the GBP 7 million of 2024. Liquid cooling secondary loops and rack manifolds are the fastest system at 24.47% a year, and Asia Pacific is the fastest region at 15.91% a year as AI campuses in India, Japan and South Korea move to direct-to-chip cooling.
Key Market Statistics: How Big Is the Data Center Piping Market in 2026?
DC Market Insights values the Data Center Piping Market at USD 1.60 billion in 2026, 37.12% above the USD 1.17 billion of 2025, because new liquid-cooled AI capacity rises from 1.47 GW to 2.58 GW and the United States producer price index for steel pipe and tube rose 13.2% in the year to September 2026.
- Market size 2025: USD 1.17 billion; 2026: USD 1.60 billion; 2030: USD 3.36 billion; 2035: USD 4.50 billion.
- CAGR 2025-2035: 14.42% in the base case; the 2035 range runs from USD 3.32 billion (low, 11.00%) to USD 5.87 billion (high, 17.50%).
- Piping content per new MW in 2025: about USD 70,000 in an air-cooled chilled-water hall, USD 80,000 in an air-cooled AI hall and USD 190,000 in a liquid-cooled AI hall (DC Market Insights estimate).
- Largest system: chilled-water and condenser loops, USD 781.85 million or 66.8% of 2025 spend.
- Fastest system: liquid cooling secondary loops and rack manifolds, from USD 177.12 million in 2025 to USD 1.58 billion in 2035, 24.47% a year.
- Largest component: pipes, USD 448.71 million in 2025; valves and actuators follow with USD 282.00 million.
- Stainless steel grows 19.47% and thermoplastics 19.13% a year, against 10.34% for carbon steel and ductile iron.
- Leading region: North America, USD 491.59 million (42.0%) in 2025; fastest region: Asia Pacific, 15.91% a year.
- Largest country: United States, USD 442.43 million in 2025; fastest large country: India, 20.70% a year.
- Market leaders: Georg Fischer (GF), Victaulic, Belimo, Danfoss and IMI hold about 21% of 2025 spend (DC Market Insights estimate), so the market is fragmented.
How Has Data Center Piping Spending Changed Since 2020?
The Global Data Center Piping Market size was valued at USD 0.33 billion in 2020, reached USD 1.17 billion in 2025, and is anticipated to reach USD 4.50 billion by 2035, at a CAGR of 14.42% during the forecast period.
| Attribute | Details |
|---|---|
| Historical period | 2020-2024 |
| Base year | 2025 |
| Forecast period | 2026-2035 |
| Market size 2025 | USD 1.17 billion |
| Market size 2026 | USD 1.60 billion |
| CAGR 2025-2035 | 14.42% |
| Market size 2035 | USD 4.50 billion |
| CAGR 2020-2025 | 29.12% |
Spending grew 3.59 times between 2020 and 2025, 29.12% a year, because new data center capacity rose from 5.0 GW to 12.0 GW a year and the first liquid-cooled AI halls arrived with 2.7 times the piping of an air-cooled hall. Growth slows to 14.42% a year to 2035 as new capacity levels off near 27 GW a year, but the mix keeps moving toward liquid: liquid-cooled AI halls take 15.68 GW of new capacity in 2035 against 1.47 GW in 2025 in the DC Market Insights model, and those halls alone spend USD 2.90 billion on piping in 2035. The installed base adds a steady layer of valve, insulation and retrofit work, rising from USD 234.00 million in 2025 to USD 860.94 million in 2035.
What Does the Data Center Piping Market Include?
The market covers USD 1.17 billion of piping material bought for data center cooling water in 2025, valued at the price paid by the mechanical contractor, the cooling equipment maker or the operator, without installation labour.
Included
- Chilled-water and condenser loops: mains, risers and branch pipe between chillers, cooling towers and computer room air handlers (CRAH).
- Liquid cooling secondary loops: the TCS pipe from the coolant distribution unit (CDU) to the rack, row and rack manifolds, branch lines and valve trains.
- Heat rejection and glycol loops: pipe to dry coolers, adiabatic coolers and air-cooled condensers.
- Heat reuse export piping: pre-insulated pipe that carries waste heat to a district heating network or a nearby user.
- Components: pipes, fittings and grooved couplings, isolation, balancing and control valves with actuators, pipe insulation and pre-insulated pipe, and rack manifolds.
Excluded
- CDUs, chillers, pumps, cooling towers and cold plates, which DC Market Insights sizes in its equipment reports.
- Fire sprinkler pipe, fuel oil pipe for generators, office plumbing, and quick disconnect couplings inside the server.
- Installation labour, welding, flushing and commissioning services.
How Do the Piping Segments Add Up?
Each of the four segment views sums to USD 1.17 billion in 2025 and USD 4.50 billion in 2035: by system (four loops), by component (five groups), by material (four groups) and by data center type (four buyer groups). Regions and the top 12 countries are cut from the same total.
Why Do Data Center Piping Market Estimates Differ?
Public estimates for data center pipes range from well under USD 1 billion to more than USD 6 billion for 2025; DC Market Insights puts the 2026 market at USD 1.60 billion because it counts cooling-water piping material only.
Broader definitions add the CDU and pump skids that sit on the loop, installation labour (often larger than the material bill), sprinkler and fuel piping, plumbing and drainage, and electrical conduit. Narrower ones count only plastic pipe or only liquid cooling valves. The table shows what this estimate keeps and leaves out, with the 2025 value where it is in scope.
| Element | In this report | Why |
|---|---|---|
| Chilled-water, condenser and glycol pipe | Yes, USD 981.63 million | Core cooling-water distribution |
| TCS pipe, valve trains and rack manifolds | Yes, USD 177.12 million | Liquid cooling distribution to the rack |
| Heat reuse export pipe | Yes, USD 11.70 million | Required by heat reuse rules in Europe |
| CDUs, pumps, chillers | No | Equipment, sized in separate reports |
| Installation labour and flushing | No | Services, not material |
| Sprinkler, fuel and plumbing pipe | No | Not part of the cooling loop |
In prose: CDU skids, pump sets, chillers, installation labour, loop flushing services, sprinkler pipe, fuel pipe, plumbing and electrical conduit sit outside this estimate. In scope are all buyer groups: hyperscale and AI campuses, colocation operators, enterprise sites, small and medium enterprises (SMEs) running their own server rooms, and edge and telecom sites.
Market Drivers: What Is Pushing Data Center Piping Spend Up?
Three drivers lift piping spend from USD 1.17 billion in 2025 to USD 4.50 billion in 2035: the stainless-steel TCS loop in AI halls, heat reuse quotas in Europe and supplier capacity that is now sized for data center orders.
OCP Stainless-Steel TCS Loops Raise Piping per MW from USD 70,000 to USD 190,000
The OCP guideline for pre-commissioning TCS row manifolds, dated 27 January 2025, expects pipework in stainless steel of at least grade 304, welded to AWS D10.18, because cold plate channels of about 100 microns foul easily (Open Compute Project, January 2025). NVIDIA’s reference architecture, updated in September 2026, describes the GB300 NVL72 rack as liquid cooled at up to 142 kW. A hall built this way carries a facility water loop plus a TCS loop and manifolds, so DC Market Insights puts its piping at about USD 190,000 per MW in 2025, 2.7 times the USD 70,000 of an air-cooled chilled-water hall. Liquid-cooled halls spend USD 279.30 million in 2025 and USD 2.90 billion in 2035.
Germany’s 10% Heat Reuse Quota from 1 July 2026
Under section 11 of Germany’s Energy Efficiency Act (EnEfG), data centers starting operation from 1 July 2026 must reuse at least 10% of their energy, rising to 15% for starts from 1 July 2027 and 20% from 1 July 2028 (EnEfG section 11). The European Union Energy Efficiency Directive (EU) 2023/1791, Article 26, asks sites above 1 MW of rated energy input to use their waste heat unless it is not feasible. Each project needs pre-insulated export pipe to a heat network, so heat reuse export piping grows from USD 11.70 million in 2025 to USD 180.02 million in 2035, 31.44% a year.
Valve and Pipe Makers Report Data Center Orders Doubling
IMI reported GBP 18 million of data centre orders in 2025 against GBP 7 million in 2024 (IMI full-year results, March 2026). Belimo said data centers made up slightly less than half of its 23.3% sales growth in 2025, when sales reached CHF 1,120.8 million, and GF said its data center order intake doubled in the first half of 2026. DC Market Insights reads these as the valve and pipe share of AI hall budgets: valves and actuators grow from USD 282.00 million in 2025 to USD 1.02 billion in 2035.
Market Trends: How Is Data Center Piping Changing?
Three changes reshape the USD 1.60 billion market of 2026: polymer pipe inside the TCS loop, factory-built pipe modules and stricter loop cleanliness.
Polymer TCS Pipe Challenges Stainless Steel
GF launched LiquidCore in November 2025, a prefabricated system in polyvinylidene fluoride (PVDF) and polypropylene (PP-H) that runs from the CDU to the cold plate, and its Annual Report 2025 says demand for data center cooling solutions strongly increased. DC Market Insights expects thermoplastics to rise from 15% to 27% of TCS loop value by 2035, so plastic TCS spend climbs from USD 26.57 million to USD 427.00 million.
Factory-Built Pipe Modules Move Work off Site
Victaulic sells TCS equipment modules, liquid-to-rack header modules and branch line valve trains, and Vertiv launched MegaMod HDX in January 2026, a prefabricated power and liquid cooling pod of up to 10 MW. Kingspan said in its Annual Report 2025 that its Advnsys data center unit lifted its wallet share from under USD 100,000 to over USD 500,000 per MW and is adding plants in Arkansas and Kentucky with capacity for about USD 1 billion of revenue. Rack manifolds, mostly factory built, grow from USD 44.28 million to USD 395.37 million.
Loop Cleanliness Becomes a Purchase Criterion
The OCP guideline asks for flushing with filters from 100 down to 1 micron before servers connect, and Vertiv closed its purchase of PurgeRite, a flushing and filtration services firm, for about USD 1.0 billion in December 2025. Buyers now favour orbital-welded stainless pipe, press fittings under ASTM F3226 and pre-cleaned modules, which keeps stainless steel at 60% of TCS value in 2035 and lifts its total from USD 206.51 million to USD 1.22 billion.
Market Challenges: What Holds Data Center Piping Back?
Two challenges sit behind the low case of USD 3.32 billion in 2035, 3.42 points a year below the base case: metal tariffs and the risk of leaks near the rack.
A 50% United States Steel Tariff and 13.2% Pipe Inflation
Proclamation 10947 raised the Section 232 duty on steel and derivatives from 25% to 50% from 4 June 2025, and Proclamation 11021, published on 9 April 2026, set 50% on the full value of steel articles and certain derivatives (Federal Register, April 2026). The Bureau of Labor Statistics (BLS) producer price index for steel pipe and tube stood at 431.7 in September 2026, 13.2% above September 2025, and World Bank data show London Metal Exchange (LME) copper at USD 14,474 per tonne in September 2026, 46% above the 2025 average. DC Market Insights raises its piping price index from 1.00 in 2025 to 1.08 in 2026, which adds about USD 118.88 million to 2026 spend; projects that are priced late can be re-scoped or delayed.
Leak Risk Next to the Rack Slows Retrofits
A TCS loop puts water inside racks drawing up to 142 kW, so operators demand pressure testing, leak detection and flushing before they switch on. DC Market Insights limits liquid retrofits of existing halls to 0.5 GW in 2025 and 2.0 GW a year by 2035, which keeps retrofit piping at USD 60.00 million in 2025 and USD 268.80 million in 2035.
Market Opportunities: Where Is the New Piping Revenue to 2035?
Two pools add USD 1.61 billion between 2025 and 2035: TCS loops in new AI halls and liquid retrofits of existing halls.
TCS Loops and Rack Manifolds: USD 177.12 million to USD 1.58 billion
Every liquid-cooled rack needs a branch line, valves and a manifold, and the OCP stainless-steel specification favours suppliers who can weld, clean and test in a factory. TCS loops and rack manifolds grow 24.47% a year, the fastest system in the market, and reach 35.1% of total spend in 2035.
Liquid Retrofits of Existing Halls: USD 60.00 million to USD 268.80 million
Colocation operators converting air-cooled halls for AI tenants spend about USD 120,000 per MW on TCS pipe, manifolds and tie-ins in the DC Market Insights model. Retrofit piping grows from USD 60.00 million in 2025 to USD 268.80 million in 2035, and colocation as a buyer group reaches USD 1.26 billion by 2035.
Pricing: What Does Data Center Piping Cost per MW?
Piping cost about USD 70,000 per MW in an air-cooled chilled-water hall and USD 190,000 per MW in a liquid-cooled AI hall in 2025, and the price index stands at 1.08 in 2026 after the 2025-2026 metal inflation (DC Market Insights estimates).
| Year | Air-cooled chilled-water hall (per MW) | Air-cooled AI hall (per MW) | Liquid-cooled AI hall (per MW) | DX or air-side economiser hall (per MW) | Price index (2025 = 1.00) |
|---|---|---|---|---|---|
| 2020 | USD 59.5k | USD 68.0k | USD 170.0k | USD 12.8k | 0.85 |
| 2025 | USD 70.0k | USD 80.0k | USD 190.0k | USD 15.0k | 1.00 |
| 2030 | USD 76.3k | USD 87.2k | USD 190.8k | USD 16.4k | 1.09 |
| 2035 | USD 78.4k | USD 89.6k | USD 184.8k | USD 16.8k | 1.12 |
Public anchors back the index: the BLS steel pipe and tube index rose 10.0% during 2025 and 13.2% in the year to September 2026, and the United States Geological Survey (USGS) put the COMEX copper price at a record USD 4.80 per pound for 2025. Liquid hall content per MW falls in real terms from USD 190,000 to USD 165,000 by 2035 as manifolds and polymer pipe standardise, which offsets most of the price index rise.
Standards and Regulation: Which Rules Apply to Data Center Piping?
Seven codes and rules shape the USD 1.60 billion market of 2026, from welding and press-fitting standards to heat reuse law and tariffs.
- OCP guideline for pre-commissioning TCS row manifolds (January 2025): stainless steel of at least grade 304, flushing and filtration to 1 micron.
- AWS D10.18, the American Welding Society practice for welding stainless steel pipe, cited by OCP for TCS loops.
- ASTM F3226, the press-fitting standard that Viega cites for piping built to the American Society of Mechanical Engineers (ASME) codes B31.1, B31.3 and B31.9.
- DIN EN 50600-4-6, the energy reuse factor used by EnEfG section 11 to measure the 10%, 15% and 20% heat reuse shares.
- Directive (EU) 2023/1791, Article 12 (annual reporting for sites of 500 kW of IT load or more from 15 May 2024) and Article 26 (waste heat use above 1 MW).
- EnEfG section 11: power usage effectiveness (PUE) of 1.2 or less for new sites from 1 July 2026, and 1.5 from 2027 and 1.3 from 2030 for existing sites.
- Section 232 Proclamations 10947 (June 2025) and 11021 (April 2026): 50% duty on steel and certain derivatives entering the United States.
Market Segmentation: Which Data Center Piping Segment Is Largest?
Chilled-water and condenser loops are the largest system with USD 781.85 million in 2025, pipes the largest component with USD 448.71 million, and carbon steel the largest material with USD 675.39 million.
By System
Chilled-water and condenser loops still take 66.8% of 2025 spend, but TCS loops and rack manifolds grow 24.47% a year and heat reuse export piping 31.44% a year from a small base.
| System | 2025 (USD million) | Share 2025 | 2035 (USD million) | CAGR 2025-2035 |
|---|---|---|---|---|
| Chilled-Water and Condenser Loops | USD 781.85 million | 66.8% | USD 2,069.13 million | 10.22% |
| Liquid Cooling Secondary Loops and Rack Manifolds | USD 177.12 million | 15.1% | USD 1,581.47 million | 24.47% |
| Heat Rejection and Glycol Loops | USD 199.78 million | 17.1% | USD 669.95 million | 12.86% |
| Heat Reuse Export Piping | USD 11.70 million | 1.0% | USD 180.02 million | 31.44% |
By Component
Pipes lead with USD 448.71 million; rack manifolds grow fastest at 24.47% a year because each liquid-cooled rack row needs its own supply and return header.
| Component | 2025 (USD million) | Share 2025 | 2035 (USD million) | CAGR 2025-2035 |
|---|---|---|---|---|
| Pipes | USD 448.71 million | 38.3% | USD 1,615.08 million | 13.66% |
| Fittings and Grooved Couplings | USD 262.37 million | 22.4% | USD 964.28 million | 13.90% |
| Valves and Actuators | USD 282.00 million | 24.1% | USD 1,019.07 million | 13.71% |
| Insulation and Pre-Insulated Pipe | USD 133.09 million | 11.4% | USD 506.77 million | 14.31% |
| Rack Manifolds | USD 44.28 million | 3.8% | USD 395.37 million | 24.47% |
By Material
Carbon steel and ductile iron hold 57.7% of 2025 spend in chilled-water mains; stainless steel and thermoplastics gain USD 1.02 billion and USD 980.07 million by 2035 as TCS loops spread.
| Material | 2025 (USD million) | Share 2025 | 2035 (USD million) | CAGR 2025-2035 |
|---|---|---|---|---|
| Carbon Steel and Ductile Iron | USD 675.39 million | 57.7% | USD 1,807.43 million | 10.34% |
| Stainless Steel | USD 206.51 million | 17.6% | USD 1,222.79 million | 19.47% |
| Copper | USD 82.43 million | 7.0% | USD 284.16 million | 13.17% |
| Thermoplastics | USD 206.12 million | 17.6% | USD 1,186.19 million | 19.13% |
By Data Center Type
Hyperscale and AI campuses take USD 561.81 million or 48.0% of 2025 spend and grow 17.00% a year; enterprise sites grow 7.37% a year.
| Data center type | 2025 (USD million) | Share 2025 | 2035 (USD million) | CAGR 2025-2035 |
|---|---|---|---|---|
| Hyperscale and AI Campuses | USD 561.81 million | 48.0% | USD 2,700.34 million | 17.00% |
| Colocation | USD 351.14 million | 30.0% | USD 1,260.16 million | 13.63% |
| Enterprise | USD 198.98 million | 17.0% | USD 405.05 million | 7.37% |
| Edge and Telecom | USD 58.52 million | 5.0% | USD 135.02 million | 8.72% |
DC Exclusive: Pipe Material Switching Matrix, USD 206.12 million to USD 1.19 billion in Thermoplastics
This DC Market Insights model, built on 14 inputs, shows how the material mix of each loop shifts between 2025 and 2035 and how much money moves to thermoplastic pipe; carbon steel loses 57.7% to 40.2% of the market over the period.
| Loop | Carbon steel and ductile iron 2025 / 2035 | Stainless steel 2025 / 2035 | Copper 2025 / 2035 | Thermoplastics 2025 / 2035 | Thermoplastic value 2025 / 2035 |
|---|---|---|---|---|---|
| Chilled-Water and Condenser Loops | 70% / 62% | 8% / 10% | 7% / 6% | 15% / 22% | USD 117.28 million / USD 455.21 million |
| Liquid Cooling Secondary Loops and Rack Manifolds | 5% / 5% | 70% / 60% | 10% / 8% | 15% / 27% | USD 26.57 million / USD 427.00 million |
| Heat Rejection and Glycol Loops | 55% / 45% | 10% / 10% | 5% / 5% | 30% / 40% | USD 59.93 million / USD 267.98 million |
| Heat Reuse Export Piping | 80% / 80% | 0% / 0% | 0% / 0% | 20% / 20% | USD 2.34 million / USD 36.00 million |
Three switches stand out. In TCS loops, polymer systems such as GF LiquidCore take thermoplastics from 15% to 27% of value, while stainless steel falls from 70% to 60% but still triples in money terms. In heat rejection loops, polyethylene and polypropylene glycol mains rise from 30% to 40%, because outdoor dry cooler runs do not need fire-rated metal pipe. Chilled-water mains stay mostly steel, with grooved couplings from Victaulic and press fittings from Viega replacing welded joints on smaller sizes. Buyers who standardise on one TCS material per campus cut spare parts and flushing time.
Regional Insights: Which Region Spends the Most on Data Center Piping?
North America leads with USD 491.59 million or 42.0% of 2025 spend, and Asia Pacific grows fastest at 15.91% a year to USD 1.49 billion in 2035.
North America
North America spends USD 491.59 million in 2025 and USD 1.73 billion in 2035, 13.43% a year. United States data centers used 176 TWh in 2023, 4.4% of national electricity, according to the Department of Energy (DOE) and Lawrence Berkeley National Laboratory (LBNL), and supply is following: Perma-Pipe signed a long-term lease for a new production plant in Ohio aimed at AI data centers (Perma-Pipe, April 2026).
Europe
Europe spends USD 234.09 million in 2025 and USD 810.10 million in 2035, 13.22% a year, and holds most heat reuse export piping because of EnEfG section 11 and Article 26 of Directive (EU) 2023/1791. Germany is the largest European buyer with USD 49.16 million in 2025.
Asia Pacific
Asia Pacific spends USD 339.43 million in 2025 and USD 1.49 billion in 2035, 15.91% a year. GF supplied COOL-FIT pre-insulated pipe for the facility water loop of an NTT FACILITIES liquid cooling testbed in Japan in September 2025, and Belimo opened a data center experience centre in Singapore in the fourth quarter of 2025.
Latin America
Latin America spends USD 46.82 million in 2025 and USD 202.53 million in 2035, 15.77% a year, with most new halls still air-cooled on chilled water, which keeps piping content near USD 70,000 per MW.
Middle East and Africa
Middle East and Africa spends USD 58.52 million in 2025 and USD 270.03 million in 2035, 16.52% a year; Saudi Arabia grows 18.59% a year as AI campuses there are built liquid-ready from the start.
Country Analysis: Which Countries Buy the Most Data Center Piping?
The United States leads with USD 442.43 million in 2025, 37.8% of global spend, and India is the fastest large country at 20.70% a year.
| Rank | Country | Region | 2025 (USD million) | 2035 (USD million) | CAGR 2025-2035 |
|---|---|---|---|---|---|
| 1 | United States | North America | USD 442.43 million | USD 1,542.12 million | 13.30% |
| 2 | China | Asia Pacific | USD 135.77 million | USD 519.82 million | 14.37% |
| 3 | Germany | Europe | USD 49.16 million | USD 170.12 million | 13.22% |
| 4 | Japan | Asia Pacific | USD 47.52 million | USD 178.22 million | 14.13% |
| 5 | Canada | North America | USD 46.70 million | USD 190.60 million | 15.10% |
| 6 | United Kingdom | Europe | USD 39.80 million | USD 129.62 million | 12.53% |
| 7 | India | Asia Pacific | USD 33.94 million | USD 222.78 million | 20.70% |
| 8 | Australia | Asia Pacific | USD 30.55 million | USD 133.67 million | 15.91% |
| 9 | France | Europe | USD 25.75 million | USD 89.11 million | 13.22% |
| 10 | South Korea | Asia Pacific | USD 23.76 million | USD 103.96 million | 15.90% |
| 11 | Ireland | Europe | USD 23.41 million | USD 72.91 million | 12.03% |
| 12 | Saudi Arabia | Middle East and Africa | USD 15.22 million | USD 83.71 million | 18.59% |
India grows from USD 33.94 million to USD 222.78 million because most of its new hyperscale capacity after 2027 is planned for AI loads; China, the second-largest buyer with USD 135.77 million, grows 14.37% a year.
Forecast Scenarios: What Could the Data Center Piping Market Reach by 2035?
The base case reaches USD 4.50 billion in 2035; the low case USD 3.32 billion and the high case USD 5.87 billion.
| Scenario | 2035 (USD million) | CAGR 2025-2035 | Assumption |
|---|---|---|---|
| Low | USD 3,323.40 million | 11.00% | AI capacity slips two years, steel tariffs stay at 50%, liquid share of AI halls peaks at 70% |
| Base | USD 4,500.57 million | 14.42% | New capacity reaches 27 GW a year, 88% of new AI capacity liquid-cooled by 2035 |
| High | USD 5,871.26 million | 17.50% | Faster AI build-out, heat reuse rules copied outside Germany, broad liquid retrofits |
Competitive Insights: Who Are the Leading Data Center Piping Suppliers?
The five largest suppliers, GF, Victaulic, Belimo, Danfoss and IMI, hold about 21% of 2025 spend on the DC Market Insights estimate, built from their data center statements and segment sales; the rest is spread across regional pipe mills and valve makers.
- Georg Fischer (GF): COOL-FIT pre-insulated pipe and LiquidCore polymer TCS systems; its Industry and Infrastructure Flow Solutions division sold CHF 1,955 million in 2025.
- Victaulic: grooved couplings, TCS equipment modules and liquid-to-rack header modules.
- Belimo: valves and actuators; 2025 sales CHF 1,120.8 million.
- Danfoss: valves and the CoolTrain liquid cooling valve train; 2025 sales EUR 9.4 billion.
- IMI (IMI Hydronic Engineering): balancing and control valves; GBP 18 million of data centre orders in 2025.
- Watts Water Technologies: valves and hydronic products; 2025 sales USD 2.44 billion.
- Aalberts: press fittings and hydronic flow control; 2025 revenue EUR 3,091 million.
- Mueller Industries: copper tube and fittings; Piping Systems segment USD 2.71 billion in fiscal 2025.
- Viega: press fitting systems for chilled water and TCS loops.
- NIBCO: ball, butterfly, check and balancing valves for liquid cooling.
- Perma-Pipe International Holdings: pre-insulated pipe; fiscal 2025 net sales USD 210.9 million, up 33.1%.
- Kingspan (Advnsys): liquid cooling manifolds and containment.
- Armacell: flexible pipe insulation, including ArmaFlex Ultima.
- Aliaxis (IPEX): thermoplastic pipe systems; 2025 revenue EUR 3.5 billion.
- Schneider Electric (Motivair): TCS loops alongside CDUs.
- nVent: TCS manifolds and rack liquid cooling.
Company facts: Watts said in its 2025 annual report on Form 10-K that light industrial demand, including data centers, is growing; nVent leased a 117,000 square foot plant in Blaine, Minnesota, in September 2025 and a second 160,000 square foot site in July 2026 for liquid cooling production; Danfoss bought Hydro Holding, a hose fittings maker, which it says strengthens its data center position.
Recent Developments: What Changed in Data Center Piping Since 2025?
Six dated moves between September 2025 and October 2026 show suppliers adding TCS products and capacity.
- In September 2025, GF supplied COOL-FIT 2.0 and 4.0 pre-insulated pipe for the facility water loop of an NTT FACILITIES liquid cooling testbed (Source: GF).
- In November 2025, GF launched LiquidCore, a polymer piping system from the CDU to the cold plate (Source: GF).
- In December 2025, Vertiv completed its purchase of PurgeRite, a flushing, purging and filtration services firm, for about USD 1.0 billion (Source: Vertiv).
- In April 2026, Perma-Pipe reported fiscal 2025 net sales of USD 210.9 million and a new Ohio plant lease for AI data centers (Source: Perma-Pipe).
- In July 2026, GF reported that data center order intake doubled in the first half of 2026 (Source: GF).
- In October 2026, nVent and AMD showed cooling for the AMD Helios rack, including manifolds (Source: nVent).
Key Takeaways: What Should Data Center Piping Buyers Plan For?
- USD 190,000 per MW is the 2025 piping budget for a liquid-cooled AI hall, because the TCS loop and manifolds add about USD 110,000 to an air-cooled design.
- 24.47% a year is the TCS growth rate to 2035, because 88% of new AI capacity is liquid-cooled by then in the base case.
- USD 180.02 million of heat reuse export piping by 2035, because German and EU rules require waste heat use.
- 1.08 is the 2026 piping price index against 1.00 in 2025, because steel pipe prices rose 13.2% and copper 46%; buyers should lock pipe prices early.
Methodology: How Did DC Market Insights Size the Data Center Piping Market?
DC Market Insights built the USD 1.17 billion 2025 value bottom-up from 14 inputs: new IT capacity of 12.0 GW split into liquid AI (1.47 GW), air-cooled AI (2.73 GW) and other capacity (7.80 GW), each multiplied by piping content per MW, plus USD 234.00 million of replacement and retrofit spend on 116 GW of installed capacity.
- New capacity: liquid AI USD 279.30 million + air-cooled AI USD 218.40 million + chilled-water halls USD 409.50 million + DX halls USD 29.25 million = USD 936.45 million.
- Installed base: USD 1,500 per installed MW a year (USD 174.00 million) + 0.5 GW of liquid retrofits at USD 120,000 per MW (USD 60.00 million).
- Bound check 1 (ceiling): Kingspan reports over USD 500,000 per MW of data center wallet share for its whole package; DC Market Insights piping content tops out at USD 190,000 per MW.
- Bound check 2 (ceiling): Belimo (CHF 1,120.8 million), IMI, Danfoss and GF report data center demand as a minority of sales; the USD 1.17 billion total is well below their combined flow and valve revenue.
- Bound check 3 (floor): 12.0 GW of new capacity at a minimum of USD 30,000 of piping per MW gives USD 360 million, about a third of the estimate.
Segments, regions and countries sum to the total in every year, and CAGRs are computed from the end points. The full approach is described in the DC Market Insights research methodology. Related reports: the Data Center Liquid Cooling Market, the Data Center Chiller Market, the Data Center Leak Detection Market and the Data Center Water Treatment Market.
Table of contents
- 01Introduction
- 1.1Report Description
- 1.2Key Market Statistics, 2025, 2026, 2030 and 2035
- 02Executive Summary
- 2.1Market Snapshot, 2025, 2026 and 2035
- 2.2Market Size Chart, 2020-2035
- 03Market Scope
- 3.1Included
- 3.2Excluded
- 3.3How Do the Piping Segments Add Up?
- 04Why Market Estimates Differ
- 4.1Scope Table: In and Out of This Estimate
- 05Market Drivers
- 5.1OCP Stainless-Steel TCS Loops Raise Piping per MW from USD 70,000 to USD 190,000
- 5.2Germany's 10% Heat Reuse Quota from 1 July 2026
- 5.3Valve and Pipe Makers Report Data Center Orders Doubling
- 06Market Trends
- 6.1Polymer TCS Pipe Challenges Stainless Steel
- 6.2Factory-Built Pipe Modules Move Work off Site
- 6.3Loop Cleanliness Becomes a Purchase Criterion
- 07Market Challenges
- 7.1A 50% United States Steel Tariff and 13.2% Pipe Inflation
- 7.2Leak Risk Next to the Rack Slows Retrofits
- 08Market Opportunities
- 8.1TCS Loops and Rack Manifolds: USD 177.12 million to USD 1.58 billion
- 8.2Liquid Retrofits of Existing Halls: USD 60.00 million to USD 268.80 million
- 09Pricing Analysis
- 9.1Piping Content per MW by Hall Type, 2020-2035
- 9.2Price Index and Metal Price Anchors
- 10Standards and Regulation
- 10.1OCP TCS Row Manifold Guideline
- 10.2AWS D10.18
- 10.3ASTM F3226
- 10.4DIN EN 50600-4-6
- 10.5Directive (EU) 2023/1791
- 10.6EnEfG Section 11
- 10.7Section 232 Proclamations 10947 and 11021
- 11Market Segmentation
- 11.1By System
- 11.2Chilled-Water and Condenser Loops
- 11.3Liquid Cooling Secondary Loops and Rack Manifolds
- 11.4Heat Rejection and Glycol Loops
- 11.5Heat Reuse Export Piping
- 11.6By Component
- 11.7Pipes
- 11.8Fittings and Grooved Couplings
- 11.9Valves and Actuators
- 11.10Insulation and Pre-Insulated Pipe
- 11.11Rack Manifolds
- 11.12By Material
- 11.13Carbon Steel and Ductile Iron
- 11.14Stainless Steel
- 11.15Copper
- 11.16Thermoplastics
- 11.17By Data Center Type
- 11.18Hyperscale and AI Campuses
- 11.19Colocation
- 11.20Enterprise
- 11.21Edge and Telecom
- 12DC Exclusive: Pipe Material Switching Matrix
- 12.1Chilled-Water and Condenser Loops
- 12.2Liquid Cooling Secondary Loops and Rack Manifolds
- 12.3Heat Rejection and Glycol Loops
- 12.4Heat Reuse Export Piping
- 13Regional Insights
- 13.1North America
- 13.2Europe
- 13.3Asia Pacific
- 13.4Latin America
- 13.5Middle East and Africa
- 14Country Analysis
- 14.1United States
- 14.2China
- 14.3Germany
- 14.4Japan
- 14.5Canada
- 14.6United Kingdom
- 14.7India
- 14.8Australia
- 14.9France
- 14.10South Korea
- 14.11Ireland
- 14.12Saudi Arabia
- 15Forecast Scenarios, 2035
- 15.1Low Scenario
- 15.2Base Scenario
- 15.3High Scenario
- 16Competitive Insights
- 16.1Georg Fischer (GF)
- 16.2Victaulic
- 16.3Belimo
- 16.4Danfoss
- 16.5IMI (IMI Hydronic Engineering)
- 16.6Watts Water Technologies
- 16.7Aalberts
- 16.8Mueller Industries
- 16.9Viega
- 16.10NIBCO
- 16.11Perma-Pipe International Holdings
- 16.12Kingspan (Advnsys)
- 16.13Armacell
- 16.14Aliaxis (IPEX)
- 16.15Schneider Electric (Motivair)
- 16.16nVent
- 17Recent Developments
- 17.1GF NTT FACILITIES Testbed, September 2025
- 17.2GF LiquidCore Launch, November 2025
- 17.3Vertiv PurgeRite Acquisition, December 2025
- 17.4Perma-Pipe Ohio Plant, April 2026
- 17.5GF Data Center Orders Double, July 2026
- 17.6nVent and AMD Helios Cooling, October 2026
- 18Key Takeaways
- 18.1Piping Budget per Liquid-Cooled MW
- 18.2TCS Growth to 2035
- 18.3Heat Reuse Export Piping by 2035
- 18.42026 Price Index
- 19Research Methodology
- 19.1Model Inputs
- 19.2Bound Checks
- Fig. 1Data Center Piping Market Size, 2020-2035 (USD million)
- Table 1Market Snapshot, 2025, 2026 and 2035
- Table 2Scope Table: In and Out of This Estimate
- Table 3Piping Content per MW by Hall Type, 2020-2035
- Table 4Market by System, 2025 and 2035
- Table 5Market by Component, 2025 and 2035
- Table 6Market by Material, 2025 and 2035
- Table 7Market by Data Center Type, 2025 and 2035
- Table 8Pipe Material Switching Matrix, 2025 and 2035
- Table 9Top 12 Countries, 2025 and 2035
- Table 102035 Forecast Scenarios
About this report
Written by Amit Jain and reviewed by Deepti Agrawal, Senior Editor, Research. Figures are built top-down and bottom-up and reconciled before publication, with 2025 as the base year.
Read our methodologyHow we built this
- Historical period2020-2024
- Base year2025
- Forecast period2026-2035
- Sizing approachTop-down + bottom-up
Need more than the report?
Advisory on this market
Due diligence, site selection and market entry work, by the analysts who wrote this report.
See consulting servicesFrequently asked questions
USD 1.60 billion in 2026, up 37.12% from USD 1.17 billion in 2025, according to DC Market Insights estimates. The market is projected to reach USD 4.50 billion by 2035, a CAGR of 14.42% from 2025.
14.42% a year from 2025 to 2035, after 29.12% a year from 2020 to 2025, because liquid-cooled AI halls need about USD 190,000 of piping per MW against USD 70,000 in an air-cooled hall.
About USD 190,000 of pipe, fittings, valves, insulation and rack manifolds per MW in 2025, 2.7 times an air-cooled chilled-water hall, because a technology cooling system loop runs to every rack (DC Market Insights estimate).
Stainless steel holds about 70% of 2025 TCS loop value; the Open Compute Project expects grade 304 or better. Polymer systems such as GF LiquidCore lift thermoplastics from 15% to 27% of TCS value by 2035.
Chilled-water and condenser loops, with USD 781.85 million or 66.8% of 2025 spend. TCS loops and rack manifolds grow fastest, from USD 177.12 million to USD 1.58 billion by 2035.
Germany requires new data centers from 1 July 2026 to reuse at least 10% of their energy, rising to 20% for 2028 starts. Heat reuse export piping grows from USD 11.70 million to USD 180.02 million by 2035.
The United States steel duty has been 50% since 4 June 2025, and the steel pipe and tube price index rose 13.2% in the year to September 2026. DC Market Insights lifts its 2026 piping price index to 1.08.
North America, with USD 491.59 million or 42.0% of 2025 spend. Asia Pacific grows fastest at 15.91% a year, and India is the fastest large country at 20.70% a year.
GF, Victaulic, Belimo, Danfoss and IMI hold about 21% of 2025 spend (DC Market Insights estimate). IMI’s data centre orders reached GBP 18 million in 2025, up from GBP 7 million in 2024.
USD 1.60 billion in 2026 is the DC Market Insights value of cooling-water piping material alone. Estimates that add CDU and pump skids, installation labour, sprinkler, fuel and plumbing pipe come out several times larger.
Licences, delivery and payment
Which licence should I choose?
Single User is a view-only PDF for one person. Multi User adds a printable PDF and the Excel data for unlimited users at one location. Enterprise covers your whole company and includes 100 free analyst hours.
How and when will I receive the report?
By email, within 24–48 business hours of payment, in the formats of your licence.
How can I pay?
Securely through PayPal: with a PayPal account, a debit or credit card, or PayPal Pay Later where available. Prices are in US dollars.
Can I see a sample first?
Yes. Request a free sample and we will email it to you.
Can the report be tailored to my needs?
Yes. We can add countries, segments or data cuts. Talk to an analyst about the scope you need.
Can I get an invoice or pay against a purchase order?
Write to sales@dcmarketinsights.com and our team will help.