
Data Center Real Estate Market Size, Share & Forecast to 2035
Market at a glance
The Data Center Real Estate market was worth USD 40.33 billion in 2025 and is forecast to reach USD 105.38 billion by 2035, growing at a 10.08% CAGR.
 By Amit Jain, Senior Consultant, ICT & Emerging Technologies
 Reviewed by Deepti Agrawal
Last updated 4 Nov 2026
Base year 2025 PDF + Excel
Key findings
Microsoft, Meta and Alphabet Hold USD 850.8 Billion of Leases Not Yet Commenced
Prologis Converts Logistics Land Into Energy-Ready Data Center Sites
Loudoun Ended By-Right Approval and Paused New Applications
Secondary U.S. Metros Worth USD 13.69 billion by 2035
What is inside the report
- 01Introduction
- 02Executive Summary
- 03Market Scope
- 04Market Dynamics
- 05Pricing Analysis
- 06Standards and Regulation
- 07Market Segmentation by Component
- 08Market Segmentation by Developer Type
- 09Market Segmentation by Campus Size
- 10Market Segmentation by Tenure Model
- 16chapters
- 2020-2024Historical period
- 2026-2035Forecast period
- 17Companies profiled
Segmentation
Companies profiled
- Digital Realty
- Equinix
- Prologis
- QTS Data Centers
- Vantage Data Centers
- STACK Infrastructure
- CyrusOne
- Aligned Data Centers
- EdgeConneX
- Compass Datacenters
- Iron Mountain Data Centers
- NTT DATA
- AirTrunk
- Microsoft
- Amazon Web Services
- Alphabet
- Meta
Recent developments
Loudoun County made data centers a conditional use requiring a special exception (Source: Loudoun County).
Ireland's Commission for Regulation of Utilities set its new connection policy for data centres (Source: CRU).
IMDA and the Economic Development Board launched Singapore's second call for application for at least 200 MW (Source: IMDA).
the Virginia Court of Appeals voided the Prince William Digital Gateway rezonings covering 2,139 acres (Source: Prince William County).
the Loudoun Board of Supervisors paused certain legislative applications for data centers and substations (Source: Loudoun County).
Digital Realty reported USD 802.8 million of acquisitions, mainly land, and 1,464 MW underway (Source: Digital Realty quarterly report).
the U.S. Census Bureau put September private data center construction at a USD 96.46 billion annual rate (Source: U.S. Census Bureau).
Full analysis
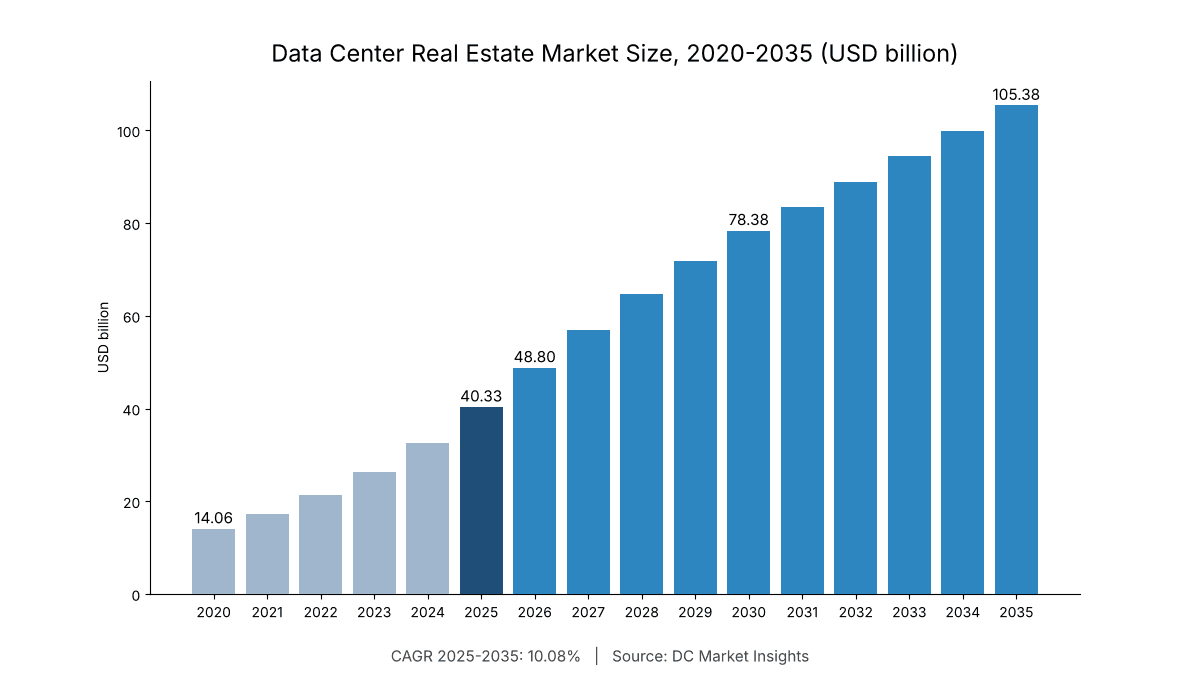
The Data Center Real Estate Market is valued at USD 48.80 billion in 2026 and is projected to reach USD 105.38 billion by 2035, up from USD 40.33 billion in 2025, a CAGR of 10.08% from 2025 to 2035 (DC Market Insights estimate). The money in this market moves with powered land: a site is only worth building on once a utility has promised megawatts, so developers now buy ground two years ahead of the halls it will carry, and Digital Realty alone lifted its land held for future development from USD 91.1 million at the end of 2025 to USD 769.4 million by 30 September 2026, according to its quarterly filing. County rules decide where that land can be used: Loudoun County in Virginia, home to about 56.5 million square feet of data center space, ended by-right approval in March 2025 and paused new legislative applications in September 2026, which pushes buyers toward secondary metros and campuses above 200 MW. The 2025 receipt is 13,250 MW of IT capacity under active construction × USD 2.60 million per MW for shell, site works and development = USD 34.45 billion, plus 16,800 MW of land banked for 2027 deliveries × USD 0.35 million per MW = USD 5.88 billion. Campuses above 200 MW grow fastest at 13.90% a year, and the Middle East and Africa is the fastest region at 15.85% a year as Gulf sovereign programmes buy powered land in Saudi Arabia and the United Arab Emirates.
Key Market Statistics: How Big Is the Data Center Real Estate Market in 2026?
The Data Center Real Estate Market reaches USD 48.80 billion in 2026, 21.00% above the USD 40.33 billion spent in 2025, according to DC Market Insights estimates.
- Market size 2025: USD 40.33 billion
- Market size 2026: USD 48.80 billion
- Market size 2030: USD 78.38 billion
- Market size 2035: USD 105.38 billion
- CAGR 2025-2035: 10.08% (low case 7.65%, high case 12.29%)
- Largest component: Shell and Core Construction, USD 25.18 billion or 62.4% of 2025 value
- Fastest segment: Campuses above 200 MW, 13.90% a year
- Leading region: North America, 47.0% of 2025 value; fastest region Middle East and Africa at 15.85%
- Largest country: United States, USD 16.54 billion in 2025
- Largest developer group: hyperscale self-build programmes of Microsoft, Amazon, Alphabet and Meta, about 46% of 2025 value (DC Market Insights estimate)
Key Takeaways: What Drives Data Center Real Estate Spend?
- Powered land is the scarce input, because utilities ration connections: land spend rises from USD 5.88 billion in 2025 to USD 14.40 billion by 2035.
- Shell and core takes 62.4% of the Data Center Real Estate Market because every MW of IT needs about 6,000 to 8,000 square feet of building (DC Market Insights estimate), priced at USD 1.90 million per MW in 2025.
- Leases do the financing, because hyperscalers sign 15 to 30-year leases: Microsoft, Meta and Alphabet report USD 850.8 billion of data center and related leases not yet commenced.
- Zoning now sets location, because Loudoun, Prince William and Phoenix tightened rules: sites below 50 MW shrink from 26.0% to 17.0% of value.
Executive Summary: What Is the Data Center Real Estate Market Worth?
The Global Data Center Real Estate Market size was valued at USD 14.06 billion in 2020, reached USD 40.33 billion in 2025, and is anticipated to reach USD 105.38 billion by 2035, at a CAGR of 10.08% during the forecast period.
| Attribute | Value |
|---|---|
| Historical period | 2020-2024 |
| Base year | 2025 |
| Forecast period | 2026-2035 |
| Market size 2025 | USD 40.33 billion |
| Market size 2026 | USD 48.80 billion |
| CAGR 2025-2035 | 10.08% |
| Market size 2035 | USD 105.38 billion |
| Unit | USD million, current prices |
Growth in the Data Center Real Estate Market averaged 23.46% a year from 2020 to 2025, as new IT capacity under construction rose from about 5.4 GW to 13.3 GW and land prices per MW climbed with the premium for sites that already hold a grid connection. From 2026 the pace slows to 10.08% a year because annual completions flatten near 27 GW by 2035 and land is bought on fewer, larger campuses; the U.S. Census Bureau construction spending release shows the U.S. side of this build still accelerating, with private data center construction at a seasonally adjusted annual rate of USD 96.46 billion in September 2026, 90.3% above September 2025.
What Does the Data Center Real Estate Market Include?
The Data Center Real Estate Market covers USD 40.33 billion of 2025 spending on the property layer of data centers: land and powered land, the shell-and-core building, site and utility enabling works, and development and entitlement services.
Included
- Land and powered land acquisition for data center campuses, including land banked for deliveries up to two years ahead
- Shell and core construction: structure, envelope, roof, slabs, base-building architecture and office or support areas
- Site and utility enabling works: grading, roads, stormwater, water and fibre duct banks, utility easements
- Development and entitlement services: rezoning, special exception and permit work, development management and fees on build-to-suit and powered-shell projects
Excluded
- Mechanical, electrical and plumbing fit-out (power, cooling, fire, racks), covered in infrastructure reports
- IT hardware, colocation rent, power purchase and operating costs
- Acquisitions of operating platforms and stabilised buildings (transfers of existing assets, not new spend)
- Transmission lines and utility substations, covered in the Data Center Grid Infrastructure Interconnection Market
How the segments fit together
Each segment dimension of the Data Center Real Estate Market sums to the same USD 40.33 billion total in 2025: the component view splits it by what is bought, the developer view by who buys it, the campus-size view by project scale and the tenure view by how the land is held.
Why Do Data Center Real Estate Market Estimates Differ?
Estimates of the Data Center Real Estate Market differ because some count rent and asset value, while the DC Market Insights figure of USD 48.80 billion for 2026 counts only new spend on land, shells, site works and development.
Broader definitions add the full turnkey construction value including mechanical and electrical systems, the annual rental revenue of data center REITs and colocation providers, and the transaction value of operating portfolios that change hands, such as platform takeovers and sale-leasebacks of existing buildings. These items describe the stock of data center property or its income, not the yearly spend on new real estate, so they are left out here; adding them raises a headline figure by several times. Smaller buyers sit inside the scope: enterprise and public-sector owners, regional developers and edge operators building sites below 50 MW.
| Element | Counted here | Why |
|---|---|---|
| Land and powered land | Yes, USD 5.88 billion | New acquisition spend |
| Shell and core | Yes, USD 25.18 billion | Building layer of new capacity |
| Site and utility enabling works | Yes, USD 5.96 billion | Civil works tied to the site |
| MEP fit-out | No | Infrastructure, not property |
| Colocation rent | No | Income, covered in colocation reports |
| Platform acquisitions | No | Transfer of existing assets |
Market Drivers: Why Is Data Center Real Estate Spend Rising?
Three forces add USD 38.05 billion to the Data Center Real Estate Market between 2025 and 2030: hyperscaler lease commitments, land banking by developers and the shift of new halls to large campuses.
Microsoft, Meta and Alphabet Hold USD 850.8 Billion of Leases Not Yet Commenced
According to the Microsoft quarterly report for the period ended 30 September 2026, the company had USD 364.6 billion of additional leases, primarily for datacenters, that had not yet commenced, starting between fiscal 2027 and fiscal 2034. Meta reported about USD 355.73 billion of such commitments and Alphabet USD 130.5 billion in their filings for the same quarter. Each lease needs a shell, land and site works built by a developer before it starts, which is why wholesale and build-to-suit developers grow at 11.04% a year in this market.
Developers Bank Land Two Years Ahead of Delivery
The Digital Realty quarterly report shows land held for future development rising more than eightfold in nine months to USD 769.4 million, with about USD 802.8 million of acquisitions in the third quarter of 2026, mostly land in Charlotte, Chicago and Indianapolis, and 1,464 MW of projects underway. DC Market Insights models land purchases at the capacity delivered two years later, so land spend reaches USD 6.91 billion in 2026.
Microsoft Lifted Quarterly Property Additions to USD 39.37 Billion
Microsoft’s additions to property and equipment reached USD 39.37 billion in the July to September 2026 quarter, against USD 19.39 billion a year earlier, while its land on the balance sheet stood at USD 10.67 billion and buildings and improvements at USD 194.62 billion (Source: Microsoft quarterly report). Hyperscale self-build accounts for USD 18.55 billion of the Data Center Real Estate Market in 2025.
Market Trends: How Are Data Center Sites Changing?
Two trends reshape the Data Center Real Estate Market: logistics land turning into energy-ready data center sites, and campuses above 200 MW taking 45.0% of value by 2035.
Prologis Converts Logistics Land Into Energy-Ready Data Center Sites
Prologis reported USD 2.6 billion of total expected investment in data centers with 680 MW of power capacity in its development portfolio, about USD 3.82 million per MW, and a land bank that could support USD 34.9 billion of investment (Source: Prologis quarterly report, October 2026). Powered shell and sale-leaseback structures grow at 11.79% a year in this market as more owners build the shell and hand the fit-out to the tenant.
Campuses Above 200 MW Grow at 13.90% a Year
The Prince William Digital Gateway plan alone covers 194 parcels and 2,139 acres, according to Prince William County. Large tracts lower the land cost per MW and spread road and utility works over more halls, so campuses above 200 MW rise from USD 12.91 billion in 2025 to USD 47.42 billion by 2035.
Market Challenges: What Slows Data Center Land Deals?
Zoning pauses and grid rules hold back part of the Data Center Real Estate Market; DC Market Insights estimates that about 8% of planned 2026 U.S. land spend faces approval delays.
Loudoun Ended By-Right Approval and Paused New Applications
Under the Loudoun County land-use page, data centers became a conditional use that requires an approved special exception from the Board of Supervisors on 18 March 2025, and on 16 September 2026 the Board enacted a temporary pause on certain legislative applications for data centers and substations, with the next phase of standards work due in 2027 (Source: Loudoun County statement). Loudoun still collected USD 1.2 billion in data center property tax in fiscal 2026, so the county limits new sites rather than the existing stock.
Courts and Grid Regulators Add Risk to Entitled Land
On 29 July 2026 the Virginia Court of Appeals found the Prince William Digital Gateway rezonings void, leaving 2,139 acres without valid zoning while the 2022 plan amendment stands (Source: Prince William County). In Ireland, the Commission for Regulation of Utilities decided on 12 December 2025 that new data centres must bring onsite or nearby generation or storage that matches their maximum import capacity, which adds land and cost to each Irish site.
Market Opportunities: Where Is the Next Data Center Land Value?
Two opportunities in the Data Center Real Estate Market together reach USD 22.97 billion by 2035: secondary U.S. metros with power, and Saudi and Indian campuses.
Secondary U.S. Metros Worth USD 13.69 billion by 2035
DC Market Insights estimates that 38% of U.S. data center real estate spend in 2035, or USD 13.69 billion, falls outside Northern Virginia, Dallas, Phoenix and Chicago, as land buyers follow the utility queues to markets such as Charlotte and Indianapolis named in the Digital Realty filing.
Saudi Arabia and India Add USD 7.40 billion
Saudi Arabia grows at 17.98% a year, from USD 483.96 million in 2025 to USD 2.53 billion by 2035, and India at 17.10% a year to USD 6.74 billion, the two fastest of the top 12 countries in the Data Center Real Estate Market, as state land allocations and data center park policies supply large plots at low cost per MW.
Pricing: What Does Data Center Real Estate Cost per MW?
The property layer of a data center costs about USD 2.95 million per MW of IT capacity in 2025, the DC Market Insights global blend, rising to USD 3.83 million by 2035.
| Cost line (USD million per MW) | 2020 | 2025 | 2030 | 2035 |
|---|---|---|---|---|
| Land and powered land | 0.27 | 0.35 | 0.45 | 0.51 |
| Shell and core | 1.64 | 1.90 | 2.20 | 2.43 |
| Site and utility enabling works | 0.39 | 0.45 | 0.52 | 0.58 |
| Development and entitlement | 0.22 | 0.25 | 0.28 | 0.31 |
| Total property layer | 2.52 | 2.95 | 3.45 | 3.83 |
Public anchors support these values: Prologis data center investment works out at about USD 3.82 million per MW for energy-ready developments that also carry part of the power works (Source: Prologis quarterly report), and Digital Realty reports an estimated stabilised cash yield of about 11.6% on its projects underway (Source: Digital Realty quarterly report). Land prices rise faster than building costs, at 5% a year to 2030, because grid-connected acreage is scarce in every major hub.
Standards and Regulation: Which Rules Shape Data Center Land Use?
Six land-use and grid rules affect where about 65% of Data Center Real Estate Market spend can go in 2025.
- Loudoun County, Virginia: special exception required since 18 March 2025; pause on legislative applications from 16 September 2026 (Source: Loudoun County).
- Prince William County, Virginia: Digital Gateway Comprehensive Plan Amendment, Resolution 22-508 of 1 November 2022; rezonings voided by the Court of Appeals on 29 July 2026 (Source: Prince William County).
- City of Phoenix: zoning text amendment Z-TA-2-25-Y would allow data centers only in C-2, C-3, CP/GCP, A-1 and A-2 districts with a Special Permit and at least 2,640 feet from high-capacity transit (Source: City of Phoenix staff report, May 2025).
- Ireland: Commission for Regulation of Utilities connection policy for data centres, 12 December 2025, with onsite or local generation and a six-year renewable glide path (Source: CRU).
- Singapore: Infocomm Media Development Authority (IMDA) and Economic Development Board Data Centre Call for Application 2 offering at least 200 MW, launched 1 December 2025, closed 31 March 2026 (Source: IMDA call for application).
- Ireland statistics: data centres used 23% of metered electricity in 2025, up from 5% in 2015 (Source: Central Statistics Office, July 2026).
Market Segmentation: Which Segments Lead the Data Center Real Estate Market?
Shell and Core Construction leads the Data Center Real Estate Market with 62.4% of 2025 value, and Campuses above 200 MW grow fastest at 13.90% a year.
Data Center Real Estate Market by Component
Shell and Core Construction is the largest component of the Data Center Real Estate Market at USD 25.18 billion, and Land and Powered Land Acquisition reaches USD 14.40 billion by 2035.
| Segment | 2025 (USD million) | Share 2025 | 2035 (USD million) | CAGR 2025-2035 |
|---|---|---|---|---|
| Land and Powered Land Acquisition | 5,880.00 | 14.6% | 14,403.85 | 9.37% |
| Shell and Core Construction | 25,175.00 | 62.4% | 66,633.27 | 10.22% |
| Site and Utility Enabling Works | 5,962.50 | 14.8% | 15,781.56 | 10.22% |
| Development and Entitlement Services | 3,312.50 | 8.2% | 8,556.79 | 9.96% |
Data Center Real Estate Market by Developer Type
Hyperscale Self-Build leads with USD 18.55 billion in 2025, and Wholesale and Build-to-Suit Developers grow fastest at 11.04% a year as leases replace owned builds.
| Segment | 2025 (USD million) | Share 2025 | 2035 (USD million) | CAGR 2025-2035 |
|---|---|---|---|---|
| Hyperscale Self-Build | 18,551.80 | 46.0% | 49,526.48 | 10.32% |
| Wholesale and Build-to-Suit Developers | 13,308.90 | 33.0% | 37,935.17 | 11.04% |
| Retail Colocation Operators | 5,242.90 | 13.0% | 10,537.55 | 7.23% |
| Enterprise and Public Sector | 3,226.40 | 8.0% | 7,376.28 | 8.62% |
Data Center Real Estate Market by Campus Size
Campuses of 50 to 200 MW lead in 2025 with USD 16.94 billion, while Campuses above 200 MW take the lead by 2035 at USD 47.42 billion.
| Segment | 2025 (USD million) | Share 2025 | 2035 (USD million) | CAGR 2025-2035 |
|---|---|---|---|---|
| Campuses above 200 MW | 12,905.60 | 32.0% | 47,418.97 | 13.90% |
| Campuses of 50 to 200 MW | 16,938.60 | 42.0% | 40,042.68 | 8.98% |
| Sites below 50 MW | 10,485.80 | 26.0% | 17,913.83 | 5.50% |
Data Center Real Estate Market by Tenure Model
Owner-Developed Freehold holds 55.0% of 2025 value, and Powered Shell and Sale-Leaseback grows fastest at 11.79% a year.
| Segment | 2025 (USD million) | Share 2025 | 2035 (USD million) | CAGR 2025-2035 |
|---|---|---|---|---|
| Owner-Developed Freehold | 22,181.50 | 55.0% | 50,580.23 | 8.59% |
| Powered Shell and Sale-Leaseback | 12,099.00 | 30.0% | 36,881.42 | 11.79% |
| Ground Lease | 6,049.50 | 15.0% | 17,913.83 | 11.47% |
DC Exclusive: The Hyperscaler Lease Backlog Ledger, USD 850.8 Billion Not Yet Commenced
The DC Market Insights Hyperscaler Lease Backlog Ledger is a DC Market Insights model built on 9 inputs from company filings; it shows that USD 850.8 billion of data center and related leases signed by three hyperscalers had not started by 30 September 2026, the forward order book for the Data Center Real Estate Market.
| Company | Leases not yet commenced (USD billion) | Start window | Land on balance sheet (USD billion) | Buildings (USD billion) |
|---|---|---|---|---|
| Microsoft | 364.60 | FY2027-FY2034 | 10.67 | 194.62 |
| Meta | 355.73 | 2026-2036 | 3.76 | 68.22 |
| Alphabet | 130.50 | 2026-2031 | n/a | n/a |
| Total | 850.83 | 2026-2036 | 14.43 | 262.84 |
Reading the ledger: if 25% of these future payments relate to the property layer and they start evenly over eight years, they imply about USD 26.6 billion a year of leased real estate demand, about twice the USD 13.31 billion that wholesale and build-to-suit developers spent in 2025 in this model, so the backlog covers the forecast growth of that segment. Meta’s construction in progress rose from USD 50.52 billion at the end of 2025 to USD 89.50 billion by 30 September 2026 (Source: Meta quarterly report).
Regional Insights: Which Region Leads the Data Center Real Estate Market?
North America leads the Data Center Real Estate Market with 47.0% of 2025 value, or USD 18.96 billion, and the Middle East and Africa grows fastest at 15.85% a year.
| Region | 2025 (USD million) | Share 2025 | 2035 (USD million) | CAGR 2025-2035 |
|---|---|---|---|---|
| North America | 18,955.10 | 47.0% | 42,150.19 | 8.32% |
| Asia Pacific | 10,889.10 | 27.0% | 33,720.15 | 11.97% |
| Europe | 7,259.40 | 18.0% | 16,860.08 | 8.79% |
| Latin America | 1,653.53 | 4.1% | 5,795.65 | 13.36% |
| Middle East and Africa | 1,572.87 | 3.9% | 6,849.41 | 15.85% |
North America Data Center Real Estate Market
North America spends USD 18.96 billion in 2025; the U.S. Census Bureau recorded USD 49.74 billion of private data center construction in 2025, up from USD 34.80 billion in 2024.
Asia Pacific Data Center Real Estate Market
Asia Pacific reaches USD 33.72 billion by 2035 at 11.97% a year, led by China, Japan and India, while Singapore releases land and power through IMDA calls of at least 200 MW.
Europe Data Center Real Estate Market
Europe spends USD 7.26 billion in 2025; grid limits in Dublin and Frankfurt move land buyers to the Nordics, Spain and Italy, and Ireland’s data centres already use 23% of metered electricity.
Latin America Data Center Real Estate Market
Latin America grows at 13.36% a year to USD 5.80 billion, with Brazil the largest country at USD 766.27 million in 2025.
Middle East and Africa Data Center Real Estate Market
The Middle East and Africa grows fastest at 15.85% a year, from USD 1.57 billion in 2025, as Saudi Arabia and the United Arab Emirates allocate state land for gigawatt campuses.
Country Analysis: Which Countries Spend Most on Data Center Real Estate?
The United States is the largest country in the Data Center Real Estate Market at USD 16.54 billion in 2025, and Saudi Arabia grows fastest among the top 12 at 17.98% a year.
| Rank | Country | Region | 2025 (USD million) | 2035 (USD million) | CAGR 2025-2035 |
|---|---|---|---|---|---|
| 1 | United States | North America | 16,535.30 | 36,038.41 | 8.10% |
| 2 | China | Asia Pacific | 4,234.65 | 11,591.30 | 10.59% |
| 3 | Japan | Asia Pacific | 1,451.88 | 3,793.52 | 10.08% |
| 4 | Germany | Europe | 1,411.55 | 3,161.26 | 8.40% |
| 5 | India | Asia Pacific | 1,391.38 | 6,744.03 | 17.10% |
| 6 | United Kingdom | Europe | 1,371.22 | 3,055.89 | 8.34% |
| 7 | Canada | North America | 1,088.91 | 2,739.76 | 9.67% |
| 8 | Australia | Asia Pacific | 1,048.58 | 3,055.89 | 11.29% |
| 9 | Malaysia | Asia Pacific | 1,008.25 | 2,634.39 | 10.08% |
| 10 | France | Europe | 846.93 | 2,107.51 | 9.54% |
| 11 | Brazil | Latin America | 766.27 | 2,529.01 | 12.68% |
| 12 | Saudi Arabia | Middle East and Africa | 483.96 | 2,529.01 | 17.98% |
India is the fastest-growing large country at 17.10% a year, rising from USD 1.39 billion in 2025 to USD 6.74 billion by 2035, because state data center park policies offer land at concessional rates and capacity under construction grows from a small base.
Forecast Scenarios: How Large Could the Data Center Real Estate Market Be by 2035?
Forecast scenarios for the Data Center Real Estate Market range from USD 84.30 billion to USD 128.56 billion by 2035 around the base case of USD 105.38 billion.
| Scenario | 2035 (USD million) | CAGR 2025-2035 | Assumption |
|---|---|---|---|
| Low | 84,300.38 | 7.65% | Zoning pauses spread and completions stall near 22 GW a year |
| Base | 105,375.48 | 10.08% | Completions reach 27 GW in 2035; land up 5% a year to 2030 |
| High | 128,558.09 | 12.29% | Lease backlog starts on time and land prices rise 8% a year |
Competitive Insights: Who Are the Key Players in the Data Center Real Estate Market?
The five largest developers, Digital Realty, Equinix, Prologis, QTS and Vantage Data Centers, hold about 24% of the Data Center Real Estate Market in 2025 (DC Market Insights estimate based on disclosed MW under construction and land held), while hyperscalers that build for themselves spend about 46%.
- Digital Realty
- Equinix
- Prologis
- QTS Data Centers
- Vantage Data Centers
- STACK Infrastructure
- CyrusOne
- Aligned Data Centers
- EdgeConneX
- Compass Datacenters
- Iron Mountain Data Centers
- NTT DATA
- AirTrunk
- Microsoft
- Amazon Web Services
- Alphabet
- Meta
Digital Realty had 1,464 MW of projects underway, about 90% more than at the end of 2025, 63% of them pre-leased, and more than eight gigawatts of further development capacity (Source: Digital Realty quarterly report, October 2026). Prologis carries 680 MW of data center developments in a USD 6.1 billion development portfolio (Source: Prologis quarterly report).
Recent Developments in the Data Center Real Estate Market
Seven dated events between March 2025 and November 2026 changed land supply and demand in the Data Center Real Estate Market.
- In March 2025, Loudoun County made data centers a conditional use requiring a special exception (Source: Loudoun County).
- In December 2025, Ireland’s Commission for Regulation of Utilities set its new connection policy for data centres (Source: CRU).
- In December 2025, IMDA and the Economic Development Board launched Singapore’s second call for application for at least 200 MW (Source: IMDA).
- In July 2026, the Virginia Court of Appeals voided the Prince William Digital Gateway rezonings covering 2,139 acres (Source: Prince William County).
- In September 2026, the Loudoun Board of Supervisors paused certain legislative applications for data centers and substations (Source: Loudoun County).
- In October 2026, Digital Realty reported USD 802.8 million of acquisitions, mainly land, and 1,464 MW underway (Source: Digital Realty quarterly report).
- In November 2026, the U.S. Census Bureau put September private data center construction at a USD 96.46 billion annual rate (Source: U.S. Census Bureau).
Research Methodology: How DC Market Insights Sized the Data Center Real Estate Market
DC Market Insights sized the Data Center Real Estate Market bottom-up at USD 40.33 billion for 2025 from capacity under construction and cost per MW, with three bound checks; the full approach is set out in our research methodology.
- Capacity: new IT capacity of 12.0 GW in 2025, 22 GW in 2030 and 27 GW in 2035; shells are built over the average of the current and next year’s completions (13,250 MW in 2025) and land is bought for completions two years ahead (16,800 MW in 2025).
- Unit costs 2025: land USD 0.35 million, shell and core USD 1.90 million, site works USD 0.45 million and development USD 0.25 million per MW; land escalates 5% a year to 2030 and 2.5% after, building costs 3% and 2%.
- Bound check 1 (ceiling): U.S. spend of USD 16.54 billion is 33.2% of the USD 49.74 billion of total U.S. private data center construction in 2025, below the 35-40% property share of a full build.
- Bound check 2 (ceiling): the USD 2.95 million per MW property layer sits below the USD 3.82 million per MW Prologis investment for energy-ready sites that include power works.
- Bound check 3 (floor): Digital Realty alone added about USD 5.66 billion of construction in progress and USD 678 million of land held in nine months of 2026, under 9% of the USD 48.80 billion modelled for 2026.
- Splits: every segment, region and country split sums to the total in every year from 2020 to 2035; CAGRs are recomputed from endpoint values.
Related DC Market Insights research includes the Wholesale Colocation Market, the Data Center Design Market and the Data Center Renovation Market.
Table of contents
- 01Introduction
- 1.1Market Definition and Scope
- 1.2Research Methodology
- 02Executive Summary
- 2.1Market Snapshot, 2025, 2026 and 2035
- 2.2Key Market Statistics
- 2.3Key Takeaways
- 03Market Scope
- 3.1Included
- 3.2Excluded
- 3.3Why Estimates Differ
- 04Market Dynamics
- 4.1Microsoft, Meta and Alphabet Lease Backlog
- 4.2Developer Land Banking
- 4.3Microsoft Property Additions
- 4.4Prologis Energy-Ready Conversions
- 4.5Campuses above 200 MW
- 4.6Loudoun Special Exception and Pause
- 4.7Court and Grid Regulator Risk
- 4.8Secondary U.S. Metros
- 4.9Saudi Arabia and India
- 05Pricing Analysis
- 5.1Property Cost per MW, 2020-2035
- 5.2Public Price Anchors
- 06Standards and Regulation
- 6.1Loudoun County
- 6.2Prince William County
- 6.3City of Phoenix
- 6.4Ireland CRU Connection Policy
- 6.5Singapore DC-CFA2
- 07Market Segmentation by Component
- 7.1Land and Powered Land Acquisition
- 7.2Shell and Core Construction
- 7.3Site and Utility Enabling Works
- 7.4Development and Entitlement Services
- 08Market Segmentation by Developer Type
- 8.1Hyperscale Self-Build
- 8.2Wholesale and Build-to-Suit Developers
- 8.3Retail Colocation Operators
- 8.4Enterprise and Public Sector
- 09Market Segmentation by Campus Size
- 9.1Campuses above 200 MW
- 9.2Campuses of 50 to 200 MW
- 9.3Sites below 50 MW
- 10Market Segmentation by Tenure Model
- 10.1Owner-Developed Freehold
- 10.2Powered Shell and Sale-Leaseback
- 10.3Ground Lease
- 11DC Exclusive: Hyperscaler Lease Backlog Ledger
- 11.1Microsoft
- 11.2Meta
- 11.3Alphabet
- 12Regional Insights
- 12.1North America
- 12.2Asia Pacific
- 12.3Europe
- 12.4Latin America
- 12.5Middle East and Africa
- 13Country Analysis
- 13.1United States
- 13.2China
- 13.3Japan
- 13.4Germany
- 13.5India
- 13.6United Kingdom
- 13.7Canada
- 13.8Australia
- 13.9Malaysia
- 13.10France
- 13.11Brazil
- 13.12Saudi Arabia
- 14Forecast Scenarios
- 14.1Low Scenario
- 14.2Base Scenario
- 14.3High Scenario
- 15Competitive Insights
- 15.1Digital Realty
- 15.2Equinix
- 15.3Prologis
- 15.4QTS Data Centers
- 15.5Vantage Data Centers
- 15.6STACK Infrastructure
- 15.7CyrusOne
- 15.8Aligned Data Centers
- 15.9EdgeConneX
- 15.10Compass Datacenters
- 15.11Iron Mountain Data Centers
- 15.12NTT DATA
- 15.13AirTrunk
- 16Recent Developments
- 16.1Zoning and Grid Decisions 2025-2026
- 16.2Developer Filings 2026
- Fig. 1Data Center Real Estate Market Size, 2020-2035 (USD million)
- Table 1Market Snapshot Attributes
- Table 2Scope Comparison
- Table 3Property Cost per MW, 2020-2035
- Table 4Market by Component
- Table 5Market by Developer Type
- Table 6Market by Campus Size
- Table 7Market by Tenure Model
- Table 8Hyperscaler Lease Backlog Ledger
- Table 9Market by Region
- Table 10Top 12 Countries
- Table 11Forecast Scenarios, 2035
About this report
Written by Amit Jain and reviewed by Deepti Agrawal, Senior Editor, Research. Figures are built top-down and bottom-up and reconciled before publication, with 2025 as the base year.
Read our methodologyHow we built this
- Historical period2020-2024
- Base year2025
- Forecast period2026-2035
- Sizing approachTop-down + bottom-up
Need more than the report?
Advisory on this market
Due diligence, site selection and market entry work, by the analysts who wrote this report.
See consulting servicesFrequently asked questions
USD 48.80 billion in 2026, up 21.00% from USD 40.33 billion in 2025, according to DC Market Insights estimates. The market is projected to reach USD 105.38 billion by 2035, a CAGR of 10.08% from 2025.
10.08% a year from 2025 to 2035, after 23.46% a year from 2020 to 2025, as capacity under construction rose to about 13.3 GW and powered land prices climbed.
About USD 2.95 million per MW of IT capacity in 2025: USD 0.35 million land, USD 1.90 million shell and core, USD 0.45 million site works and USD 0.25 million development (DC Market Insights estimate).
Shell and Core Construction, with USD 25.18 billion or 62.4% of 2025 value. Land and Powered Land Acquisition grows to USD 14.40 billion by 2035.
North America, with USD 18.96 billion or 47.0% of 2025 value. The Middle East and Africa grows fastest at 15.85% a year.
USD 850.8 billion of data center and related leases signed by Microsoft, Meta and Alphabet had not commenced by 30 September 2026, and each needs land, a shell and site works built before it starts.
Campuses above 200 MW, at 13.90% a year, from USD 12.91 billion in 2025 to USD 47.42 billion by 2035, because large tracts lower land and utility cost per MW.
About 24% of 2025 value is held by Digital Realty, Equinix, Prologis, QTS and Vantage Data Centers together (DC Market Insights estimate). STACK, CyrusOne, Aligned, EdgeConneX, Compass, AirTrunk and the hyperscalers also build.
Loudoun County has required a special exception since March 2025 and paused new legislative applications in September 2026, while the Prince William Digital Gateway rezonings for 2,139 acres were voided in July 2026.
The DC Market Insights figure of USD 48.80 billion for 2026 counts only new spend on land, shells, site works and development. Estimates that add rent, full fit-out or portfolio sales are several times larger.
Get this report
How do I get the full report?
Request a quote; we reply by email within one business day.
How and when will I receive the report?
By email, within 24–48 business hours of payment.
How can I pay?
Once you accept the quote, we email you a secure payment link.
Can I see a sample first?
Yes. Request a free sample and we will email it to you.
Can the report be tailored to my needs?
Yes. We can add countries, segments or data cuts. Talk to an analyst about the scope you need.
Can I get an invoice or pay against a purchase order?
Write to sales@dcmarketinsights.com and our team will help.