
Data Center Grid Infrastructure Interconnection Market Size, Share & Forecast to 2035
Market at a glance
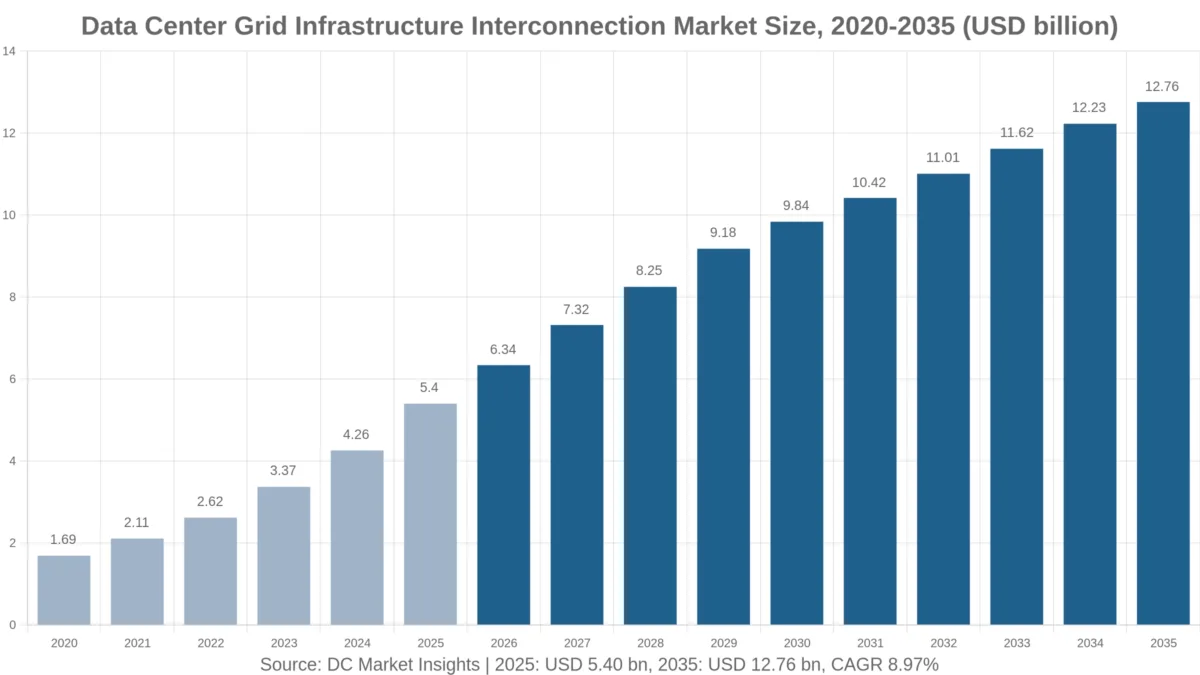
The Data Center Grid Infrastructure Interconnection market was worth USD 5,400.0 million in 2025 and is forecast to reach USD 12.76 billion by 2035, growing at a 8.97% CAGR.
 By Amit Jain, Senior Consultant, ICT & Emerging Technologies
 Reviewed by Deepti Agrawal
Last updated 30 Oct 2026
Base year 2025 PDF + Excel
Key findings
Texas Senate Bill 6 and ERCOT's 474 GW Large-Load Queue
Commitment Fees and Minimum Bills: GBP 237,500 to 712,500 per MW in Britain
Speculative Requests: 302.2 GW Excluded from ERCOT Batch Zero
Extra-High-Voltage Lines for Gigawatt Campuses: USD 6.25 billion by 2035
What is inside the report
- 01Introduction
- 02Executive Summary
- 03Market Scope and Estimate Comparison
- 04Market Dynamics
- 05Pricing Analysis
- 06Standards and Regulation
- 07Market Segmentation by Component
- 08Market Segmentation by Voltage Level
- 09Market Segmentation by Funding Model
- 10Market Segmentation by Data Center Type
- 16chapters
- 2020-2024Historical period
- 2026-2035Forecast period
- —Companies profiled
Segmentation
Recent developments
AEP reported 15 GW of new load commitments in the third quarter (Source: AEP 8-K).
ERCOT qualified 66.4 GW as base load in Batch Zero and excluded 302.2 GW (Source: ERCOT Board).
Ofgem proposed a data center commitment fee of GBP 237,500 to 712,500 per MW (Source: Ofgem).
FERC issued show-cause orders on large-load interconnection to six regional grid operators (Source: FERC).
SB Energy committed to fund USD 4.2 billion of 765 kV transmission for a 10 GW campus in Ohio (Source: AEP).
the CRU set its connection policy for new Irish data centers (Source: CRU).
Full analysis
The Data Center Grid Infrastructure Interconnection Market is valued at USD 6.34 billion in 2026 and is projected to reach USD 12.76 billion by 2035, up from USD 5.40 billion in 2025, a CAGR of 8.97% from 2025 to 2035 (DC Market Insights estimate). What moves the money in data center grid infrastructure interconnection is who pays for the wires: since Texas Senate Bill 6 (2025) and the June 2026 show-cause orders of the Federal Energy Regulatory Commission (FERC), large loads increasingly fund the network upgrades assigned to them instead of spreading them across all ratepayers. American Electric Power (AEP) shows the scale, reporting 15 GW of new load commitments in the third quarter of 2026 alone and 84 GW of contracted incremental load expected by 2031 (Source: AEP 8-K, 28 October 2026). The 2025 receipt is 18.01 GW of grid capacity whose connection works were paid in 2025 × USD 0.30 million per MW = USD 5.40 billion; dedicated high-voltage lines grow fastest at 10.55% a year, and the Middle East and Africa is the fastest region at 13.48% because new gigawatt campuses there start without transmission backbones.
Key Market Statistics: How Big Is the Data Center Grid Infrastructure Interconnection Market in 2026?
The Data Center Grid Infrastructure Interconnection Market is worth USD 6.34 billion in 2026, 17.32% above USD 5.40 billion in 2025, DC Market Insights estimates.
- Market size 2025: USD 5.40 billion
- Market size 2026: USD 6.34 billion
- Market size 2030: USD 9.84 billion
- Market size 2035: USD 12.76 billion
- CAGR 2025-2035: 8.97% (low case USD 9.36 billion, high case USD 16.36 billion in 2035)
- Largest component: Network Upgrades and Transmission Reinforcement, 55.00% of 2025 value
- Fastest funding model: Customer-Funded Direct Assignment, 11.87% a year
- Leading region: North America, 52.00% of 2025 value; fastest region: Middle East and Africa, 13.48%
- Largest country: United States, USD 2.59 billion in 2025
- Market leaders: Quanta Services among contractors and Hitachi Energy among grid equipment suppliers (DC Market Insights assessment)
Key Takeaways: What Drives Data Center Grid Interconnection Spending?
- Data center grid infrastructure interconnection spend rises from USD 5.40 billion to USD 12.76 billion because grid capacity funded each year climbs from 18.01 GW to 31.90 GW.
- Cost per MW rises from USD 0.30 million to USD 0.40 million because campuses move to remote sites that need 345 kV to 765 kV lines.
- Customer-funded connections grow to 52.00% of value in 2035 because regulators now ask large loads to pay for their own upgrades.
- The queue is far larger than the build: 676 GW of tracked requests and contracts equal about 38 years of 2025 connections, because speculative requests are cheap to file.
Executive Summary: How Much Is Spent on Data Center Grid Interconnection?
The Global Data Center Grid Infrastructure Interconnection Market size was valued at USD 1.69 billion in 2020, reached USD 5.40 billion in 2025, and is anticipated to reach USD 12.76 billion by 2035, at a CAGR of 8.97% during the forecast period.
| Report Attribute | Details |
|---|---|
| Historical Data | 2020-2024 |
| Base Year | 2025 |
| Forecast Period | 2026-2035 |
| Market Size 2025 | USD 5.40 billion |
| Market Size 2026 | USD 6.34 billion |
| CAGR 2025-2035 | 8.97% |
| Market Size 2035 | USD 12.76 billion |
| Segments Covered | Component, Voltage Level, Funding Model, Data Center Type |
| Regions Covered | North America, Europe, Asia Pacific, Latin America, Middle East and Africa |
Data center grid infrastructure interconnection grew 26.12% a year from 2020 to 2025 as new data center IT capacity more than doubled from 5.0 GW to 12.0 GW a year, and connection works are paid about a year before energisation. Growth slows to 8.97% after 2025 because new capacity additions flatten near 27 GW a year by 2035, while cost per MW keeps rising by about 2.9% a year.
Market Scope: What Does Data Center Grid Interconnection Include?
Data center grid infrastructure interconnection covers USD 5.40 billion of utility-side works in 2025 that connect data centers to the public grid.
Included
- Transmission and distribution network upgrades assigned to data center loads (reconductoring, new circuits, transformer banks at utility substations)
- Dedicated high-voltage lines built from the grid to a campus
- Utility switching stations and points of interconnection
- Interconnection studies, application fees and non-refundable connection charges
Excluded
- Customer-owned on-site substations and step-down transformers, sized in the Data Center Substation Market
- Medium- and low-voltage cables inside the fence
- Behind-the-meter generation equipment, capacity market payments, power purchase agreements and electricity bills
- Refundable deposits and collateral, which are returned at energisation
How the Segments Fit Together
Every dimension sums to the same total each year: components describe what is built, voltage level describes where on the grid it sits, funding model describes who pays first, and data center type describes the buyer. Hyperscale and AI campuses hold 62.00% of 2025 value.
Why Do Data Center Grid Interconnection Market Estimates Differ?
DC Market Insights puts data center grid infrastructure interconnection at USD 6.34 billion in 2026, and wider definitions come out several times larger.
Broader estimates often add the on-site substation and transformers inside the fence, the generation built for a campus, capacity market payments such as the PJM Interconnection 2028/2029 auction that cleared at USD 325 per MW-day, or the electricity itself. This edition counts only the utility-side wires and stations. Small and mid-size buyers such as enterprise and edge sites are in scope and hold 10.00% of 2025 value.
| Element | In this report | Why |
|---|---|---|
| Network upgrades assigned to the load | Yes, USD 2.97 billion in 2025 | Paid for the connection |
| Dedicated lines to the campus | Yes, USD 1.40 billion | Built for one load |
| Studies and connection fees | Yes, USD 324.16 million | Non-refundable spend |
| On-site substation and transformers | No | Separate DCMI report |
| Capacity payments and electricity | No | Operating cost, not connection |
| Refundable collateral | No | Returned at energisation |
Market Drivers: Why Is Data Center Grid Interconnection Spending Rising?
Data center grid infrastructure interconnection spending rises 17.32% in 2026 because three rule changes and one load boom arrived together.
Texas Senate Bill 6 and ERCOT’s 474 GW Large-Load Queue
The Electric Reliability Council of Texas (ERCOT) told the Texas Senate on 29 July 2026 that it tracks about 474 GW of large loads seeking interconnection, about 90% of them data centers. Senate Bill 6 (analysis of 5 August 2025) sets a 75 MW large-load threshold, a study fee of at least USD 100,000 and per-MW security, and makes large loads contribute to the utility’s interconnection costs (Texas Legislature). DC Market Insights estimates the United States at USD 2.59 billion of 2025 data center grid interconnection value.
AEP’s 84 GW of Contracted Load and the 765 kV Backbone
AEP plans about USD 37 billion of transmission investment within a USD 100 billion five-year capital plan and expects transmission rate base to approach USD 70 billion by 2031 (AEP 8-K, October 2026). In Ohio, SB Energy committed on 20 March 2026 to fund USD 4.2 billion of new 765 kV transmission for a planned 10 GW campus at Piketon, about USD 0.42 million per MW, with first power in 2029 (Source: AEP).
Customer-Funded Upgrades After FERC’s June 2026 Show-Cause Orders
The U.S. Department of Energy asked FERC on 23 October 2025 to cover loads above 20 MW and make them responsible for 100% of the network upgrades assigned to them. On 18 June 2026 FERC instead ordered all six regional grid operators to justify or reform their large-load rules (FERC). Customer-funded direct assignment grows 11.87% a year to USD 6.64 billion in 2035.
Market Trends: How Are Data Center Grid Connection Rules Changing?
Data center grid infrastructure interconnection is moving from first-come queues to paid, firm commitments, with studies and fees worth USD 324.16 million in 2025.
Commitment Fees and Minimum Bills: GBP 237,500 to 712,500 per MW in Britain
The Office of Gas and Electricity Markets (Ofgem) said on 29 July 2026 that demand connection applications rose from 41 GW to 125 GW in under a year, at least 80 GW of it data centers, and proposed a refundable commitment fee of GBP 237,500 to 712,500 per MW (Ofgem). In Ohio, the Public Utilities Commission approved on 9 July 2025 an AEP Ohio tariff under which new data centers pay for at least 85% of contracted capacity for up to 12 years (Source: Ohio Consumers’ Counsel).
Bring-Your-Own-Power Connections in Ireland and PJM
The Commission for Regulation of Utilities (CRU) decided on 12 December 2025 that new Irish data centers must bring on-site or nearby generation or storage matching their import capacity and meet 80% of annual demand from new Irish renewables within six years (CRU). FERC’s December 2025 order on PJM Interconnection created Firm and Non-Firm Contract Demand transmission services for co-located load (Source: FERC fact sheet). Co-located and hybrid grid connections reach USD 1.91 billion by 2035.
Equipment Backlogs: GE Vernova USD 42.2 Billion and Siemens Energy EUR 51 Billion
GE Vernova reported an Electrification equipment backlog of USD 42.2 billion, up 60% year on year (Source: GE Vernova 8-K, 28 October 2026), and Siemens Energy Grid Technologies an order backlog of EUR 51 billion, citing data center transformer projects (Source: Siemens Energy, 5 August 2026). These backlogs push data center grid interconnection cost per MW from USD 0.30 million in 2025 to USD 0.36 million in 2030.
Market Challenges: What Slows Data Center Grid Interconnection?
Data center grid infrastructure interconnection is held back by speculative requests and congested networks, which is why only about 18.01 GW was funded in 2025 against hundreds of GW requested.
Speculative Requests: 302.2 GW Excluded from ERCOT Batch Zero
In ERCOT’s Batch Zero screening (September 2026), 204 projects with 66.4 GW qualified as base load and 158 projects with 127.9 GW as studied load, while 373 projects with 302.2 GW were excluded (Source: ERCOT Board). Oncor alone reported about 282 GW of data center requests in its queue at mid-2026 (Source: Oncor, 6 August 2026). Study capacity, not money, sets the pace.
Grid Congestion: 9.1 GW Waiting in the Netherlands
As of 1 July 2025, 14,044 large-user requests for 9.1 GW were waiting for medium- and low-voltage grid capacity in the Netherlands (Source: Dutch Minister of Climate and Green Growth, 2 February 2026), and the European Commission reports connection queues in at least 16 EU countries. Europe grows slowest among regions at 7.62% a year.
Market Opportunities: Where Will Data Center Grid Interconnection Money Go?
Data center grid infrastructure interconnection offers its largest new pools in extra-high-voltage lines and in fast-growing regions outside North America.
Extra-High-Voltage Lines for Gigawatt Campuses: USD 6.25 billion by 2035
Works at 345 kV and above grow 11.78% a year from USD 2.05 billion in 2025, as campuses of 1 GW to 10 GW need their own 500 kV or 765 kV circuits. The Louisiana Public Service Commission approved in August 2025 a 60-mile 500 kV line and two 30-mile 500 kV lines to serve the Meta campus in Richland Parish (Source: Louisiana PSC Order U-37425).
Asia Pacific and the Middle East: Malaysia’s 8.35 GW TNB Pipeline
Tenaga Nasional Berhad (TNB) lists 61 data center projects with 8.35 GW, 5.65 GW of them in its system, and actual data center load of 1,256 MW in June 2026 against 603 MW a year earlier (Source: TNB analyst briefing, 28 August 2026). Asia Pacific grows from USD 1.30 billion to USD 3.57 billion by 2035.
Pricing Analysis: How Much Does a Data Center Grid Connection Cost per MW?
A data center grid infrastructure interconnection cost USD 0.30 million per MW of grid capacity in 2025, rising to USD 0.40 million by 2035, DC Market Insights estimates.
| Year | Cost per MW of grid capacity (USD million) | Cost per kW (USD) | Grid capacity funded (GW) | Market (USD million) |
|---|---|---|---|---|
| 2020 | 0.22 | 220 | 7.70 | 1,692.90 |
| 2025 | 0.30 | 300 | 18.01 | 5,402.70 |
| 2030 | 0.36 | 360 | 27.32 | 9,836.64 |
| 2035 | 0.40 | 400 | 31.90 | 12,760.20 |
Public price anchors: SB Energy’s USD 4.2 billion for 10 GW at Piketon equals USD 0.42 million per MW; a North Dakota filing puts a new line and substation for one large-load customer of Cass County Electric Cooperative at USD 75 million (Source: North Dakota PSC, January 2026); Texas sets a study fee of at least USD 100,000 per large-load request. Refundable deposits such as Ofgem’s proposed fee are not counted as spend.
Standards and Regulation: Which Rules Govern Data Center Grid Connections?
Data center grid infrastructure interconnection is governed by at least nine named rules adopted or proposed between January 2025 and July 2026.
- FERC show-cause orders to PJM, MISO, SPP, CAISO, ISO-NE and NYISO on large-load interconnection (18 June 2026; Source: FERC)
- DOE advance notice of proposed rulemaking RM26-4: loads above 20 MW, 100% of assigned network upgrades (23 October 2025; Source: DOE)
- FERC PJM co-location order, docket EL25-49: Firm and Non-Firm Contract Demand services (December 2025; Source: FERC)
- Texas Senate Bill 6: 75 MW threshold, USD 100,000 study fee, curtailment for loads connected after 31 December 2025 (Source: Texas Legislature)
- AEP Ohio data center tariff: 85% minimum for up to 12 years (approved 9 July 2025; Source: PUCO minutes)
- Georgia Public Service Commission rule for loads above 100 MW: contracts up to 15 years (23 January 2025; Source: Georgia PSC)
- CRU large energy user connection policy (12 December 2025; Source: CRU)
- UK strategic demand connections consultation: about 140 data centers holding about 50 GW at transmission (11 March 2026; Source: DESNZ)
- European Grids Package, presented 10 December 2025, against EUR 584 billion of grid investment needed by 2030 (Source: European Commission)
Market Segmentation: Which Segments Lead Data Center Grid Interconnection?
Network upgrades and transmission reinforcement lead data center grid infrastructure interconnection with USD 2.97 billion in 2025, while dedicated high-voltage lines grow fastest.
By Component
Network upgrades take the largest share because most campuses still connect to existing networks; dedicated lines gain as sites move away from load centers.
| Component | 2025 (USD million) | Share 2025 | 2035 (USD million) | CAGR 2025-2035 |
|---|---|---|---|---|
| Network Upgrades and Transmission Reinforcement | 2,971.49 | 55.00% | 6,507.70 | 8.15% |
| Dedicated High-Voltage Lines | 1,404.70 | 26.00% | 3,828.06 | 10.55% |
| Switching Stations and Points of Interconnection | 702.35 | 13.00% | 1,658.83 | 8.97% |
| Studies Fees and Connection Charges | 324.16 | 6.00% | 765.61 | 8.97% |
By Voltage Level
Extra high voltage rises from 38.00% to 49.00% of value as single campuses pass 1 GW.
| Voltage Level | 2025 (USD million) | Share 2025 | 2035 (USD million) | CAGR 2025-2035 |
|---|---|---|---|---|
| Extra High Voltage 345 kV and Above | 2,053.03 | 38.00% | 6,252.50 | 11.78% |
| High Voltage 115 to 230 kV | 2,539.27 | 47.00% | 5,104.08 | 7.23% |
| Medium Voltage Below 69 kV | 810.40 | 15.00% | 1,403.62 | 5.65% |
By Funding Model
Customer-funded direct assignment overtakes utility funding before 2030 as tariffs in Texas, Ohio and Georgia shift costs to the large load.
| Funding Model | 2025 (USD million) | Share 2025 | 2035 (USD million) | CAGR 2025-2035 |
|---|---|---|---|---|
| Customer-Funded Direct Assignment | 2,161.08 | 40.00% | 6,635.30 | 11.87% |
| Utility-Funded with Tariff Recovery | 2,485.24 | 46.00% | 4,210.87 | 5.41% |
| Co-Located and Hybrid Grid Connections | 756.38 | 14.00% | 1,914.03 | 9.73% |
By Data Center Type
Hyperscale and AI campuses grow 10.62% a year; enterprise and edge sites connect mostly at medium voltage and grow 3.55%.
| Data Center Type | 2025 (USD million) | Share 2025 | 2035 (USD million) | CAGR 2025-2035 |
|---|---|---|---|---|
| Hyperscale and AI Campuses | 3,349.67 | 62.00% | 9,187.34 | 10.62% |
| Colocation Campuses | 1,512.76 | 28.00% | 2,807.24 | 6.38% |
| Enterprise and Edge Sites | 540.27 | 10.00% | 765.61 | 3.55% |
DC Exclusive: Large-Load Grid Queue Tracker, 8 Operators and 676 GW of Data Center Requests
The DC Market Insights Large-Load Grid Queue Tracker is a DC Market Insights model built on 9 inputs: eight published operator figures and the modelled cost of USD 0.30 million per MW. Counting ERCOT, AEP, Dominion, NESO, TNB and Fingrid once each gives about 676 GW of data center grid infrastructure interconnection demand requested or contracted, about 38 times the 18.01 GW funded in 2025. At 2025 cost the full queue would need about USD 203 billion of connection works, so the market is set by how much of the queue regulators let through, not by demand.
| Operator | Measure | Size | Date | Note |
|---|---|---|---|---|
| ERCOT (Texas) | Large loads seeking interconnection | 474 GW, about 90% data centers | Jun 2026 | Batch Zero: 66.4 GW base, 127.9 GW studied |
| Oncor (inside ERCOT) | Data center requests in transmission queue | About 282 GW (not added to total) | Q2 2026 | Corridor projects above USD 7 billion, 2026-2034 |
| AEP (11 states) | Contracted incremental load | 84 GW by 2031 | Oct 2026 | 15 GW signed in Q3 2026 |
| Dominion Energy (Virginia) | Data center capacity under contract | About 54 GW | Sep 2026 | Billing peak 4.8 GW in Aug 2026 |
| NESO (Great Britain) | Data center demand connection responses | 50.8 GW of 92.9 GW | Mar 2026 | Only 32% have secured off-takers |
| TNB (Malaysia) | Data center pipeline | 8.35 GW, 5.65 GW in system | Jun 2026 | Load 1,256 MW |
| Fingrid (Finland) | Signed data center connection agreements | Nearly 5 GW | Aug 2026 | Transmission and distribution |
| Dutch grid operators | Large-user requests waiting (all sectors) | 9.1 GW (not added to total) | Jul 2025 | 14,044 requests |
Regional Insights: Which Region Spends Most on Data Center Grid Interconnection?
North America leads data center grid infrastructure interconnection with USD 2.81 billion in 2025, and the Middle East and Africa grows fastest at 13.48% a year.
| Region | 2025 (USD million) | Share 2025 | 2035 (USD million) | CAGR 2025-2035 |
|---|---|---|---|---|
| North America | 2,809.40 | 52.00% | 5,997.29 | 7.88% |
| Europe | 918.46 | 17.00% | 1,914.03 | 7.62% |
| Asia Pacific | 1,296.65 | 24.00% | 3,572.86 | 10.67% |
| Latin America | 162.08 | 3.00% | 510.41 | 12.15% |
| Middle East and Africa | 216.11 | 4.00% | 765.61 | 13.48% |
North America
North America’s USD 2.81 billion rests on Texas, Virginia and Ohio: Dominion Energy reported about 54 GW of data center capacity under contract in September 2026 (Source: Dominion presentation to PJM).
Europe
Europe’s USD 918.46 million is capped by connection queues; data centers used 22% of Irish electricity in 2024 (Source: CRU), and Fingrid reports nearly 5 GW of signed data center connections in Finland.
Asia Pacific
Asia Pacific grows 10.67% a year to USD 3.57 billion, led by China, Japan, India and Malaysia, where Johor holds 5.6 GW of TNB’s pipeline.
Latin America
Latin America grows 12.15% a year from USD 162.08 million, with Brazil the largest market at USD 75.64 million in 2025 (DC Market Insights estimate).
Middle East and Africa
The Middle East and Africa grows from USD 216.11 million to USD 765.61 million, with Saudi Arabia at 12.80% a year because new campuses need new extra-high-voltage lines from scratch.
Country Analysis: Which Countries Lead Data Center Grid Interconnection?
The United States holds 48.00% of 2025 data center grid infrastructure interconnection value, and India is the fastest large country at 15.14% a year.
| Rank | Country | Region | 2025 (USD million) | 2035 (USD million) | CAGR 2025-2035 |
|---|---|---|---|---|---|
| 1 | United States | North America | 2,593.30 | 5,486.89 | 7.78% |
| 2 | China | Asia Pacific | 567.28 | 1,467.42 | 9.97% |
| 3 | United Kingdom | Europe | 189.09 | 421.09 | 8.34% |
| 4 | Japan | Asia Pacific | 183.69 | 459.37 | 9.60% |
| 5 | Canada | North America | 178.29 | 421.09 | 8.97% |
| 6 | Germany | Europe | 172.89 | 382.81 | 8.27% |
| 7 | India | Asia Pacific | 162.08 | 663.53 | 15.14% |
| 8 | Malaysia | Asia Pacific | 129.66 | 357.29 | 10.67% |
| 9 | Australia | Asia Pacific | 97.25 | 255.20 | 10.13% |
| 10 | Saudi Arabia | Middle East and Africa | 91.85 | 306.24 | 12.80% |
| 11 | Ireland | Europe | 86.44 | 127.60 | 3.97% |
| 12 | Brazil | Latin America | 75.64 | 242.44 | 12.35% |
Forecast Scenarios: How Big Could Data Center Grid Interconnection Be by 2035?
Data center grid infrastructure interconnection reaches USD 12.76 billion in 2035 in the base case, within a range of USD 9.36 billion to USD 16.36 billion.
| Scenario | 2035 (USD million) | CAGR 2025-2035 | Assumption |
|---|---|---|---|
| Low | 9,363.60 | 5.65% | New IT capacity 24 GW in 2035; USD 0.34 million per MW |
| Base | 12,760.20 | 8.97% | New IT capacity 27.8 GW in 2036; USD 0.40 million per MW |
| High | 16,363.35 | 11.72% | New IT capacity 31 GW; USD 0.46 million per MW as 765 kV builds spread |
Key Players and Market Share: Who Builds Data Center Grid Connections?
The five largest grid contractors and equipment suppliers hold about 38% of 2025 data center grid infrastructure interconnection value, a DC Market Insights estimate based on their published backlogs.
- Quanta Services
- GE Vernova
- Siemens Energy
- Hitachi Energy
- Eaton
- Prysmian
- Nexans
- MYR Group
- Burns and McDonnell
- Black and Veatch
- American Electric Power
- Dominion Energy
- Oncor
- Entergy
- National Grid
Quanta Services reported a record USD 63.7 billion backlog and USD 12.01 billion of third-quarter revenue (Source: Quanta 8-K, 29 October 2026). Hitachi Energy reported a backlog of about USD 60 billion, data center orders up more than 150% in fiscal 2025 and more than USD 9 billion of factory investment for 2024-2027 (Source: Hitachi Investor Day, 10 June 2026). Eaton reported a backlog of about USD 19.8 billion at the end of 2025 (Source: Eaton 8-K). Utilities such as AEP, Dominion Energy, Oncor and Entergy own most of the assets built.
Recent Developments in Data Center Grid Interconnection
Data center grid infrastructure interconnection saw six dated rule and project changes between December 2025 and October 2026.
- In October 2026, AEP reported 15 GW of new load commitments in the third quarter (Source: AEP 8-K).
- In September 2026, ERCOT qualified 66.4 GW as base load in Batch Zero and excluded 302.2 GW (Source: ERCOT Board).
- In July 2026, Ofgem proposed a data center commitment fee of GBP 237,500 to 712,500 per MW (Source: Ofgem).
- In June 2026, FERC issued show-cause orders on large-load interconnection to six regional grid operators (Source: FERC).
- In March 2026, SB Energy committed to fund USD 4.2 billion of 765 kV transmission for a 10 GW campus in Ohio (Source: AEP).
- In December 2025, the CRU set its connection policy for new Irish data centers (Source: CRU).
Research Methodology: How the Data Center Grid Interconnection Model Works
The data center grid infrastructure interconnection model multiplies grid capacity funded each year by cost per MW: new data center IT capacity one year ahead (14.5 GW for 2026) × power usage effectiveness of 1.35 × grid-connected share of 92% = 18.01 GW in 2025, × USD 0.30 million per MW = USD 5.40 billion.
Three bound checks hold. Ceiling 1: the 2026 market of USD 6.34 billion equals about 13% of Quanta Services’ annualised third-quarter 2026 revenue of USD 48.04 billion. Ceiling 2: Europe’s 2025 value of USD 918.46 million is about 1.0% of the EUR 584 billion the European Commission says grids need by 2030 (about EUR 83 billion a year). Floor: SB Energy’s USD 4.2 billion over about four years plus Oncor’s USD 7 billion over nine years add up to about USD 1.83 billion a year, below the United States 2026 value of USD 3.04 billion. Segment, region and country splits are DC Market Insights shares. The full approach is described in our research methodology. Related reports: the Data Center Transformer Market, the Data Center Power Cable Market and the Data Center Onsite Power Generation Market.
Table of contents
- 01Introduction
- 1.1Report Description
- 1.2Market Definition and Scope
- 1.3Research Methodology
- 02Executive Summary
- 2.1Market Snapshot, 2025, 2026 and 2035
- 2.2Key Market Statistics
- 2.3Key Takeaways
- 03Market Scope and Estimate Comparison
- 3.1Included and Excluded
- 3.2How the Segments Fit Together
- 3.3Why Estimates Differ
- 04Market Dynamics
- 4.1Texas Senate Bill 6 and ERCOT's 474 GW Large-Load Queue
- 4.2AEP's 84 GW of Contracted Load and the 765 kV Backbone
- 4.3Customer-Funded Upgrades After FERC's June 2026 Show-Cause Orders
- 4.4Commitment Fees and Minimum Bills
- 4.5Bring-Your-Own-Power Connections in Ireland and PJM
- 4.6Equipment Backlogs at GE Vernova and Siemens Energy
- 4.7Speculative Requests Excluded from ERCOT Batch Zero
- 4.8Grid Congestion in the Netherlands
- 4.9Extra-High-Voltage Lines for Gigawatt Campuses
- 4.10Malaysia's 8.35 GW TNB Pipeline
- 05Pricing Analysis
- 5.1Cost per MW of Grid Capacity, 2020-2035
- 5.2Public Price Anchors
- 06Standards and Regulation
- 6.1FERC Show-Cause Orders (June 2026)
- 6.2DOE ANOPR RM26-4
- 6.3FERC PJM Co-Location Order
- 6.4Texas Senate Bill 6
- 6.5AEP Ohio Data Center Tariff
- 6.6Georgia PSC Large-Load Rule
- 6.7CRU Connection Policy
- 6.8UK Strategic Demand Connections
- 6.9European Grids Package
- 07Market Segmentation by Component
- 7.1Network Upgrades and Transmission Reinforcement
- 7.2Dedicated High-Voltage Lines
- 7.3Switching Stations and Points of Interconnection
- 7.4Studies Fees and Connection Charges
- 08Market Segmentation by Voltage Level
- 8.1Extra High Voltage 345 kV and Above
- 8.2High Voltage 115 to 230 kV
- 8.3Medium Voltage Below 69 kV
- 09Market Segmentation by Funding Model
- 9.1Customer-Funded Direct Assignment
- 9.2Utility-Funded with Tariff Recovery
- 9.3Co-Located and Hybrid Grid Connections
- 10Market Segmentation by Data Center Type
- 10.1Hyperscale and AI Campuses
- 10.2Colocation Campuses
- 10.3Enterprise and Edge Sites
- 11DC Exclusive: Large-Load Grid Queue Tracker
- 11.1ERCOT (Texas)
- 11.2Oncor (inside ERCOT)
- 11.3AEP (11 states)
- 11.4Dominion Energy (Virginia)
- 11.5NESO (Great Britain)
- 11.6TNB (Malaysia)
- 11.7Fingrid (Finland)
- 11.8Dutch grid operators
- 12Regional Insights
- 12.1North America
- 12.2Europe
- 12.3Asia Pacific
- 12.4Latin America
- 12.5Middle East and Africa
- 13Country Analysis
- 13.1United States
- 13.2China
- 13.3United Kingdom
- 13.4Japan
- 13.5Canada
- 13.6Germany
- 13.7India
- 13.8Malaysia
- 13.9Australia
- 13.10Saudi Arabia
- 13.11Ireland
- 13.12Brazil
- 14Forecast Scenarios
- 14.1Low Scenario
- 14.2Base Scenario
- 14.3High Scenario
- 15Key Players and Market Share
- 15.1Quanta Services
- 15.2GE Vernova
- 15.3Siemens Energy
- 15.4Hitachi Energy
- 15.5Eaton
- 15.6Prysmian
- 15.7Nexans
- 15.8MYR Group
- 15.9Burns and McDonnell
- 15.10Black and Veatch
- 15.11American Electric Power
- 15.12Dominion Energy
- 15.13Oncor
- 15.14Entergy
- 15.15National Grid
- 16Recent Developments
- 16.1AEP Third-Quarter Load Commitments (October 2026)
- 16.2ERCOT Batch Zero Results (September 2026)
- 16.3Ofgem Commitment Fee Proposal (July 2026)
- 16.4FERC Show-Cause Orders (June 2026)
- 16.5SB Energy 765 kV Funding (March 2026)
- 16.6CRU Data Centre Connection Policy (December 2025)
- Fig. 1Data Center Grid Infrastructure Interconnection Market Size, 2020-2035 (USD billion)
- Table 1Report Attributes
- Table 2Scope Comparison
- Table 3Cost per MW of Grid Capacity, 2020-2035
- Table 4Market by Component, 2025 and 2035
- Table 5Market by Voltage Level, 2025 and 2035
- Table 6Market by Funding Model, 2025 and 2035
- Table 7Market by Data Center Type, 2025 and 2035
- Table 8Large-Load Grid Queue Tracker
- Table 9Market by Region, 2025 and 2035
- Table 10Top 12 Countries, 2025 and 2035
- Table 11Forecast Scenarios, 2035
About this report
Written by Amit Jain and reviewed by Deepti Agrawal, Senior Editor, Research. Figures are built top-down and bottom-up and reconciled before publication, with 2025 as the base year.
Read our methodologyHow we built this
- Historical period2020-2024
- Base year2025
- Forecast period2026-2035
- Sizing approachTop-down + bottom-up
Need more than the report?
Advisory on this market
Due diligence, site selection and market entry work, by the analysts who wrote this report.
See consulting servicesFrequently asked questions
USD 6.34 billion in 2026, up 17.32% from USD 5.40 billion in 2025, according to DC Market Insights estimates. The market is projected to reach USD 12.76 billion by 2035, a CAGR of 8.97% from 2025.
8.97% a year from 2025 to 2035, after 26.12% a year from 2020 to 2025, as grid capacity funded each year rises from 18.01 GW to 31.90 GW and cost per MW from USD 0.30 million to USD 0.40 million.
USD 5.40 billion was spent in 2025 on utility-side works that connect data centers to the grid: network upgrades, dedicated high-voltage lines, switching stations and interconnection studies and fees. On-site substations, transformers, generation and electricity are excluded.
USD 0.30 million per MW of grid capacity in 2025, rising to USD 0.40 million by 2035, DC Market Insights estimates. SB Energy’s USD 4.2 billion of 765 kV lines for a 10 GW Ohio campus equals USD 0.42 million per MW.
About 474 GW of large loads were seeking ERCOT interconnection in mid-2026, about 90% data centers. In Batch Zero, 66.4 GW qualified as base load, 127.9 GW as studied load and 302.2 GW was excluded.
Increasingly the data center: customer-funded direct assignment grows 11.87% a year to USD 6.64 billion by 2035, as Texas SB 6, the AEP Ohio tariff and FERC’s June 2026 orders move upgrade costs to large loads.
Extra-high-voltage works at 345 kV and above grow fastest at 11.78% a year to USD 6.25 billion by 2035. Among components, dedicated high-voltage lines lead at 10.55%.
North America, with USD 2.81 billion or 52.00% of 2025 value. The Middle East and Africa grows fastest at 13.48% a year, and India is the fastest large country at 15.14%.
A refundable commitment fee of GBP 237,500 to 712,500 per MW, proposed on 29 July 2026 after demand connection applications in Great Britain rose from 41 GW to 125 GW, at least 80 GW of it data centers.
USD 6.34 billion in 2026 counts only utility-side wires, stations and connection fees. Estimates that add on-site substations, transformers, campus generation, capacity payments or electricity come out several times larger.
Get this report
How do I get the full report?
Request a quote; we reply by email within one business day.
How and when will I receive the report?
By email, within 24–48 business hours of payment.
How can I pay?
Once you accept the quote, we email you a secure payment link.
Can I see a sample first?
Yes. Request a free sample and we will email it to you.
Can the report be tailored to my needs?
Yes. We can add countries, segments or data cuts. Talk to an analyst about the scope you need.
Can I get an invoice or pay against a purchase order?
Write to sales@dcmarketinsights.com and our team will help.