
Metals and Mining Data Center Market Size, Share & Forecast to 2035
Market at a glance
The Metals and Mining Data Center market was worth USD 4,640.0 million in 2025 and is forecast to reach USD 11.88 billion by 2035, growing at a 9.86% CAGR.
 By Amit Jain, Senior Consultant, ICT & Emerging Technologies
 Reviewed by Deepti Agrawal
Last updated 10 Nov 2026
Base year 2025 PDF + Excel
Key findings
Komatsu's 1,000 Autonomous Ultra-Class Trucks and the Data They Generate
Rio Tinto Sells Nuton Copper to Amazon's Data Centers
EU Critical Raw Materials Act Sets 2030 Benchmarks
What is inside the report
- 01Introduction
- 02Key Market Statistics
- 03Executive Summary
- 04Market Scope
- 05Why Estimates Differ
- 06Market Drivers
- 07Market Trends
- 08Market Challenges and Restraints
- 09Market Opportunities
- 10Pricing Analysis
- 22chapters
- 2020-2024Historical period
- 2026-2035Forecast period
- —Companies profiled
Segmentation
Recent developments
BHP reported technology initiatives at an EBITDA run rate of almost US$500 million (Source: BHP).
Codelco enabled 5,500 Microsoft 365 Copilot licences (Source: Codelco).
POSCO DX reported more than 200 AI agents in use across POSCO Group (Source: POSCO Newsroom).
Komatsu commissioned its 1,000th autonomous ultra-class haul truck (Source: Komatsu).
Codelco and Microsoft signed an 18-month data, AI and autonomy agreement (Source: Codelco).
Rio Tinto and Amazon Web Services agreed cloud analytics support for Nuton copper and copper supply to U.S. data centres (Source: Rio Tinto).
Full analysis
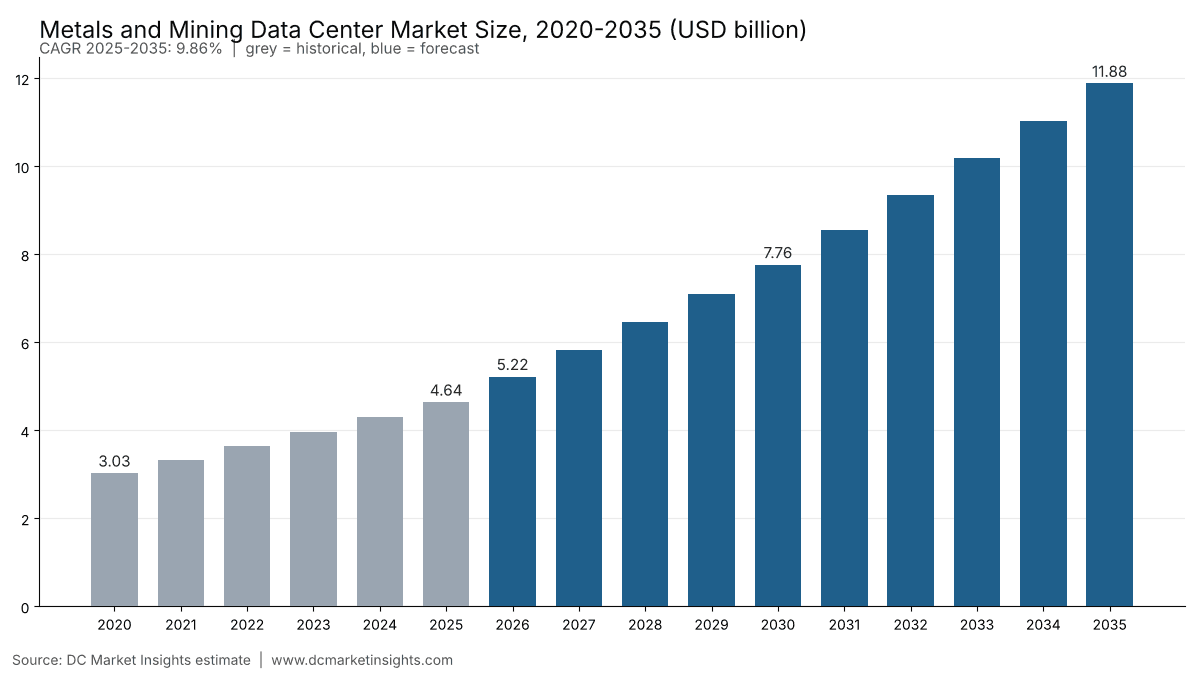
The Metals and Mining Data Center Market is valued at USD 5.22 billion in 2026 and is projected to reach USD 11.88 billion by 2035, up from USD 4.64 billion in 2025, a CAGR of 9.86% from 2025 to 2035 (DC Market Insights estimate). In mining the money follows the haul road: Komatsu commissioned its 1,000th autonomous ultra-class haul truck in April 2026, Fortescue runs more than 200 autonomous trucks from its Perth operations centre, and every one of those machines streams position, payload and fault data to remote operations centres and the data centers behind them. BHP put a number on the payoff in October 2026: technology initiatives were adding EBITDA at an annual run rate of almost US$500 million by the end of fiscal 2026, with more than US$650 million targeted for fiscal 2027 (BHP, October 2026). The 2025 receipt: 1,100 megawatts (MW) of information technology (IT) load in use by miners, smelters and steelmakers x USD 4.22 million of spending per MW = USD 4.64 billion, of which USD 3.26 billion is servers, storage and network gear and USD 781.44 million is colocation and hosting fees. Mining artificial intelligence (AI) and computer vision is the fastest workload at 23.91% a year, battery and critical minerals producers the fastest buyers at 16.18%, and the Middle East and Africa the fastest region at 11.44% as Saudi Arabia and Central Africa add processing capacity.
Key Market Statistics: How Big Is the Metals and Mining Data Center Market in 2026?
DC Market Insights values metals and mining data center spending at USD 5.22 billion in 2026, 12.53% above 2025, because autonomous fleets, plant control upgrades and the first GPU (graphics processing unit) racks for ore-body modelling all add IT load in the same year.
- Metals and mining data center market size 2025: USD 4.64 billion
- Market size 2026: USD 5.22 billion
- Market size 2030: USD 7.76 billion
- Market size 2035: USD 11.88 billion
- CAGR 2025-2035: 9.86% (low case 7.96%, high case 11.60%)
- Largest component: IT hardware, USD 3.26 billion or 70.3% of 2025 value
- Fastest workload: mining AI and computer vision, 23.91% a year to USD 2.38 billion by 2035
- Largest end user: iron ore and diversified miners, USD 1.39 billion in 2025; fastest end user: battery and critical minerals producers at 16.18%
- Leading region: Asia Pacific, USD 1.86 billion or 40.0% of 2025 value; fastest region: Middle East and Africa at 11.44%
- Largest country: China, USD 928.27 million in 2025; fastest large country: India at 14.40%
- Market leaders: BHP, Rio Tinto, Vale, Freeport-McMoRan, Fortescue and Codelco as the heaviest mining compute users, Microsoft and Amazon Web Services as platform hosts, and Komatsu and Caterpillar as the autonomy suppliers whose fleets feed the data (DC Market Insights assessment)
Executive Summary: Metals and Mining Data Center Market Size, 2020-2035
The Global Metals and Mining Data Center Market size was valued at USD 3.03 billion in 2020, reached USD 4.64 billion in 2025, and is anticipated to reach USD 11.88 billion by 2035, at a CAGR of 9.86% during the forecast period. Spending grew 8.91% a year from 2020 to 2025 while the industry it serves stayed large and cyclical: the U.S. Geological Survey (USGS) put U.S. nonfuel mineral production at USD 112 billion in 2025, and world crude steel output reached 1,849.4 million tonnes (Mt), according to the World Steel Association.
| Attribute | Value |
|---|---|
| Historical period | 2020-2024 |
| Base year | 2025 |
| Forecast period | 2026-2035 |
| Market size 2025 | USD 4.64 billion |
| Market size 2026 | USD 5.22 billion |
| CAGR 2025-2035 | 9.86% |
| Market size 2035 | USD 11.88 billion |
| Segments covered | Component, end user, workload, deployment model, region, 12 countries |
Mining is moving data out of the pit office in two directions at once. Corporate data centers barely grow, from USD 1.72 billion in 2025 to USD 1.90 billion in 2035 at 1.02% a year, while colocation and hosted private cloud climbs from USD 1.49 billion to USD 5.82 billion at 14.64%. Mine site and plant edge, the server rooms at crushers, concentrators, smelters and rail loadouts, reaches USD 4.16 billion because autonomous trucks cannot wait for a satellite link to a city hall.
What Counts as Metals and Mining Data Center Spending?
USD 4.64 billion in 2025: the metals and mining data center market is the data center capacity that miners, metal refiners, smelters, steel producers and battery-material processors own or lease for their own operations, priced as IT hardware, colocation and hosting fees, electrical and mechanical plant, and construction and fit-out.
- Included: servers, storage and network gear in corporate halls, remote operations centres and mine-site or plant server rooms; colocation, wholesale and hosted private cloud capacity leased by mining and metals companies; uninterruptible power, cooling and switchgear for owned sites; construction and fit-out of those rooms.
- Excluded: public cloud consumption fees, autonomous haulage hardware on the trucks, fleet management and mine planning software licences, private LTE (Long-Term Evolution) and 5G radios, drones and field sensors, and the oil and gas sector, which has its own Oil and Gas Data Center Market.
- How the segments fit together: the four components sum to the total; end users, workloads and deployment models each split the same total in every year, and the five regions and twelve countries reconcile with it.
Why Do Metals and Mining Data Center Market Estimates Differ?
USD 5.22 billion in 2026 counts only data center capacity that metals and mining companies own or lease, so it is far smaller than “digital mining” or “mining automation” figures that add machines and software.
Broader definitions add autonomous haulage kits, fleet management systems, mine planning and geology software, private LTE and 5G networks, drones, wearables, field sensors and sometimes the whole operational technology (OT) stack of a concentrator. DC Market Insights excludes those because they are bought from equipment and software budgets, not from data center budgets; they still drive this market because every autonomous truck and every sensor adds load to a remote operations centre or a site server room.
| Element | Counted by DC Market Insights | Why |
|---|---|---|
| Servers, storage and network gear for mining companies | Yes, USD 3.26 billion in 2025 | Core data center spend |
| Colocation and hosted private cloud | Yes, USD 781.44 million | Leased capacity |
| Owned-site power, cooling and fit-out | Yes, USD 598.40 million | Facility layer |
| Autonomous haulage hardware and fleet software | No | Equipment budget |
| Private LTE and 5G radios, drones, sensors | No | Network and field budget |
| Public cloud consumption | No | Counted by cloud providers |
In-scope buyers include mid-tier and junior miners as well as the majors: a single gold or lithium mine with a site server room and a hosted enterprise resource planning (ERP) system counts, which is why mine site and plant edge already holds 31.0% of 2025 value.
Market Drivers: What Is Pushing Miners and Metal Producers to Buy More Data Center Capacity?
Three forces add USD 7.24 billion of annual spending between 2025 and 2035: autonomous fleets, copper analytics tied to the data center boom itself, and the earnings case that BHP has now quantified.
Komatsu’s 1,000 Autonomous Ultra-Class Trucks and the Data They Generate
Komatsu became the first maker to commission 1,000 autonomous ultra-class haul trucks in April 2026, a fleet that has moved more than 11.5 billion tonnes, and its 500th Australian unit started work in September 2025 (Komatsu, April 2026). Caterpillar told its November 2025 investor day that it aims for more than 2,000 autonomous trucks worldwide by 2030, roughly tripling its fleet (Caterpillar, as reported by its dealer Finning). DC Market Insights values the remote operations and autonomy workload at USD 1.02 billion in 2025, rising to USD 2.85 billion by 2035 at 10.82% a year.
Leach Analytics Add Copper Without New Pits
Freeport-McMoRan reached an annual run rate of about 240 million pounds of copper from data analytics and new technology applied to leach stockpiles in late 2025 and targets 300 million pounds in 2026 (Freeport-McMoRan Form 10-K, February 2026). Recovering metal from existing stockpiles with models instead of new mines is cheap copper, so it pulls geology and process data into central halls: copper, gold and base metal miners spend USD 1.11 billion in 2025, growing 10.31% a year.
BHP’s US$500 Million EBITDA Run Rate from Technology
BHP reported technology initiatives worth almost US$500 million a year of EBITDA by the end of fiscal 2026 and set a target above US$650 million for fiscal 2027 (BHP, October 2026); in 2021 it moved its global applications portfolio to Microsoft Azure to cut reliance on regional data centres. A measured return on compute changes budget talks across the sector, which is why DC Market Insights expects iron ore and diversified miners to grow their data center spending from USD 1.39 billion to USD 3.33 billion by 2035.
Market Trends: How Is Mining and Metals Computing Changing?
Mining AI and computer vision grows 23.91% a year, more than four times faster than ERP, as compute moves from back-office systems to the pit, the plant and the copper buyer.
Rio Tinto Sells Nuton Copper to Amazon’s Data Centers
In January 2026 Rio Tinto and Amazon Web Services (AWS) agreed that AWS will provide two years of cloud data and analytics support for Nuton bioleaching at the Johnson Camp mine in Arizona, while about 30,000 tonnes of copper over four years go to U.S. data centres (Rio Tinto, January 2026). The deal makes the data center both the customer and the computing host; DC Market Insights counts only the hosting side, part of USD 781.44 million of 2025 hosting fees.
Steelmakers Put AI on the Mill Floor
POSCO DX said in August 2026 that it operates more than 200 AI agents for POSCO Group companies, and in April 2026 it invested KRW 3 billion in neural processing unit (NPU) maker Mobilint to run AI in group factories without GPUs (POSCO Newsroom, 2026). Steel producers spend USD 1.21 billion on data center capacity in 2025, and on-premises inference is one reason mine site and plant edge grows 11.20% a year.
Private 5G Turns Remote Equipment into Data Streams
Ericsson reported in April 2025 that a private 5G network at Newmont’s Cadia mine delivers up to 175 megabits per second (Mbps) of uplink over 2.5 kilometres, enough for 12 teleremote dozers, where Wi-Fi had handled two machines at 100 metres (Ericsson, April 2025); Nokia counted more than 35 mining customers at over 60 mines on its private wireless networks (Nokia, March 2022). Each video-linked machine adds load to the operations centre, part of the USD 1.02 billion remote operations and autonomy workload.
Market Challenges and Restraints: What Slows Metals and Mining Data Center Investment?
Commodity cycles and remote power keep the 2025-2035 CAGR at 9.86%, below the 23.91% of the fastest workload.
Australia’s Export Earnings Fall from A$385 Billion to A$354 Billion
Australia’s Department of Industry, Science and Resources forecast resources and energy export earnings of A$369 billion in 2025-26 and A$354 billion in 2026-27, down from A$385 billion in 2024-25 (Resources and Energy Quarterly, September 2025). Falling iron ore and coal receipts squeeze discretionary IT budgets, which is why DC Market Insights grows Australia at 9.41% a year, below the 9.86% world rate.
Remote Mines Pay Industrial Power Prices for Every Server
Antofagasta plc paid a weighted average of US$128 per megawatt-hour (MWh) for 3,724 gigawatt-hours (GWh) in 2025, up from US$125/MWh (Antofagasta plc, Annual Report 2025), and Chile’s grid operator places most planned data center demand in the Santiago region, not the northern mining districts (Coordinador Eléctrico Nacional, October 2026). Expensive, constrained power at the mine keeps site rooms small and pushes heavier compute to cities, holding electrical and mechanical infrastructure to 4.42% a year.
Market Opportunities: Where Will New Metals and Mining Data Center Demand Come From?
Critical-mineral policy and copper-belt AI programmes add about USD 1.29 billion of yearly spending by battery and critical minerals producers alone by 2035.
EU Critical Raw Materials Act Sets 2030 Benchmarks
Regulation (EU) 2024/1252 sets 2030 benchmarks of 10% of EU strategic raw material consumption from EU extraction, 40% from EU processing and 25% from recycling, with no single third country above 65% (EUR-Lex, May 2024), and U.S. Executive Order 14241 of 20 March 2025 orders priority lists of mineral production projects (The White House, March 2025). New processing plants are designed with plant edge rooms and hosted systems from day one; DC Market Insights values battery and critical minerals producers at USD 371.31 million in 2025, rising to USD 1.66 billion by 2035.
Codelco and Microsoft Open the Chilean Copper Belt to AI
Codelco signed an 18-month agreement with Microsoft in March 2026 covering data, advanced analytics, AI and more autonomous operations, and enabled 5,500 Microsoft 365 Copilot licences in September 2026 (Codelco, 2026). Chile produced about 5.4 Mt of copper in 2025 according to the Chilean Copper Commission (Cochilco), and DC Market Insights grows Chile’s metals and mining data center spending from USD 222.78 million to USD 677.31 million at 11.76% a year.
Pricing Analysis: What Does Metals and Mining Spend per MW of Data Center Capacity?
USD 4.22 million per MW of IT load in use in 2025, rising to USD 5.53 million by 2035 as AI racks raise the hardware bill per MW.
| Year | IT load in use (MW) | Market (USD million) | Spend per MW (USD million) | AI share of load |
|---|---|---|---|---|
| 2020 | 820 | 3,028.89 | 3.69 | 1% |
| 2025 | 1,100 | 4,641.34 | 4.22 | 5% |
| 2030 | 1,560 | 7,764.05 | 4.98 | 15% |
| 2035 | 2,150 | 11,882.55 | 5.53 | 24% |
Public price anchors: DC Market Insights prices colocation and hosting at USD 185 per kilowatt (kW) per month in 2025, so 352 leased MW x USD 185 x 12 = USD 781.44 million; IT hardware costs USD 2.70 million per conventional MW-year and USD 8.00 million per AI MW-year. Power is a separate operating cost that sits outside this market: Antofagasta’s US$128/MWh average implies about USD 1.12 million a year for each MW run around the clock.
Standards and Regulation: Which Rules Shape Metals and Mining Data Center Design?
Four rule sets decide where mining data sits and how it is protected, covering buyers that make up 73% of 2025 spending in Asia Pacific, Europe and North America.
- EU Critical Raw Materials Act: Regulation (EU) 2024/1252, in force May 2024, with 2030 extraction, processing and recycling benchmarks and strategic-project reporting (Source: EUR-Lex).
- U.S. Executive Order 14241: “Immediate Measures to Increase American Mineral Production”, 20 March 2025, priority project lists and Defense Production Act delegation (Source: The White House).
- Australia Security of Critical Infrastructure Act 2018: covers 11 sectors including data storage or processing, but no mining sector, so mine data systems fall under it only when hosted by a covered data storage provider (Source: Cyber and Infrastructure Security Centre).
- Chile National Data Center Plan: announced 5 December 2024 by the Ministry of Science with about US$4 billion of expected investment and 30 new projects by 2028, centred on Santiago (Source: Ministry of Science, Technology, Knowledge and Innovation).
Metals and Mining Data Center Market Segmentation: Which Segment Spends Most?
IT hardware is the largest component at USD 3.26 billion in 2025, iron ore and diversified miners the largest end user at USD 1.39 billion, and ERP, supply chain and trading the largest workload at USD 1.30 billion.
By Component
| Component | 2025 (USD million) | Share 2025 | 2035 (USD million) | CAGR 2025-2035 |
|---|---|---|---|---|
| IT Hardware | 3,261.50 | 70.3% | 8,246.25 | 9.72% |
| Colocation and Hosting Services | 781.44 | 16.8% | 2,714.24 | 13.26% |
| Electrical and Mechanical Infrastructure | 411.40 | 8.9% | 633.92 | 4.42% |
| Construction and Fit-Out | 187.00 | 4.0% | 288.14 | 4.42% |
By End User
| End User | 2025 (USD million) | Share 2025 | 2035 (USD million) | CAGR 2025-2035 |
|---|---|---|---|---|
| Iron Ore and Diversified Miners | 1,392.40 | 30.0% | 3,327.11 | 9.10% |
| Copper Gold and Base Metal Miners | 1,113.92 | 24.0% | 2,970.64 | 10.31% |
| Steel Producers | 1,206.75 | 26.0% | 2,614.16 | 8.04% |
| Aluminium and Non-Ferrous Smelters | 556.96 | 12.0% | 1,307.08 | 8.90% |
| Battery and Critical Minerals Producers | 371.31 | 8.0% | 1,663.56 | 16.18% |
By Workload
| Workload | 2025 (USD million) | Share 2025 | 2035 (USD million) | CAGR 2025-2035 |
|---|---|---|---|---|
| Remote Operations and Autonomy | 1,021.09 | 22.0% | 2,851.81 | 10.82% |
| Geology Mine Planning and Digital Twins | 649.79 | 14.0% | 1,663.56 | 9.86% |
| Process Control and Plant Systems | 928.27 | 20.0% | 1,901.21 | 7.43% |
| ERP Supply Chain and Trading | 1,299.58 | 28.0% | 2,138.86 | 5.11% |
| Mining AI and Computer Vision | 278.48 | 6.0% | 2,376.51 | 23.91% |
| Backup Security and Other Workloads | 464.13 | 10.0% | 950.60 | 7.43% |
By Deployment Model
| Deployment Model | 2025 (USD million) | Share 2025 | 2035 (USD million) | CAGR 2025-2035 |
|---|---|---|---|---|
| Corporate Data Centers | 1,717.29 | 37.0% | 1,901.21 | 1.02% |
| Mine Site and Plant Edge | 1,438.82 | 31.0% | 4,158.89 | 11.20% |
| Colocation and Hosted Private Cloud | 1,485.23 | 32.0% | 5,822.45 | 14.64% |
DC Exclusive: Mine Remote Operations and Autonomy Tracker, 9 Programmes Led by Komatsu’s 1,000 Autonomous Haul Trucks
The DC Market Insights Mine Remote Operations and Autonomy Tracker is a DC Market Insights estimate built on 9 inputs from company disclosures; it shows where the USD 1.02 billion remote operations and autonomy workload of 2025 actually runs.
| Programme | Location | Disclosed scale | Date | Where the data runs |
|---|---|---|---|---|
| Komatsu FrontRunner | Global, 1,000 ultra-class trucks | 1,000th truck commissioned; more than 11.5 billion tonnes hauled | April 2026 | Fleet control servers at site, analytics in remote centres |
| Caterpillar Command for hauling | Global | Target of more than 2,000 autonomous trucks by 2030 | November 2025 | Site and operations-centre servers |
| Fortescue Hive | Perth, Pilbara | More than 200 autonomous trucks, about 500 Mtpa moved, 4,000 ore cars | 2026 | Integrated operations centre |
| Rio Tinto Perth Operations Centre | Perth, 7 sites | 40 autonomous drills; mine automation data from 98% of sites | 2026 | Operations centre plus cloud |
| BHP Escondida Norte | Chile | First full autonomous haulage pit, 33 trucks | June 2025 | Microsoft Azure hosts global applications |
| Freeport-McMoRan Bagdad | Arizona | First major U.S. mine with a fully autonomous haul fleet | 2025 | Site edge plus leach analytics |
| Newmont Cadia | New South Wales | Private 5G, 175 Mbps uplink, up to 12 teleremote dozers | April 2025 | Underground and surface teleremote |
| Antofagasta Centinela | Chile | LTE for autonomous operations at Encuentro Sulphides; integrated remote operating centres | 2025 | Remote operating centres |
| Codelco | Chile | 18-month AI and autonomy agreement with Microsoft; 5,500 Copilot licences | March and September 2026 | Microsoft cloud |
The pattern is two-tier: fleet control stays on servers at the mine because a haul truck needs answers in milliseconds, while planning, analytics and AI move to operations centres in Perth, Santiago and Phoenix and to Microsoft and AWS clouds. DC Market Insights models that split as mine site and plant edge at 31.0% of 2025 value and colocation and hosted private cloud at 32.0%, with hosted capacity reaching 49.0% by 2035.
Which Region Leads the Metals and Mining Data Center Market?
Asia Pacific leads with USD 1.86 billion or 40.0% of 2025 value, and the Middle East and Africa grows fastest at 11.44% a year.
| Region | 2025 (USD million) | Share 2025 | 2035 (USD million) | CAGR 2025-2035 |
|---|---|---|---|---|
| Asia Pacific | 1,856.54 | 40.0% | 4,871.85 | 10.13% |
| Latin America | 649.79 | 14.0% | 1,782.38 | 10.62% |
| Europe | 696.20 | 15.0% | 1,425.91 | 7.43% |
| North America | 835.44 | 18.0% | 2,020.03 | 9.23% |
| Middle East and Africa | 603.37 | 13.0% | 1,782.38 | 11.44% |
Asia Pacific
USD 1.86 billion in 2025 (40.0%). China produced 960.81 Mt of crude steel in 2025, down 4.4%, and 5.97 million servers, up 12.6% (National Bureau of Statistics of China, February 2026); India’s crude steel output rose about 10.7% to roughly 168.4 Mt in fiscal 2025-26 (Press Information Bureau, April 2026), which makes India the fastest large country at 14.40% a year.
North America
USD 835.44 million in 2025 (18.0%). USGS valued U.S. metal mine production at USD 38.1 billion in 2025, up 13% (USGS Mineral Commodity Summaries 2026), and Natural Resources Canada put Canada’s mineral production at C$64.3 billion in 2024; Nucor bought data center containment maker Southwest Data Products for US$115 million in April 2024, a sign that steelmakers also sell into the data center build-out.
Europe
USD 696.20 million in 2025 (15.0%). Europe grows slowest at 7.43% a year because steel output is flat, but the Critical Raw Materials Act’s 40% processing benchmark for 2030 brings new refineries and their plant edge rooms.
Latin America
USD 649.79 million in 2025 (14.0%). Chile produced about 5.4 Mt of copper in 2025 (Cochilco, December 2025) and Vale’s Brucutu mine in Brazil became the country’s first fully autonomous mine with 13 trucks (Vale, June 2021); Latin America grows 10.62% a year, led by Chile at 11.76%.
Middle East and Africa
USD 603.37 million in 2025 (13.0%). Saudi Arabian Mining Company (Ma’aden) reported FY2025 revenue of US$10.3 billion, up 19% (Ma’aden, March 2026), South Africa’s mineral sales reached R861.1 billion in 2025 (Statistics South Africa, March 2026), and the Democratic Republic of the Congo mined about 73% of world cobalt (USGS, February 2026); Saudi Arabia is the fastest country in the top 12 at 16.18% a year.
Top 12 Countries in the Metals and Mining Data Center Market
China is the largest country at USD 928.27 million in 2025, and India is the fastest large country at 14.40% a year as steel capacity passes 220 Mt.
| Rank | Country | Region | 2025 (USD million) | 2035 (USD million) | CAGR 2025-2035 |
|---|---|---|---|---|---|
| 1 | China | Asia Pacific | 928.27 | 2,257.68 | 9.29% |
| 2 | United States | North America | 580.17 | 1,366.49 | 8.94% |
| 3 | Australia | Asia Pacific | 464.13 | 1,140.72 | 9.41% |
| 4 | Brazil | Latin America | 241.35 | 653.54 | 10.47% |
| 5 | Chile | Latin America | 222.78 | 677.31 | 11.76% |
| 6 | Canada | North America | 208.86 | 510.95 | 9.36% |
| 7 | India | Asia Pacific | 185.65 | 712.95 | 14.40% |
| 8 | Japan | Asia Pacific | 148.52 | 297.06 | 7.18% |
| 9 | South Africa | Middle East and Africa | 139.24 | 356.48 | 9.86% |
| 10 | Russia | Europe | 129.96 | 285.18 | 8.18% |
| 11 | Germany | Europe | 116.03 | 237.65 | 7.43% |
| 12 | Saudi Arabia | Middle East and Africa | 92.83 | 415.89 | 16.18% |
The top 12 countries hold 74.5% of 2025 value; Indonesia, Peru, Mexico, Kazakhstan and the Democratic Republic of the Congo make up most of the rest.
Forecast Scenarios: How Large Could the Metals and Mining Data Center Market Be in 2035?
The base case reaches USD 11.88 billion by 2035, inside a range of USD 9.98 billion to USD 13.90 billion.
| Scenario | 2035 (USD million) | CAGR 2025-2035 | Main assumption |
|---|---|---|---|
| Low | 9,981.34 | 7.96% | Commodity downturn delays autonomy and AI share stays near 18% |
| Base | 11,882.55 | 9.86% | IT load reaches 2,150 MW, 24% AI |
| High | 13,902.58 | 11.60% | Critical-mineral build-out and copper AI programmes run ahead of plan |
Low Scenario
USD 9.98 billion by 2035 if metal prices fall and miners defer autonomy roll-outs, as Australia’s forecast export decline to A$354 billion in 2026-27 suggests is possible.
Base Scenario
USD 11.88 billion by 2035, with IT load in use rising from 1,100 MW to 2,150 MW and the leased share from 32% to 49%.
High Scenario
USD 13.90 billion by 2035 if Caterpillar’s 2,000-truck target, the EU processing benchmark and copper-belt AI programmes all land on time.
Key Players and Market Share: Who Spends and Supplies in the Metals and Mining Data Center Market?
The ten largest mining and metals groups account for about 34% of 2025 spending (DC Market Insights estimate based on their share of world output), while two clouds host most of the moved workloads.
- BHP
- Rio Tinto
- Vale
- Freeport-McMoRan
- Fortescue
- Codelco (Corporación Nacional del Cobre de Chile)
- Antofagasta plc
- Newmont
- Nucor
- POSCO Group
- Saudi Arabian Mining Company (Ma’aden)
- Komatsu
- Caterpillar
- Microsoft
- Amazon Web Services
- Ericsson
- Nokia
Platform Hosting Concentration, 2025
BHP hosts its global applications on Microsoft Azure and uses AWS for analytics, Codelco signed with Microsoft in 2026, and Rio Tinto works with AWS on Nuton; with Komatsu and Caterpillar supplying most autonomous trucks, the data that fills mining data centers comes from a short list of suppliers, which is why colocation and hosted private cloud already holds 32.0% of 2025 spending.
Recent Developments in the Metals and Mining Data Center Market
Six dated events since early 2026 show mining data moving to operations centres, clouds and AI.
- In October 2026, BHP reported technology initiatives at an EBITDA run rate of almost US$500 million (Source: BHP).
- In September 2026, Codelco enabled 5,500 Microsoft 365 Copilot licences (Source: Codelco).
- In August 2026, POSCO DX reported more than 200 AI agents in use across POSCO Group (Source: POSCO Newsroom).
- In April 2026, Komatsu commissioned its 1,000th autonomous ultra-class haul truck (Source: Komatsu).
- In March 2026, Codelco and Microsoft signed an 18-month data, AI and autonomy agreement (Source: Codelco).
- In January 2026, Rio Tinto and Amazon Web Services agreed cloud analytics support for Nuton copper and copper supply to U.S. data centres (Source: Rio Tinto).
Research Methodology: How DC Market Insights Sized the Metals and Mining Data Center Market
The USD 4.64 billion 2025 value is a bottom-up DC Market Insights model of 1,100 MW of metals and mining IT load in use, about 2.4% of the roughly 46 gigawatts (GW) of enterprise and colocation capacity inside the 116 GW installed base, priced component by component; see the DC Market Insights research methodology.
Model Inputs
Metals and mining IT load in use of 820, 1,100, 1,560 and 2,150 MW in 2020, 2025, 2030 and 2035; leased share 22%, 32%, 42% and 49%; AI share 1%, 5%, 15% and 24%. IT hardware costs USD 2.70 million per conventional MW-year and USD 8.00 million per AI MW-year in 2025, so 1,045 conventional MW and 55 AI MW give USD 3.26 billion; colocation and hosting average USD 185 per kW-month on 352 leased MW. Owned-site electrical and mechanical spending is USD 411.40 million and construction and fit-out USD 187.00 million. Sibling estimates use the same base: the Manufacturing Data Center Market and the Oil and Gas Data Center Market; mine site and plant server rooms are a subset of the Edge Data Center Market, and hosting fees are a slice of the Data Center Colocation Market.
Bound Checks
Ceiling 1: USD 4.64 billion is 0.81% of the DC Market Insights global data center market of USD 570.04 billion in 2025, between agriculture (0.49%) and manufacturing (3.7%). Ceiling 2: the U.S. share of USD 580.17 million equals 0.52% of U.S. nonfuel mineral production of USD 112 billion (USGS). Floor: about 1,700 autonomous trucks (Komatsu’s 1,000 plus a Caterpillar fleet that triples to 2,000 by 2030) at an assumed USD 100,000 a year of data center spend each give USD 170 million, below the USD 1.02 billion remote operations and autonomy workload. Every split sums to the total in every year, and the CAGR is recomputed from the 2025 and 2035 endpoints.
Table of contents
- 01Introduction
- 1.1Market Definition
- 1.2Report Scope
- 02Key Market Statistics
- 2.1Market Size 2025, 2026, 2030 and 2035
- 2.2Leading Segments, Regions and Countries
- 03Executive Summary
- 3.1Market Snapshot, 2025, 2026 and 2035
- 3.2Metals and Mining Data Center Market Size, 2020-2035
- 04Market Scope
- 4.1Included Spending
- 4.2Excluded Spending
- 4.3How the Segments Fit Together
- 05Why Estimates Differ
- 5.1Scope Comparison Table
- 5.2In-Scope Buyer Groups
- 06Market Drivers
- 6.1Komatsu's 1,000 Autonomous Ultra-Class Trucks and the Data They Generate
- 6.2Leach Analytics Add Copper Without New Pits
- 6.3BHP's US$500 Million EBITDA Run Rate from Technology
- 07Market Trends
- 7.1Rio Tinto Sells Nuton Copper to Amazon's Data Centers
- 7.2Steelmakers Put AI on the Mill Floor
- 7.3Private 5G Turns Remote Equipment into Data Streams
- 08Market Challenges and Restraints
- 8.1Australia's Export Earnings Fall from A$385 Billion to A$354 Billion
- 8.2Remote Mines Pay Industrial Power Prices for Every Server
- 09Market Opportunities
- 9.1EU Critical Raw Materials Act Sets 2030 Benchmarks
- 9.2Codelco and Microsoft Open the Chilean Copper Belt to AI
- 10Pricing Analysis
- 10.1Spending per MW, 2020-2035
- 10.2Public Price Anchors
- 11Standards and Regulation
- 11.1EU Critical Raw Materials Act
- 11.2U.S. Executive Order 14241
- 11.3Australia Security of Critical Infrastructure Act 2018
- 11.4Chile National Data Center Plan
- 12Market Segmentation by Component
- 12.1IT Hardware
- 12.2Colocation and Hosting Services
- 12.3Electrical and Mechanical Infrastructure
- 12.4Construction and Fit-Out
- 13Market Segmentation by End User
- 13.1Iron Ore and Diversified Miners
- 13.2Copper Gold and Base Metal Miners
- 13.3Steel Producers
- 13.4Aluminium and Non-Ferrous Smelters
- 13.5Battery and Critical Minerals Producers
- 14Market Segmentation by Workload
- 14.1Remote Operations and Autonomy
- 14.2Geology Mine Planning and Digital Twins
- 14.3Process Control and Plant Systems
- 14.4ERP Supply Chain and Trading
- 14.5Mining AI and Computer Vision
- 14.6Backup Security and Other Workloads
- 15Market Segmentation by Deployment Model
- 15.1Corporate Data Centers
- 15.2Mine Site and Plant Edge
- 15.3Colocation and Hosted Private Cloud
- 16DC Exclusive: Mine Remote Operations and Autonomy Tracker
- 16.1Komatsu FrontRunner
- 16.2Caterpillar Command for Hauling
- 16.3Fortescue Hive
- 16.4Rio Tinto Perth Operations Centre
- 16.5BHP Escondida Norte
- 16.6Freeport-McMoRan Bagdad
- 16.7Newmont Cadia
- 16.8Antofagasta Centinela
- 16.9Codelco
- 17Regional Insights
- 17.1Asia Pacific
- 17.2North America
- 17.3Europe
- 17.4Latin America
- 17.5Middle East and Africa
- 18Country Analysis
- 18.1China
- 18.2United States
- 18.3Australia
- 18.4Brazil
- 18.5Chile
- 18.6Canada
- 18.7India
- 18.8Japan
- 18.9South Africa
- 18.10Russia
- 18.11Germany
- 18.12Saudi Arabia
- 19Forecast Scenarios
- 19.1Low Scenario
- 19.2Base Scenario
- 19.3High Scenario
- 20Competitive Insights
- 20.1BHP
- 20.2Rio Tinto
- 20.3Vale
- 20.4Freeport-McMoRan
- 20.5Fortescue
- 20.6Codelco
- 20.7Antofagasta plc
- 20.8Newmont
- 20.9Nucor
- 20.10POSCO Group
- 20.11Saudi Arabian Mining Company (Ma'aden)
- 20.12Komatsu
- 20.13Caterpillar
- 20.14Microsoft
- 20.15Amazon Web Services
- 20.16Ericsson
- 20.17Nokia
- 20.18Platform Hosting Concentration, 2025
- 21Recent Developments
- 21.1Dated Developments, January to October 2026
- 22Research Methodology
- 22.1Model Inputs
- 22.2Bound Checks
- Fig. 1Metals and Mining Data Center Market Size, 2020-2035
- Table 1Executive Summary Attributes
- Table 2Scope Comparison
- Table 3Spending per MW, 2020-2035
- Table 4Market by Component, 2025 and 2035
- Table 5Market by End User, 2025 and 2035
- Table 6Market by Workload, 2025 and 2035
- Table 7Market by Deployment Model, 2025 and 2035
- Table 8Mine Remote Operations and Autonomy Tracker
- Table 9Market by Region, 2025 and 2035
- Table 10Top 12 Countries, 2025 and 2035
- Table 11Forecast Scenarios, 2035
About this report
Written by Amit Jain and reviewed by Deepti Agrawal, Senior Editor, Research. Figures are built top-down and bottom-up and reconciled before publication, with 2025 as the base year.
Read our methodologyHow we built this
- Historical period2020-2024
- Base year2025
- Forecast period2026-2035
- Sizing approachTop-down + bottom-up
Need more than the report?
Advisory on this market
Due diligence, site selection and market entry work, by the analysts who wrote this report.
See consulting servicesFrequently asked questions
USD 5.22 billion in 2026, up 12.53% from USD 4.64 billion in 2025, according to DC Market Insights estimates. The market is projected to reach USD 11.88 billion by 2035, a CAGR of 9.86% from 2025.
9.86% a year from 2025 to 2035, after 8.91% a year from 2020 to 2025, as mining and metals IT load in use rises from 1,100 MW to 2,150 MW and AI climbs from 5% to 24% of it.
USD 4.64 billion in 2025 was spent on data center capacity that miners, smelters, steelmakers and battery-material processors own or lease. Autonomous truck hardware, mine software, private networks and public cloud fees are not counted.
USD 1.02 billion of 2025 spending runs remote operations and autonomy. Komatsu commissioned its 1,000th autonomous ultra-class truck in April 2026, and each fleet streams data to site servers and operations centres.
Mining AI and computer vision grows fastest at 23.91% a year to USD 2.38 billion by 2035; among end users, battery and critical minerals producers lead at 16.18%.
Almost US$500 million a year of EBITDA at BHP by the end of fiscal 2026, with more than US$650 million targeted for fiscal 2027, from AI, automation and other technology initiatives.
Asia Pacific, with USD 1.86 billion or 40.0% of 2025 value. The Middle East and Africa grows fastest at 11.44% a year, and India is the fastest large country at 14.40%.
USD 222.78 million in 2025, rising to USD 677.31 million by 2035 at 11.76% a year, as Codelco’s 2026 Microsoft agreement brings AI and autonomy to the copper belt.
Yes: colocation and hosted private cloud is USD 1.49 billion or 32.0% of 2025 spending, rising to USD 5.82 billion by 2035. BHP hosts its global applications on Microsoft Azure.
USD 5.22 billion in 2026 counts only capacity mining and metals companies own or lease. Digital-mining estimates that add autonomous haulage kits, fleet software, private LTE networks, drones and sensors come out many times larger.
Get this report
How do I get the full report?
Request a quote; we reply by email within one business day.
How and when will I receive the report?
By email, within 24–48 business hours of payment.
How can I pay?
Once you accept the quote, we email you a secure payment link.
Can I see a sample first?
Yes. Request a free sample and we will email it to you.
Can the report be tailored to my needs?
Yes. We can add countries, segments or data cuts. Talk to an analyst about the scope you need.
Can I get an invoice or pay against a purchase order?
Write to sales@dcmarketinsights.com and our team will help.