
Mexico Edge Data Center Market Size, Share & Forecast to 2035
Market at a glance
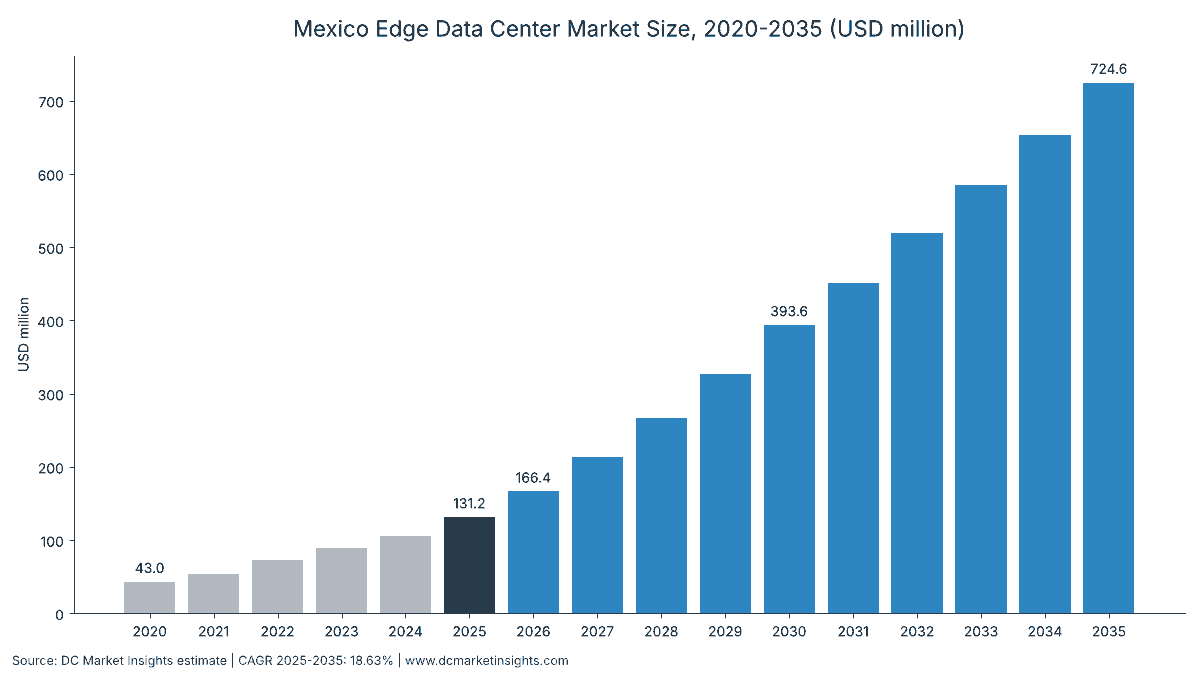
The Mexico Edge Data Center market was worth USD 131.2 million in 2025 and is forecast to reach USD 724.6 million by 2035, growing at a 18.63% CAGR.
 By Amit Jain, Senior Consultant, ICT & Emerging Technologies
 Reviewed by Deepti Agrawal
Last updated 19 Oct 2026
Base year 2025 PDF + Excel
Key findings
CFE Grid Capacity Is Pulled Toward 1,705 MW of Large Campuses
What is inside the report
- 01Introduction
- 02Research Methodology
- 03Executive Summary
- 04Market Dynamics
- 05Pricing Analysis
- 06Standards and Regulation
- 07Market Segmentation
- 08DC Exclusive: Mexico Edge Footprint Tracker
- 09Regional Insights
- 10State Analysis
- 13chapters
- 2020-2024Historical period
- 2026-2035Forecast period
- —Companies profiled
Segmentation
Full analysis
The Mexico Edge Data Center Market is valued at USD 166.40 million in 2026 and is projected to reach USD 724.63 million by 2035, up from USD 131.22 million in 2025, a CAGR of 18.63% from 2025 to 2035 (DC Market Insights estimate). Edge money in Mexico moves in very small units: MTP, the DigitalBridge-backed operator, ran some 59 edge sites in 19 cities on just 11 MW of power, or about 0.19 MW per site, so every new city node adds cost per megawatt that a Querétaro campus never pays. Telcel’s fifth-generation (5G) network reached close to 60% of the population at the end of 2025, and Nuevo León drew USD 3.62 billion of foreign direct investment (FDI) in 2025, up 72.9%, which pulls compute toward Monterrey’s factories and away from the Bajío core. DC Market Insights adds 5.5 MW of new edge IT capacity in 2025 at USD 12.0 million of facility content per MW (USD 66.00 million), plus edge IT hardware of USD 2.3 million per installed MW-year on 26.62 MW (USD 61.23 million) and USD 3.99 million of services, which gives USD 131.22 million. Cloud and CDN Edge Nodes are the fastest-growing edge type at 24.54% a year, because content delivery network (CDN) and cloud operators are adding inference and caching nodes in secondary cities, and the Northeast is the fastest region at 21.31% a year on the nearshoring build-out around Monterrey.
Key Market Statistics: How Big Is the Mexico Edge Data Center Market in 2026?
The Mexico Edge Data Center Market reaches USD 166.40 million in 2026, 26.81% above the USD 131.22 million spent in 2025, according to DC Market Insights estimates.
- Market size 2025: USD 131.22 million (base year)
- Market size 2026: USD 166.40 million
- Market size 2030: USD 393.62 million
- Market size 2035: USD 724.63 million; CAGR 2025-2035 of 18.63% (low case USD 536.22 million, high case USD 895.45 million)
- Installed edge IT capacity: 29.13 MW at the end of 2025, rising to 160.52 MW by 2035
- Largest component: Edge IT Hardware, 46.7% of 2025 spend (USD 61.23 million)
- Fastest-growing edge type: Cloud and CDN Edge Nodes, 24.54% a year to 2035
- Leading region: Valley of Mexico, 36.0% of 2025 spend (USD 47.24 million)
- Fastest-growing region: Northeast, 21.31% a year; fastest large state Nuevo León at 21.64%
- Largest state: Mexico City, USD 33.07 million in 2025
- Market leaders: MTP and Megacable among edge operators; Schneider Electric and Vertiv among infrastructure suppliers
Key Takeaways: What Do 0.19 MW Sites and 5G Coverage Mean for Mexico Edge Data Center Buyers?
Four findings explain why Mexico edge data center spend grows 18.63% a year while the edge share of national capacity falls.
- Edge IT Hardware takes 46.7% of 2025 spend (USD 61.23 million) because servers, storage and switches are refreshed on the whole installed edge base every year, while facility spend only follows new sites.
- Cloud and CDN Edge Nodes grow fastest at 24.54% a year because streaming, gaming and AI inference traffic from 100.2 million internet users is served from Guadalajara, Monterrey and Mérida instead of only Mexico City.
- The Northeast grows 21.31% a year because factories in Nuevo León, Coahuila and Tamaulipas install on-premise micro data centers to run production lines that cannot wait for a round trip to Querétaro.
- Edge capacity falls from 12.4% of national installed capacity in 2025 to about 5.2% in 2030 because hyperscale AI campuses grow faster, so edge buyers compete with them for UPS, cooling and grid connections.
Mexico Edge Data Center Market Summary: What Did Edge Sites in Mexico Cost Buyers Between 2020 and 2025?
The Mexico Edge Data Center Market size was valued at USD 43.01 million in 2020, reached USD 131.22 million in 2025, and is anticipated to reach USD 724.63 million by 2035, at a CAGR of 18.63% during the forecast period.
| Attribute | Detail |
|---|---|
| Historical period | 2020-2024 |
| Base year | 2025 |
| Forecast period | 2026-2035 |
| Market size 2025 | USD 131.22 million |
| Market size 2026 | USD 166.40 million |
| CAGR 2025-2035 | 18.63% |
| Market size 2035 | USD 724.63 million |
| Segments covered | Component, Edge Type, End User |
| Regions covered | Valley of Mexico, Northeast, Bajío and West, Northwest, South and Southeast |
Spending grew 24.99% a year from 2020 to 2025 as installed edge IT capacity rose from 10.82 MW to 29.13 MW; even in the COVID-19 years spend rose 25.9% in 2021, because remote work and streaming pushed CDN and telco edge capacity out of Mexico City. Growth eases to 18.63% a year because new edge capacity rises from 5.5 MW in 2025 to 15.0 MW in 2030 and 20.5 MW in 2035, while the facility cost per MW rises only 2% a year. DC Market Insights values the 2030 market at USD 393.62 million, of which facility build is USD 198.73 million, edge IT hardware USD 181.80 million and services USD 13.09 million.
What Is a Mexico Edge Data Center, and What Does This Market Leave Out?
A Mexico edge data center is a site of up to 5 MW of IT load placed close to users or machines, and DC Market Insights counts USD 131.22 million of 2025 spend on such sites.
Included
The market covers four edge types: telco and cable network edge rooms (central offices and cable headends converted to host servers), regional colocation edge sites in secondary cities, cloud and CDN edge nodes (including local zones and caching points of presence), and enterprise on-premise micro data centers in factories, hospitals, bank branches and stores. Spend includes power infrastructure (UPS, switchgear, batteries and generators), cooling, enclosures, racks and prefabricated modules, edge IT hardware installed at those sites, and installation and managed services.
Excluded
Campuses and halls above 5 MW of IT load are excluded; they sit in the Mexico Data Center Market and, for AI halls, the Mexico AI Data Center Market. Colocation rent, electricity bills, telecom towers and radio access network equipment, end-user devices, and software subscriptions are also left out.
Edge Computing for Federal Government, Retail and IT and Telecom Buyers
Mexico federal edge computing and Mexico retail edge computing demand both sit inside this market as buyers: Retail and Government hold 15.0% of 2025 edge spend and grow 17.82% a year to 2035, as stores, tax offices and state agencies run local servers. Government initiatives such as the 2025 telecom law and Plan México industrial parks shape where these sites go. IT and telecom operators remain the largest buyer group, with Telecom and Media at 34.0% of 2025 spend. Software defined data center (SDDC) platforms that virtualise compute, storage and networking are software and are counted only through the edge IT hardware they run on, so the Mexico software defined data center market is a separate, software-only scope.
How the segments fit together
Each USD of 2025 spend appears once in each dimension: by component (five lines summing to USD 131.22 million), by edge type (four lines) and by end user (five lines). Regions and states split the same total.
Why Do Mexico Edge Data Center Market Estimates Differ?
The 2026 value of USD 166.40 million counts only sites up to 5 MW, so estimates that call any Mexican data center outside Querétaro “edge” are several times larger.
Broader definitions add regional colocation halls of 10 MW to 30 MW in Monterrey and Guadalajara, the IT hardware inside hyperscale local zones, edge software platforms, and the radio and fibre equipment of 5G networks. An earlier edition of this page used such a wide scope and showed USD 431.28 million for 2025. DC Market Insights keeps the 5 MW ceiling because a 0.19 MW city node and a 20 MW regional hall have different cost structures, buyers and suppliers.
| Element | In scope here | Why |
|---|---|---|
| Sites up to 5 MW IT load | Yes, USD 131.22 million in 2025 | Core edge definition |
| Edge IT hardware at those sites | Yes, USD 61.23 million in 2025 | Bought with the site |
| Halls above 5 MW | No | Covered by the national report |
| 5G radio and fibre | No | Telecom network spend |
| Edge software and platforms | No | Recurring software, not site spend |
Edge software platforms, 5G radio equipment, colocation rent and hyperscale campuses are therefore out of scope, while small and medium-sized enterprises (SMEs) buying a single micro data center, retailers, banks, hospitals and state governments are in scope as buyers.
Why Are Operators Adding Edge Data Centers Across Mexican Cities?
Three drivers lift new Mexico edge capacity from 5.5 MW in 2025 to 15.0 MW in 2030, and each one is specific to Mexico.
Telcel’s 5G Footprint Reaching 60% of Mexicans Pushes Compute Into 125 Cities
Telcel’s 5G network covered close to 60% of the population at the end of 2025, across about 125 cities against 56 for AT&T and 38 for Telefónica, according to América Móvil figures reported in May 2026. Low-latency services only work when servers sit within a few milliseconds of the radio, so each new 5G city needs a local edge room. DC Market Insights estimates that telco and cable network edge spend reaches USD 47.24 million in 2025 and USD 195.65 million in 2035, a 15.27% CAGR.
Nearshoring FDI in Nuevo León Up 72.9% Creates Factory Micro Data Centers
Mexico recorded a record USD 40.87 billion of FDI in 2025, up 10.8%, according to the Secretaría de Economía (SE), and Nuevo León alone captured USD 3.62 billion, up 72.9% (Source: Secretaría de Economía via El CEO). New plants run machine vision, robotics and quality-control systems that need on-site compute. Manufacturing and logistics buyers spend USD 26.24 million on edge sites in 2025, rising to USD 181.16 million by 2035 at 21.31% a year.
100.2 Million Internet Users Drive CDN and Local-Zone Nodes Outside Mexico City
The Instituto Nacional de Estadística y Geografía (INEGI) counted 100.2 million internet users in its 2024 ENDUTIH survey, 83.1% of people aged six and over, and 97.2% of them connect by smartphone, according to the INEGI release of May 2025. Video, gaming and payments traffic from those users is now cached in Guadalajara and Querétaro, which lifts Cloud and CDN Edge Nodes from USD 21.00 million in 2025 to USD 188.40 million in 2035.
Which Shifts Are Changing How Mexico Edge Data Centers Are Built?
Two trends move the Mexico edge market toward denser, prefabricated sites, lifting the facility cost per edge MW from USD 12.0 million in 2025 to USD 14.63 million by 2035.
Cloud Providers Opening Second-City Nodes in Guadalajara and Querétaro
Cloudflare added a data center location in Guadalajara in November 2024, extending a footprint “from Mexico City to Queretaro—and now Guadalajara”, according to the Cloudflare press release. Amazon Web Services (AWS) opened a Local Zone in Querétaro in early 2023 to cut latency for gamers and streaming users (Source: AWS via Expansión). Each such node is a small, fast-refreshed IT deployment, which is why Edge IT Hardware grows 20.48% a year.
Inference at the Edge Raises Cooling Content per Site
AI inference servers at edge sites draw more power per rack than caching servers, so DC Market Insights lifts the cooling share of edge facility spend from 24% in 2025 to 28% by 2035. Cooling Infrastructure grows from USD 15.84 million in 2025 to USD 83.96 million in 2035, an 18.15% CAGR, faster than Power Infrastructure at 16.34%.
Prefabricated Modules Replace Built Rooms for Factory Sites
Factory and branch buyers prefer factory-built enclosures with integrated UPS and cooling because they arrive tested and can be moved. Enclosures and Prefabricated Modules hold 17.1% of 2025 Mexico edge data center spend and grow 14.90% a year to 2035 (DC Market Insights estimate).
Market Restraints: Can Grid Power and Site Economics Keep Up With Mexico Edge Demand?
Two restraints hold the base case to 18.63% a year; without them, the high case reaches USD 895.45 million by 2035.
CFE Grid Capacity Is Pulled Toward 1,705 MW of Large Campuses
The Comisión Federal de Electricidad (CFE) and the Asociación Mexicana de Data Centers (MEXDC) agreed in September 2026 on a route to serve 1,705 MW of data center demand (Source: DCD), most of it from hyperscale campuses. Edge sites in secondary cities queue for the same transformers and substations, and a delay of a year on 25% of new edge megawatts is the low case, which ends at USD 536.22 million in 2035.
Small Sites Carry Higher Cost per MW
MTP’s network averaged about 0.19 MW per site, and DC Market Insights prices an edge megawatt at USD 12.0 million of facility content in 2025, against about USD 10.0 million for an AI megawatt on a large campus. Uneven 5G coverage also limits how many cities justify a node: an official of the former Instituto Federal de Telecomunicaciones (IFT) put it at around 50% of the population in June 2024 (Source: IFT via Forbes México), and Telcel reported close to 60% by end-2025.
Where Will Mexico Edge Data Center Suppliers Earn the Most After 2027?
Two opportunities add USD 159.53 million of annual spend between 2025 and 2035 for suppliers that target them.
Industrial-Park Micro Data Centers in 477 Parks
The Asociación Mexicana de Parques Industriales (AMPIP) counted 477 industrial parks in operation in August 2026, with 20 new Plan México parks starting operations (Source: AMPIP via The Logistics World). Enterprise On-Premise Micro Data Centers reach USD 159.42 million by 2035, up from USD 26.24 million in 2025, a 19.77% CAGR, because plants in these parks need on-site compute for automation.
Managed Services for Hundreds of Unstaffed Sites
Megacable reports more than 735 edge nodes across its national network (Source: Megacable via Players of Life), and none of them can carry permanent staff. Installation and Managed Services, the fastest component at 22.48% a year, grows from USD 3.99 million in 2025 to USD 30.34 million in 2035 as operators outsource remote monitoring and maintenance.
What Does an Edge Data Center Cost in Mexico per MW, per Rack and per Site?
An edge megawatt in Mexico costs USD 12.0 million of facility content in 2025, plus USD 2.3 million a year of edge IT hardware, according to DC Market Insights estimates.
| Price point | 2020 | 2025 | 2030 | 2035 |
|---|---|---|---|---|
| Facility content per edge MW (USD million) | 11.00 | 12.00 | 13.25 | 14.63 |
| Edge IT hardware per installed MW-year (USD million) | 2.00 | 2.30 | 2.50 | 2.60 |
| Services per installed MW-year (USD million) | 0.12 | 0.15 | 0.18 | 0.20 |
At USD 12.0 million per MW, a 50 kW micro data center module costs about USD 0.60 million of facility content and an 8 kW edge rack position about USD 96,000 before IT. The Mexico edge data center price per site therefore runs from about USD 0.60 million for a factory module to about USD 2.28 million for a 0.19 MW city node like MTP’s average site. No Mexican operator publishes an edge colocation price list; DC Market Insights estimates retail edge colocation at USD 190 to USD 260 per kW-month in 2026, above Querétaro wholesale rates because sites are small.
Which Mexican Laws and Standards Apply to Edge Data Centers?
Four federal texts shape Mexico edge sites, and none imposes data localisation, which keeps edge demand driven by latency rather than law.
- Ley en Materia de Telecomunicaciones y Radiodifusión, published in the Diario Oficial de la Federación (DOF) on 16 July 2025, created the Comisión Reguladora de Telecomunicaciones (CRT), which replaces the IFT, according to the Cámara de Diputados text.
- The new Ley Federal de Protección de Datos Personales en Posesión de los Particulares (LFPDPPP), published on 20 March 2025, allows transfers abroad, so Mexican data can still be processed in United States data centers (Source: Orden Jurídico Nacional).
- A DOF agreement of September 2025 sets a simplified procedure for grid-connected self-supply plants of 0.7 MW to 20 MW, according to the DOF notice, which lets larger edge sites add solar and storage.
- Norma Mexicana (NMX) NMX-J-C-I-489-ANCE-ONNCCE-NYCE-2014 sets voluntary requirements for high-performance, sustainable data centers (Source: Secretaría de Economía).
Which Mexico Edge Data Center Segment Is Largest and Which Grows Fastest?
Edge IT Hardware is the largest component at 46.7% of 2025 spend, and Cloud and CDN Edge Nodes are the fastest-growing edge type at 24.54% a year.
By Component
| Component | 2025 (USD million) | Share 2025 | 2035 (USD million) | CAGR 2025-2035 |
|---|---|---|---|---|
| Edge IT Hardware | 61.23 | 46.7% | 394.42 | 20.48% |
| Power Infrastructure | 27.72 | 21.1% | 125.95 | 16.34% |
| Enclosures and Prefabricated Modules | 22.44 | 17.1% | 89.96 | 14.90% |
| Cooling Infrastructure | 15.84 | 12.1% | 83.96 | 18.15% |
| Installation and Managed Services | 3.99 | 3.0% | 30.34 | 22.48% |
By Edge Type
| Edge type | 2025 (USD million) | Share 2025 | 2035 (USD million) | CAGR 2025-2035 |
|---|---|---|---|---|
| Telco and Cable Network Edge | 47.24 | 36.0% | 195.65 | 15.27% |
| Regional Colocation Edge | 36.74 | 28.0% | 181.16 | 17.30% |
| Enterprise On-Premise Micro Data Centers | 26.24 | 20.0% | 159.42 | 19.77% |
| Cloud and CDN Edge Nodes | 21.00 | 16.0% | 188.40 | 24.54% |
By End User
| End user | 2025 (USD million) | Share 2025 | 2035 (USD million) | CAGR 2025-2035 |
|---|---|---|---|---|
| Telecom and Media | 44.61 | 34.0% | 188.40 | 15.49% |
| Manufacturing and Logistics | 26.24 | 20.0% | 181.16 | 21.31% |
| Healthcare and Other | 21.00 | 16.0% | 159.42 | 22.47% |
| BFSI | 19.68 | 15.0% | 94.20 | 16.95% |
| Retail and Government | 19.68 | 15.0% | 101.45 | 17.82% |
Banking, financial services and insurance (BFSI) buyers grow slowest at 16.95% because bank branches already carry small server rooms, while healthcare and other buyers grow 22.47% a year as hospitals digitise imaging.
DC Exclusive: The Mexico Edge Footprint Tracker, 7 Operators Across 19 or More Cities
This tracker is a DC Market Insights model built from 9 inputs (operator site counts, cities, MW and investment disclosures); values for the market are modelled estimates, while operator figures come from the named sources.
| Operator | Edge footprint | Cities | Latest dated move |
|---|---|---|---|
| MTP (DigitalBridge) | About 59-60 edge sites, 11 MW | 19 cities incl. León, Tijuana, Mérida | Mérida phase 2 opened, August 2025 |
| Megacable | More than 735 edge nodes | National cable network | DCD LATAM edge project award, September 2024 |
| Triara (Telmex) | Regional halls | Mexico City, Monterrey, Querétaro, Guadalajara, Cancún | Northern data center planned for 2026, November 2025 |
| Cloudflare | CDN points of presence | Mexico City, Querétaro, Guadalajara | Guadalajara added, November 2024 |
| Amazon Web Services | Local Zone | Querétaro | General availability, January 2023 |
| KIO Data Centers | Core and regional sites | Mexico City, Monterrey, Querétaro | More than USD 200 million for 2026, August 2026 |
| Enterprise micro data centers | DCMI estimate of 20% of 2025 spend | Industrial states | 477 industrial parks operating, August 2026 |
The edge type by component matrix below shows where the USD 131.22 million of 2025 spend lands (USD million, DC Market Insights estimate).
| Edge type | Edge IT Hardware | Power | Cooling | Enclosures and Modules | Services |
|---|---|---|---|---|---|
| Telco and Cable Network Edge | 22.04 | 9.98 | 5.70 | 8.08 | 1.44 |
| Regional Colocation Edge | 17.14 | 7.76 | 4.44 | 6.28 | 1.12 |
| Enterprise On-Premise Micro Data Centers | 12.25 | 5.54 | 3.17 | 4.49 | 0.80 |
| Cloud and CDN Edge Nodes | 9.80 | 4.44 | 2.53 | 3.59 | 0.64 |
The tracker shows that the named operators hold well under half of the 29.13 MW installed base: MTP’s 11 MW is the only disclosed edge megawatt figure, so DC Market Insights assigns the rest to telco rooms, CDN nodes and enterprise modules.
Valley of Mexico or Monterrey: Where Is Mexico Edge Data Center Spending Heading?
The Valley of Mexico leads with 36.0% of 2025 spend (USD 47.24 million), and the Northeast is the fastest region at 21.31% a year.
| Region | 2025 (USD million) | Share 2025 | 2035 (USD million) | CAGR 2025-2035 |
|---|---|---|---|---|
| Valley of Mexico | 47.24 | 36.0% | 210.14 | 16.10% |
| Bajío and West | 28.87 | 22.0% | 159.42 | 18.63% |
| Northeast | 26.24 | 20.0% | 181.16 | 21.31% |
| Northwest | 15.75 | 12.0% | 94.20 | 19.59% |
| South and Southeast | 13.12 | 10.0% | 79.71 | 19.77% |
Valley of Mexico
Mexico City and Estado de México hold most telco central offices and bank branches, but their share falls from 36.0% to 29.0% by 2035 as nodes spread to other cities.
Northeast
Nuevo León’s 72.9% FDI jump in 2025 makes the Northeast the fastest region at 21.31% a year, with Telmex planning a northern data center for 2026 (Source: Telmex via DCD).
Bajío and West
Guadalajara hosts Cloudflare’s newest Mexican node and Querétaro the AWS Local Zone, so the region grows in line with the market at 18.63% a year.
Northwest
Tijuana and Chihuahua plants serving United States supply chains lift Northwest edge spend to USD 94.20 million by 2035, a 19.59% CAGR.
South and Southeast
MTP opened its second Mérida phase in August 2025 (Source: MTP via DCD), and with tourism traffic in Cancún this carries South and Southeast spend at 19.77% a year.
Which Mexican States Host the Most Edge Data Center Spend?
Mexico City leads with USD 33.07 million in 2025, and Nuevo León is the fastest large state at 21.64% a year.
| Rank | State | 2025 (USD million) | 2035 (USD million) | CAGR 2025-2035 | Region |
|---|---|---|---|---|---|
| 1 | Mexico City | 33.07 | 142.90 | 15.76% | Valley of Mexico |
| 2 | Nuevo León | 18.90 | 134.06 | 21.64% | Northeast |
| 3 | Estado de México | 14.17 | 67.25 | 16.85% | Valley of Mexico |
| 4 | Jalisco | 12.99 | 70.14 | 18.37% | Bajío and West |
| 5 | Querétaro | 8.66 | 49.42 | 19.02% | Bajío and West |
| 6 | Guanajuato | 7.22 | 39.85 | 18.63% | Bajío and West |
| 7 | Baja California | 6.61 | 37.68 | 19.01% | Northwest |
| 8 | Chihuahua | 4.72 | 31.09 | 20.73% | Northwest |
| 9 | Coahuila | 4.20 | 27.17 | 20.53% | Northeast |
| 10 | Yucatán | 4.20 | 24.71 | 19.39% | South and Southeast |
| 11 | Tamaulipas | 3.15 | 19.93 | 20.26% | Northeast |
| 12 | Quintana Roo | 2.89 | 18.33 | 20.30% | South and Southeast |
Nuevo León nearly closes the gap with Mexico City by 2035 because Monterrey combines factory micro data centers, Triara and KIO regional sites, and cross-border fibre. Brazil and Argentina offer a regional comparison in the Brazil Edge Data Center Market and the Argentina Edge Data Center Market.
What If Edge Sites Connect Faster or Slower? Mexico Edge Data Center Scenarios to 2035
The 2035 Mexico edge market ranges from USD 536.22 million to USD 895.45 million around the base case of USD 724.63 million.
| Scenario | Assumption from 2027 | 2035 (USD million) |
|---|---|---|
| Low | New edge MW 25% below base, prices 5% lower | 536.22 |
| Base | 15.0 MW new in 2030, 20.5 MW in 2035 | 724.63 |
| High | New edge MW 20% above base, prices 5% higher | 895.45 |
The low case reflects CFE prioritising large campuses; the high case reflects faster 5G densification and more AI inference nodes.
Which Companies Build, Equip and Operate Mexico Edge Data Centers?
The five largest infrastructure suppliers hold about 45% of 2025 edge equipment and services spend, with Schneider Electric the leader at about 12% (DC Market Insights estimate based on supplier presence; no supplier discloses Mexican edge revenue).
- MTP (DigitalBridge): about 59-60 edge sites and 11 MW in 19 cities
- Megacable: more than 735 edge nodes on its cable network
- Triara (Telmex): regional data centers in five cities
- KIO Data Centers: Mexico City, Monterrey and Querétaro sites
- Equinix: Mexico City and Monterrey interconnection sites
- Cloudflare: three Mexican edge locations
- Amazon Web Services: Querétaro Local Zone
- American Tower: tower-site edge rooms
- Schneider Electric: micro data centers, UPS and cooling
- Vertiv: UPS, cooling and prefabricated modules
- Eaton: UPS and power distribution
- Rittal: enclosures and micro data center kits
- Dell Technologies: edge servers
- Hewlett Packard Enterprise: edge servers and storage
- Cisco: edge networking
- Lenovo: edge servers
- Huawei: telco edge hardware
KIO Data Centers plans more than USD 200 million of 2026 investment across Mexico City, Monterrey and Querétaro (Source: KIO via El CEO), most of it for core halls, so its edge share is small. MTP’s 11 MW equals about 37.8% of the 29.13 MW installed edge base, which makes it the largest dedicated edge operator.
Which Recent Announcements Moved the Mexico Edge Data Center Market?
Six dated events between November 2024 and September 2026 shaped Mexico edge capacity of 35.55 MW in 2026.
- In September 2026, MEXDC reported 279 MW of installed data center capacity and 205 MW under construction in Mexico (Source: MEXDC via DPL News).
- In September 2026, CFE and MEXDC agreed a route to serve 1,705 MW of new data center demand with three pilot projects (Source: DCD).
- In August 2026, KIO Data Centers said it will invest more than USD 200 million in 2026 in Mexico City, Monterrey and Querétaro (Source: El CEO).
- In November 2025, Telmex announced a new data center in northern Mexico for 2026 (Source: Telmex via DCD).
- In August 2025, MTP opened the second phase of its Mérida edge data center (Source: MTP via DCD).
- In November 2024, Cloudflare added a Guadalajara data center location (Source: Cloudflare).
Methodology: How Is the Mexico Edge Data Center Model Calculated?
DC Market Insights builds the USD 131.22 million 2025 value bottom-up from 8 inputs: new edge IT MW, installed edge IT MW, facility content per MW, edge IT spend per MW-year, services per MW-year, a 2% retirement rate, the national installed capacity from MEXDC and MTP’s 11 MW anchor.
- New edge IT MW: 2.0 (2020), 5.5 (2025), 7.0 (2026), 15.0 (2030), 20.5 (2035).
- Installed edge IT MW: 10.82 (2020), 29.13 (2025), 79.56 (2030), 160.52 (2035).
- Spend = new MW × facility content + average installed MW × (IT hardware + services) per MW-year.
Three bound checks test the result:
- Ceiling 1: 29.13 MW of edge capacity equals 12.4% of the 235 MW installed nationally in June 2025 (MEXDC), and 79.56 MW in 2030 equals 5.2% of the 1,516 MW MEXDC forecast, consistent with edge losing share to hyperscale.
- Ceiling 2: USD 131.22 million equals about 7% of an estimated USD 1.9 billion of 2025 Mexican data center capital spend at DC Market Insights unit values.
- Floor: MTP’s 11 MW alone, at USD 2.45 million of IT and services per MW-year, implies USD 26.95 million, or 20.5% of 2025 spend.
Segment, regional and state values follow share paths that sum to the total every year, and CAGRs are recomputed from endpoints. Full method notes are on the DC Market Insights research methodology page.
Table of contents
- 01Introduction
- 1.1Market Definition and Scope
- 1.2Included and Excluded Elements
- 1.3Federal Government, Retail and IT and Telecom Buyers
- 1.4How the Segments Fit Together
- 1.5Why Mexico Edge Data Center Market Estimates Differ
- 02Research Methodology
- 2.1Bottom-Up Model: Edge MW × Content per MW
- 2.2Bound Checks
- 2.3Source Ledger
- 03Executive Summary
- 3.1Market Snapshot, 2025, 2026 and 2035
- 3.2Key Market Statistics
- 3.3Key Takeaways
- 04Market Dynamics
- 4.1Driver: Telcel 5G Footprint in 125 Cities
- 4.2Driver: Nearshoring FDI in Nuevo León
- 4.3Driver: 100.2 Million Internet Users and CDN Nodes
- 4.4Trend: Second-City Cloud Nodes in Guadalajara and Querétaro
- 4.5Trend: Inference at the Edge and Cooling Content
- 4.6Trend: Prefabricated Modules for Factory Sites
- 4.7Restraint: CFE Grid Capacity and 1,705 MW of Campuses
- 4.8Restraint: Cost per MW of Small Sites
- 4.9Opportunity: Industrial-Park Micro Data Centers
- 4.10Opportunity: Managed Services for Unstaffed Sites
- 05Pricing Analysis
- 5.1Cost per Edge MW, 2020-2035
- 5.2Cost per Rack, per Module and per Site
- 06Standards and Regulation
- 6.1Ley en Materia de Telecomunicaciones y Radiodifusión 2025
- 6.2Federal Personal Data Law 2025
- 6.3Self-Supply Permit Route of 0.7-20 MW
- 6.4NMX-J-C-I-489 Data Center Standard
- 07Market Segmentation
- 7.1By Component: Edge IT Hardware
- 7.2By Component: Power Infrastructure
- 7.3By Component: Enclosures and Prefabricated Modules
- 7.4By Component: Cooling Infrastructure
- 7.5By Component: Installation and Managed Services
- 7.6By Edge Type: Telco and Cable Network Edge
- 7.7By Edge Type: Regional Colocation Edge
- 7.8By Edge Type: Enterprise On-Premise Micro Data Centers
- 7.9By Edge Type: Cloud and CDN Edge Nodes
- 7.10By End User: Telecom and Media
- 7.11By End User: Manufacturing and Logistics
- 7.12By End User: Healthcare and Other
- 7.13By End User: BFSI
- 7.14By End User: Retail and Government
- 08DC Exclusive: Mexico Edge Footprint Tracker
- 8.1Seven Operators Across 19 or More Cities
- 8.2Edge Type by Component Matrix, 2025
- 09Regional Insights
- 9.1Valley of Mexico
- 9.2Northeast
- 9.3Bajío and West
- 9.4Northwest
- 9.5South and Southeast
- 10State Analysis
- 10.1Mexico City
- 10.2Nuevo León
- 10.3Estado de México
- 10.4Jalisco
- 10.5Querétaro
- 10.6Guanajuato
- 10.7Baja California
- 10.8Chihuahua
- 10.9Coahuila
- 10.10Yucatán
- 10.11Tamaulipas
- 10.12Quintana Roo
- 11Forecast Scenarios
- 11.1Low Case
- 11.2Base Case
- 11.3High Case
- 12Competitive Insights
- 12.1MTP (DigitalBridge)
- 12.2Megacable
- 12.3Triara (Telmex)
- 12.4KIO Data Centers
- 12.5Equinix
- 12.6Cloudflare
- 12.7Amazon Web Services
- 12.8American Tower
- 12.9Schneider Electric
- 12.10Vertiv
- 12.11Eaton
- 12.12Rittal
- 12.13Dell Technologies
- 12.14Hewlett Packard Enterprise
- 12.15Cisco
- 12.16Lenovo
- 12.17Huawei
- 13Recent Developments
- 13.1Dated Events, November 2024-September 2026
- Fig. 1Mexico Edge Data Center Market Size, 2020-2035
- Table 1Report Attributes
- Table 2Scope Comparison
- Table 3Cost per Edge MW, 2020-2035
- Table 4Market by Component
- Table 5Market by Edge Type
- Table 6Market by End User
- Table 7Mexico Edge Footprint Tracker
- Table 8Edge Type by Component Matrix, 2025
- Table 9Market by Region
- Table 10Top 12 States
- Table 11Forecast Scenarios
About this report
Written by Amit Jain and reviewed by Deepti Agrawal, Senior Editor, Research. Figures are built top-down and bottom-up and reconciled before publication, with 2025 as the base year.
Read our methodologyHow we built this
- Historical period2020-2024
- Base year2025
- Forecast period2026-2035
- Sizing approachTop-down + bottom-up
Need more than the report?
Advisory on this market
Due diligence, site selection and market entry work, by the analysts who wrote this report.
See consulting servicesFrequently asked questions
USD 166.40 million in 2026, up 26.81% from USD 131.22 million in 2025, according to DC Market Insights estimates. The market is projected to reach USD 724.63 million by 2035, a CAGR of 18.63% from 2025.
A site of up to 5 MW of IT load placed near users or machines: telco and cable edge rooms, regional colocation sites, cloud and CDN nodes, and on-premise micro data centers. Mexico had about 29.13 MW of such capacity at the end of 2025, worth USD 131.22 million of spend.
Cloud and CDN Edge Nodes grow fastest at 24.54% a year, from USD 21.00 million in 2025 to USD 188.40 million in 2035. Among components, Installation and Managed Services grow fastest at 22.48% a year.
About USD 12.0 million of facility content per edge MW in 2025, plus USD 2.3 million a year of edge IT hardware (DC Market Insights estimate). A 50 kW micro data center module costs about USD 0.60 million before IT.
18.63% a year from 2025 to 2035, after 24.99% a year from 2020 to 2025. New edge capacity rises from 5.5 MW in 2025 to 15.0 MW in 2030 as 5G, CDN nodes and factory micro data centers spread.
The Valley of Mexico leads with 36.0% of 2025 spend (USD 47.24 million). The Northeast is the fastest region at 21.31% a year, and Nuevo León the fastest large state at 21.64%.
About 29.13 MW of edge IT capacity at the end of 2025 (DC Market Insights estimate), 12.4% of the 235 MW MEXDC counted nationally in June 2025. MTP alone runs about 11 MW across some 59 sites.
MTP (11 MW in 19 cities), Megacable (735+ edge nodes), Triara, KIO Data Centers, Equinix and Cloudflare lead among operators; Schneider Electric (about 12%) and Vertiv lead among suppliers, with the top five holding about 45%.
The USD 166.40 million 2026 value counts only sites up to 5 MW. Estimates that include regional halls above 5 MW, 5G radio equipment or edge software are several times larger; an earlier edition of this page showed USD 431.28 million for 2025.
Grid capacity: CFE is planning for 1,705 MW of mainly large-campus demand, and small sites cost about USD 12.0 million per MW. If new edge MW come in 25% below plan, 2035 spend falls to USD 536.22 million.
Content delivery and low-latency 5G services: Cloud and CDN Edge Nodes grow 24.54% a year to USD 188.40 million by 2035, while factory automation lifts Manufacturing and Logistics spend 21.31% a year to USD 181.16 million.
Spend kept growing: USD 43.01 million in 2020 rose 25.9% to USD 54.14 million in 2021, because remote work, streaming and online payments pushed CDN and telco edge capacity out of Mexico City (DC Market Insights estimate).
Get this report
How do I get the full report?
Request a quote; we reply by email within one business day.
How and when will I receive the report?
By email, within 24–48 business hours of payment.
How can I pay?
Once you accept the quote, we email you a secure payment link.
Can I see a sample first?
Yes. Request a free sample and we will email it to you.
Can the report be tailored to my needs?
Yes. We can add countries, segments or data cuts. Talk to an analyst about the scope you need.
Can I get an invoice or pay against a purchase order?
Write to sales@dcmarketinsights.com and our team will help.