
Italy Edge Data Center Market Size, Share & Forecast to 2035
Market at a glance
The Italy Edge Data Center market was worth USD 236.9 million in 2025 and is forecast to reach USD 849.7 million by 2035, growing at a 13.62% CAGR. North-West accounts for 45.73% of the market.
 By Amit Jain, Senior Consultant, ICT & Emerging Technologies
 Reviewed by Deepti Agrawal
Last updated 15 Oct 2026
Base year 2025 PDF + Excel
Source: DC Market Insights analysis
Key findings
More than 100 telephone exchanges become edge data centers
Reuse of exchanges and tower sites instead of new buildings
Electricity at 115.9 euro per MWh
Managed services grow almost fivefold by 2035
What is inside the report
- 01Introduction
- 02Executive Summary
- 03Market Scope and Estimate Comparison
- 04Market Dynamics
- 05Pricing Analysis
- 06Standards and Regulation
- 07Market Segmentation
- 08DC Exclusive
- 09Regional Insights
- 10Hub Analysis
- 13chapters
- 2020-2024Historical period
- 2026-2035Forecast period
- 17Companies profiled
Regional insights
- North-West45.73%
- Centre22.16%
- North-East17.82%
- South9.61%
- Islands4.68%
Segmentation
Companies profiled
- TIM Enterprise
- FiberCop
- Open Fiber
- Rai Way
- Aruba
- Retelit
- WIIT
- Equinix
- Data4
- EdgeConneX
- Vantage Data Centers
- Microsoft
- Google Cloud
- Amazon Web Services
- Schneider Electric
- Vertiv
- Eaton
Recent developments
FiberCop announced plans to convert more than 100 telephone exchanges into edge data centers, with the first node active in Rome (Source: TelecomTV).
the Italian government announced the EdgeConneX Campus Italia program, 3 billion euro for more than 300 MW across three Lombardy campuses, a large-campus project outside this market (Source: DatacenterDynamics).
Law Decree 21/2026 introduced a single authorization for data centers (Source: Latham and Watkins).
the Politecnico di Milano observatory reported 7.1 billion euro invested in Italian data centers in 2023-2025 and 25.4 billion euro forecast for 2026-2028 (Source: Osservatorio Data Center).
TIM Enterprise set out 1 billion euro of data center investment, including 105 million euro for edge cloud (Source: W.Media).
Open Fiber opened its third edge data center, near Pescara (Source: DatacenterDynamics).
Full analysis
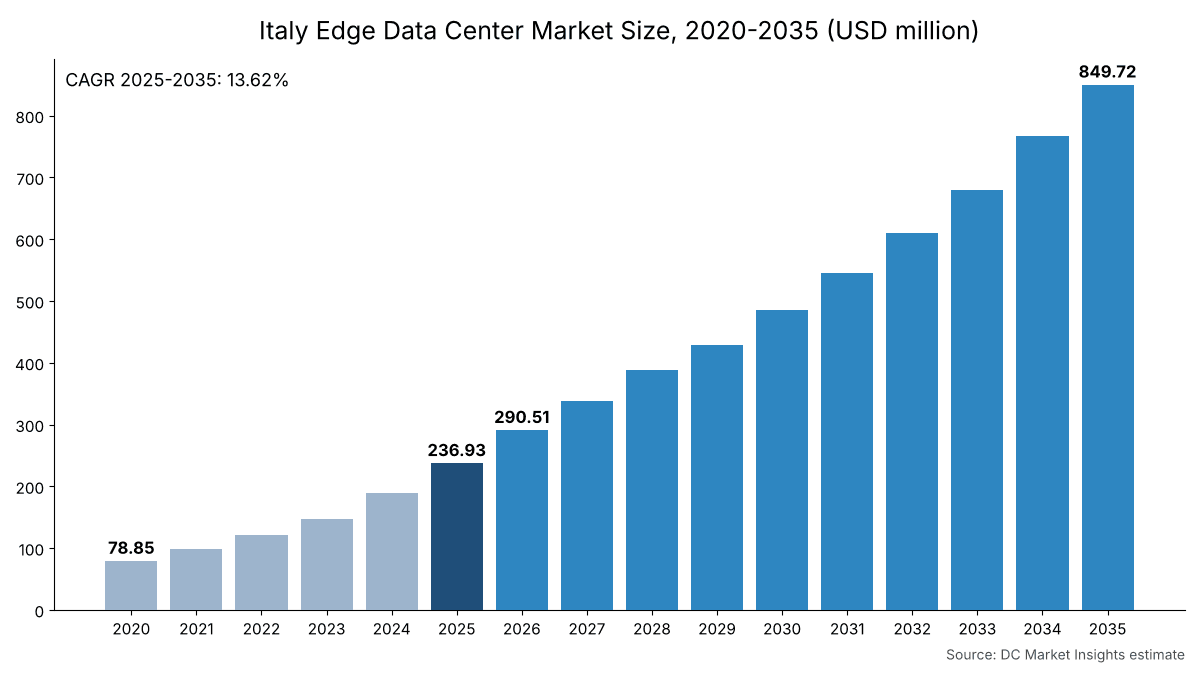
The Italy Edge Data Center Market is valued at USD 290.51 million in 2026 and is projected to reach USD 849.72 million by 2035, up from USD 236.93 million in 2025, a compound annual growth rate (CAGR) of 13.62% from 2025 to 2035 (DC Market Insights estimate). The market covers spending on edge data centers in Italy: sites of up to about 2 megawatts (MW) of information technology (IT) load placed close to users, machines and mobile networks, such as converted telephone exchanges, regional colocation halls, cloud edge racks and on-premises micro data centers. The 2025 build receipt is 11.35 MW of new or refreshed edge IT capacity x USD 11.80 million of hardware per MW = USD 133.93 million, plus 50.0 MW of average installed edge capacity x USD 1.62 million of services per MW = USD 81.00 million, plus 50.0 MW x USD 0.44 million of software per MW = USD 22.00 million. Software is the fastest-growing segment at 17.66% a year because each new node is run remotely, and the South is the fastest-growing region at 17.73% a year as fiber operators open edge nodes in Naples, Bari and Palermo. Edge sites are the regional layer of the Italy Data Center Market.
Key Market Statistics: How Big Is the Italy Edge Data Center Market in 2026?
DC Market Insights values the Italy Edge Data Center Market at USD 290.51 million in 2026, 22.61% above the USD 236.93 million of 2025, as installed edge IT capacity rises from 55 MW to 67 MW.
- Market size 2025: USD 236.93 million
- Market size 2026: USD 290.51 million
- Market size 2030: USD 485.44 million
- Market size 2035: USD 849.72 million
- CAGR 2025-2035: 13.62% (low case 12.15%, high case 14.94%)
- Largest component: Hardware, 56.53% of 2025 spend (USD 133.93 million)
- Fastest segment: Software, 17.66% a year (USD 22.00 million in 2025 to USD 111.85 million by 2035)
- Fastest operator type: Telco and Fiber Edge, 16.78% a year
- Leading region: North-West, 45.73% of 2025 spend
- Fastest-growing region: South, 17.73% a year
- Largest hub: Milan, USD 61.93 million in 2025
- Market leader: TIM Enterprise, about 12% of 2025 spend (DC Market Insights assessment)
Executive Summary: How Much Did Italy Spend on Edge Data Centers in 2025?
Italy spent USD 236.93 million on edge data centers in 2025. The Italy Edge Data Center Market size was valued at USD 78.85 million in 2020, reached USD 236.93 million in 2025, and is anticipated to reach USD 849.72 million by 2035, at a CAGR of 13.62% during the forecast period. Between 2020 and 2025 spend grew 24.61% a year because installed edge IT capacity rose from about 22 MW to about 55 MW as telecom operators, broadcasters and regional colocation providers built small sites outside Milan.
| Report attribute | Details |
|---|---|
| Historical Period | 2020-2024 |
| Base Year | 2025 |
| Forecast Period | 2026-2035 |
| Italy Edge Data Center Market Size 2025 | USD 236.93 million |
| Italy Edge Data Center Market Size 2026 | USD 290.51 million |
| Italy Edge Data Center Market CAGR (2025-2035) | 13.62% |
| Italy Edge Data Center Market Size 2035 | USD 849.72 million |
Growth slows from 24.61% to 13.62% a year because the installed base gets larger, not because fewer sites are built: DC Market Insights expects installed edge IT capacity of 123 MW in 2030 and 215 MW in 2035, with 26.82 MW of new or refreshed capacity in 2035 against 11.35 MW in 2025. Services and software grow faster than hardware because each installed MW pays for remote management and maintenance every year. Edge is still a small slice of Italian capacity: Milan alone has 414 MW of IT load, 68% of national nominal power (Source: Osservatorio Data Center, Politecnico di Milano, January 2026), so the 55 MW of edge capacity is about 9% of the national total by DC Market Insights estimates.
Key takeaways:
- USD 236.93 million in 2025, USD 290.51 million in 2026 and USD 849.72 million by 2035, a 13.62% CAGR.
- Hardware is the largest component at 56.53% because every new node needs power, cooling, enclosures, racks and servers.
- The North-West takes 45.73% of 2025 spend; the South grows fastest at 17.73% a year.
- Telephone exchanges are becoming edge data centers: FiberCop plans more than 100 of them, starting in Rome (Source: TelecomTV, August 2026).
- Italian wholesale electricity averaged 115.9 euro per megawatt-hour (MWh) in 2025, almost double France and Spain (Source: ARERA figures, reported by Il Sole 24 Ore, July 2026), which favors efficient, small sites.
Market Scope: What Is an Edge Data Center in Italy and What Does the Market Cover?
An Italian edge data center is a site of up to about 2 MW of IT load built close to users or machines to cut latency below about 5 milliseconds, and the Italy Edge Data Center Market is the annual spend on these sites, USD 236.93 million in 2025 across about 55 MW of installed edge IT capacity (DC Market Insights estimate).
Included. Hardware installed at edge sites: power systems (uninterruptible power supply (UPS) units, batteries, switchgear and generators), cooling, prefabricated enclosures and modules, racks, and the servers, storage and network gear placed in edge nodes; software: data center infrastructure management (DCIM), remote monitoring and edge orchestration platforms; and services: design and integration, managed operation, maintenance and remote hands for edge sites.
Excluded. Hyperscale and wholesale campuses above about 2 MW per site, such as the Lombardy campuses planned by EdgeConneX and Vantage Data Centers, mobile network radio equipment, fiber backbone construction, land and electricity bills.
How the segments fit together. Every split in this report sums to the same total: three components, four operator types, three site sizes, six end uses and five Italian macro-regions. In 2025 Hardware is USD 133.93 million, Services USD 81.00 million and Software USD 22.00 million. The same edge model applied worldwide is described in the Edge Computing Market report, which counts the wider edge software and device layer.
Why Do Italy Edge Data Center Market Estimates Differ?
DC Market Insights values the Italy Edge Data Center Market at USD 290.51 million in 2026, and published estimates differ because they draw the edge boundary in different places. An earlier edition of this page used a wider definition that counted part of the regional colocation and hyperscale capacity around Milan and Rome, which gave a 2025 value about 90% higher; the current figure counts only sites of up to about 2 MW and their hardware, software and services.
| Element | In this report | Why |
|---|---|---|
| Edge sites up to about 2 MW (telco, regional colocation, cloud edge, enterprise micro) | Yes, USD 236.93 million (2025) | The edge layer close to users and machines |
| Servers and network gear inside edge nodes | Yes, inside Hardware | Edge buyers purchase the node as one system |
| Campuses above about 2 MW | No | Sized in the Italy Data Center Market report |
| Mobile radio and fiber backbone | No | Network infrastructure, not data centers |
| Announced multi-year budgets | No | Counted only when the MW is built |
Large headline figures such as the 7.1 billion euro invested in Italian data centers in 2023-2025 are therefore not added to the total: almost all of that money went into large campuses, and DC Market Insights counts only the edge share (Source: Osservatorio Data Center, Politecnico di Milano, January 2026).
Related searches outside this scope. This page does not size the Italy pervasive computing technology market, the Italy position tracking system market or the Italy cloud electronic design automation market. Pervasive computing devices, position tracking systems for people and assets, and cloud-hosted electronic design automation software are technologies that may run on edge nodes, but their spending is not data center infrastructure, so none of it is counted in the USD 290.51 million for 2026.
Market Drivers: What Drives the Italy Edge Data Center Market?
Three drivers take installed Italian edge IT capacity from 55 MW in 2025 to 215 MW in 2035: telephone exchanges converted into edge nodes, telecom and broadcaster edge networks, and latency needs in factories and media.
More than 100 telephone exchanges become edge data centers
FiberCop, the fixed network company carved out of TIM, plans to convert more than 100 Italian telephone exchanges into edge data centers; the first node is active in Rome, and Turin, Genoa, Bologna, Naples and Palermo are next (Source: TelecomTV, August 2026). Open Fiber opened its third edge data center at San Giovanni Teatino near Pescara after Rome and Milan, plans up to fifteen nodes by the first half of 2026 and could build up to 100, five per region (Source: DatacenterDynamics, September 2025). These programs feed the Telco and Fiber Edge segment, USD 63.57 million in 2025 and growing at 16.78% a year. The segment values are DC Market Insights estimates.
TIM Enterprise and Rai Way build national edge networks
TIM Enterprise plans 1 billion euro of data center investment over three years, including 105 million euro for edge cloud infrastructure, and will run 17 data centers with 125 MW nationwide (Source: W.Media, October 2025). Rai Way, the broadcast tower company, is building 18 edge data centers covering 20 Italian regions with latency under 5 milliseconds and a power usage effectiveness (PUE) of 1.2 to 1.3 (Source: EdgeIR, May 2023); five sites in Florence, Genoa, Milan, Turin and Venice were completed in November 2024, and the planned edge network totals 3.4 MW (Source: DatacenterDynamics, November 2024). At about 0.19 MW per site, the Rai Way network shows why Small sites of 100 to 500 kilowatts (kW) lead the market with 41.61% of 2025 spend.
Factories and media need processing within a few milliseconds
Italian manufacturers in Lombardy, Veneto and Emilia-Romagna use edge nodes for machine vision, predictive maintenance and Industry 4.0 control loops that cannot wait for a round trip to a distant cloud region. Manufacturing and Industry 4.0 stands at USD 45.89 million in 2025, the fastest-growing end use at 15.41% a year, reaching USD 192.38 million by 2035. This is a DC Market Insights estimate.
Market Trends: How Is Italian Edge Data Center Infrastructure Changing?
Three trends reshape what an Italian edge node contains: reuse of existing telecom and broadcast real estate, prefabricated modules and remote operation through software.
Reuse of exchanges and tower sites instead of new buildings
Converting a telephone exchange or a broadcast site avoids land purchase and a new grid connection, because these buildings already have power, fiber and security. FiberCop’s plan is built on exchanges (Source: TelecomTV, August 2026) and Rai Way’s on its broadcast estate (Source: EdgeIR, May 2023). Reused sites cost about 20% less per MW in civil works than greenfield edge sites, which keeps hardware content at USD 11.80 million per new MW in 2025. Both values are DC Market Insights estimates.
Prefabricated modules shorten deployment
Edge nodes are increasingly delivered as prefabricated modules with power, cooling and racks integrated in the factory. Rai Way describes its edge sites as modular layouts compliant with ANSI/TIA-942 rating 3 and ISO/IEC TS 22237 (Source: EdgeIR, May 2023). Factory-built modules are sized separately in the Modular Data Center Market report.
Remote operation lifts software and services
An operator with 100 nodes cannot staff each one, so monitoring, orchestration and remote hands move into software and managed services. Software costs USD 0.44 million per installed MW a year in 2025, rising 2.2% a year, and Services cost USD 1.62 million; Software grows from 9.29% of 2025 spend to 13.16% by 2035, and Services from 34.19% to 45.70%. These per-MW values are DC Market Insights estimates.
Market Challenges: What Holds the Italy Edge Data Center Market Back?
High electricity prices and permitting paperwork are the two largest constraints, and together they explain why the base case adds 160 MW of edge capacity over 2026-2035 rather than the several hundred MW implied by announced node counts.
Electricity at 115.9 euro per MWh
The Italian wholesale electricity price averaged 115.9 euro per MWh in 2025, up 7% on 2024 and the highest among major European power exchanges, against 61.1 euro in France and 65.3 euro in Spain (Source: ARERA figures, reported by Il Sole 24 Ore, July 2026). Small edge sites have a weaker bargaining position than campuses, so a node running at a PUE of 1.5 pays far more per unit of compute than a large campus. In the low case, with capacity additions and per-MW values 15% below base, 2035 spend is USD 745.67 million rather than USD 849.72 million.
Grid queues and permits slow larger edge sites
Developers had submitted 68.5 gigawatts (GW) of data center connection requests to Terna by 30 November 2025, 31.1 GW of them for Milan, a queue the Politecnico di Milano observatory calls far from realistic (Source: Osservatorio Data Center, Politecnico di Milano, January 2026). Edge sites under 1 MW usually connect at medium or low voltage and avoid most of this queue, but Medium sites of 500 kW to 2 MW, 33.92% of 2025 spend, face longer waits; DC Market Insights grows them at 12.95% a year, below the market.
Market Opportunities: Where Are the New Revenue Pools?
The two largest new revenue pools are managed services for distributed nodes, USD 388.28 million by 2035, and edge capacity in the South and Islands, USD 166.46 million by 2035.
Managed services grow almost fivefold by 2035
Services grow from USD 81.00 million in 2025 to USD 388.28 million by 2035, a 16.97% CAGR, and overtake Hardware by 2035. These are DC Market Insights estimates. Integrators and operators that can run hundreds of unmanned nodes from one operations center gain most, because the number of sites grows faster than the number of engineers.
The South and Islands grow fastest
Naples, Bari and Palermo are on the FiberCop and Open Fiber node lists, and Open Fiber’s plan of five nodes per region spreads capacity across all 20 regions (Source: DatacenterDynamics, September 2025). The South grows at 17.73% a year to USD 116.50 million and the Islands at 16.25% to USD 49.96 million by 2035. Both are DC Market Insights estimates.
Pricing: How Much Does an Edge Data Center Cost in Italy?
An Italian edge data center cost about USD 11.80 million per MW of IT capacity in 2025 for hardware including edge servers, plus about USD 2.06 million per installed MW a year for services and software, which puts a typical 200 kW node at about USD 2.36 million to equip. These are DC Market Insights estimates.
| Year | Hardware per new edge MW (USD million) | Services per installed MW a year (USD million) | Software per installed MW a year (USD million) |
|---|---|---|---|
| 2020 | 11.23 | 1.496 | 0.395 |
| 2025 | 11.80 | 1.620 | 0.440 |
| 2030 | 12.40 | 1.754 | 0.491 |
| 2035 | 13.03 | 1.899 | 0.547 |
Public price anchors:
- TIM Enterprise’s 105 million euro for edge cloud infrastructure over three years is about 35 million euro a year (Source: W.Media, October 2025; DC Market Insights arithmetic).
- Rai Way’s edge network totals 3.4 MW across 18 sites, about 0.19 MW per site (Source: DatacenterDynamics, November 2024; DC Market Insights arithmetic), the size band where DC Market Insights prices nodes.
- Electricity, the largest running cost, averaged 115.9 euro per MWh at wholesale in 2025 (Source: Il Sole 24 Ore, July 2026).
The model’s per-MW values rise 1.0% a year for hardware, 1.6% for services and 2.2% for software, labelled DC Market Insights estimates.
Standards and Regulation: Which Rules Shape Italian Edge Data Centers?
Three rules shape Italian edge sites: European Union (EU) energy reporting for sites of 500 kW and more, the single authorization for data centers under Law Decree 21/2026, and the design standards edge operators certify against.
EU energy reporting. Commission Delegated Regulation (EU) 2024/1364 of 14 March 2024 requires operators of data centers with an installed IT power demand of at least 500 kW to report energy and water performance, first by 15 September 2024 and then by 15 May each year (Source: EUR-Lex; DLA Piper, September 2024). Most Small and Micro edge nodes fall below the threshold; Medium sites do not.
Single authorization. Article 8 of Law Decree 21/2026, in force from 21 February 2026, introduced a single authorization for building and expanding data centers, to be completed within 10 months, with ministry approval for projects of 300 MW or more of thermal capacity and regional approval from 50 MW (Source: Latham and Watkins, February 2026). Edge sites sit far below these thresholds and follow ordinary local permits.
Design standards. Italian edge operators certify against ANSI/TIA-942 and ISO/IEC TS 22237, as Rai Way does for its edge network (Source: EdgeIR, May 2023).
Market Segmentation: Which Segment Leads the Italy Edge Data Center Market?
Hardware leads the Italy Edge Data Center Market with 56.53% of 2025 spend (USD 133.93 million), and Software is the fastest-growing segment at 17.66% a year to 2035. These are DC Market Insights estimates.
By Component: Hardware Leads with 56.53%
Hardware is bought once per node; Services and Software are paid every year on the installed base, so their share rises as the base grows.
| Component | 2025 (USD million) | Share 2025 | 2035 (USD million) | CAGR 2025-2035 |
|---|---|---|---|---|
| Hardware | 133.93 | 56.53% | 349.59 | 10.07% |
| Services | 81.00 | 34.19% | 388.28 | 16.97% |
| Software | 22.00 | 9.29% | 111.85 | 17.66% |
By Operator Type: Colocation and Regional Edge Leads with 38.47%
Regional colocation halls in second-tier cities are the largest buyers today; Telco and Fiber Edge overtakes them by 2035 as exchanges are converted.
| Operator type | 2025 (USD million) | Share 2025 | 2035 (USD million) | CAGR 2025-2035 |
|---|---|---|---|---|
| Colocation and Regional Edge | 91.15 | 38.47% | 281.34 | 11.93% |
| Telco and Fiber Edge | 63.57 | 26.83% | 299.87 | 16.78% |
| Enterprise On-Premises Micro | 54.40 | 22.96% | 139.18 | 9.85% |
| Cloud Edge Zones | 27.82 | 11.74% | 129.33 | 16.61% |
By Site Size: Small Sites Lead with 41.61%
Sites of 100 to 500 kW match the size of a converted exchange or broadcast site.
| Site size | 2025 (USD million) | Share 2025 | 2035 (USD million) | CAGR 2025-2035 |
|---|---|---|---|---|
| Small (100-500 kW) | 98.59 | 41.61% | 372.69 | 14.22% |
| Medium (500 kW-2 MW) | 80.37 | 33.92% | 271.66 | 12.95% |
| Micro (under 100 kW) | 57.98 | 24.47% | 205.38 | 13.48% |
By End Use: IT and Telecom Leads with 32.68%
Banking, financial services and insurance (BFSI) and government buyers use edge sites for data residency and resilience; manufacturers grow fastest.
| End use | 2025 (USD million) | Share 2025 | 2035 (USD million) | CAGR 2025-2035 |
|---|---|---|---|---|
| IT and Telecom | 77.43 | 32.68% | 259.25 | 12.84% |
| Manufacturing and Industry 4.0 | 45.89 | 19.37% | 192.38 | 15.41% |
| Media and Content Delivery | 34.40 | 14.52% | 109.36 | 12.26% |
| Government and Healthcare | 30.64 | 12.93% | 120.49 | 14.68% |
| BFSI | 28.05 | 11.84% | 87.44 | 12.04% |
| Retail and Others | 20.52 | 8.66% | 80.81 | 14.69% |
DC Exclusive: The Italy Edge Node Tracker and Region x Component Matrix
The largest cell of the market is North-West hardware, USD 59.80 million in 2025. This is a DC Market Insights model built from 10 inputs (installed edge IT MW by year, the refresh rate, hardware, services and software values per MW, their three escalation rates, and the 2025 and 2035 regional shares) and tested against 3 bound checks, listed under Methodology.
| Program | Operator | Sites | Capacity or budget | Status |
|---|---|---|---|---|
| Exchange conversion | FiberCop | More than 100 | Not disclosed | Rome active; Turin, Genoa, Bologna, Naples, Palermo next (August 2026) |
| Edge nodes | Open Fiber | Up to 15 by 1H2026, up to 100 later | Not disclosed | Rome, Milan and Pescara open (September 2025) |
| Edge network | Rai Way | 18 sites, 20 regions | 3.4 MW | Five sites completed (November 2024) |
| Edge cloud | TIM Enterprise | Not disclosed | 105 million euro over three years | Announced October 2025 |
The matrix below splits the 2025 market of USD 236.93 million by region and component; rows and columns sum to the totals above.
| Region (USD million, 2025) | Hardware | Services | Software | Total |
|---|---|---|---|---|
| North-West | 59.80 | 38.04 | 10.51 | 108.35 |
| Centre | 29.69 | 17.98 | 4.83 | 52.50 |
| North-East | 24.30 | 14.13 | 3.79 | 42.22 |
| South | 13.51 | 7.32 | 1.94 | 22.77 |
| Islands | 6.63 | 3.53 | 0.93 | 11.09 |
| Total | 133.93 | 81.00 | 22.00 | 236.93 |
Regional Insights: Which Region Leads the Italy Edge Data Center Market?
The North-West leads with 45.73% of 2025 spend (USD 108.35 million), and the South is the fastest-growing region at 17.73% a year to USD 116.50 million by 2035. These are DC Market Insights estimates.
| Region | 2025 (USD million) | Share 2025 | 2035 (USD million) | CAGR 2025-2035 |
|---|---|---|---|---|
| North-West | 108.35 | 45.73% | 341.42 | 12.16% |
| Centre | 52.50 | 22.16% | 182.44 | 13.26% |
| North-East | 42.22 | 17.82% | 159.41 | 14.21% |
| South | 22.77 | 9.61% | 116.50 | 17.73% |
| Islands | 11.09 | 4.68% | 49.96 | 16.25% |
North-West Leads with 45.73% Share
Lombardy, Piedmont and Liguria hold the densest fiber and the most enterprise demand; Milan concentrates 68% of Italian nominal data center power (Source: Osservatorio Data Center, Politecnico di Milano, January 2026), and Turin and Genoa are early FiberCop node cities.
Centre Holds 22.16% Share
Rome hosts the first FiberCop edge node (Source: TelecomTV, August 2026) and one of Open Fiber’s three edge sites, and public administration demand keeps the Centre at USD 182.44 million by 2035.
North-East Holds 17.82% Share
Bologna, Padua, Venice, Verona and Brescia serve the manufacturing districts of Emilia-Romagna, Veneto and eastern Lombardy; the North-East grows at 14.21% a year as Industry 4.0 projects add on-premises and regional nodes (DC Market Insights estimate).
South Holds 9.61% Share
The South is the fastest-growing region at 17.73% a year because Naples and Bari are on national node lists and Open Fiber plans five nodes per region (Source: DatacenterDynamics, September 2025).
Islands Hold 4.68% Share
Sicily and Sardinia grow at 16.25% a year to USD 49.96 million by 2035, led by Palermo, a planned FiberCop node city (Source: TelecomTV, August 2026).
Hub Analysis: Which Italian Cities Spend the Most on Edge Data Centers?
Milan leads with USD 61.93 million in 2025, and Pescara is the fastest-growing hub at 18.89% a year. These are DC Market Insights estimates. The 12 hubs below hold 79.76% of 2025 spend.
| Rank | Hub | Region | 2025 (USD million) | Share 2025 | 2035 (USD million) | CAGR |
|---|---|---|---|---|---|---|
| 1 | Milan | North-West | 61.93 | 26.14% | 183.79 | 11.49% |
| 2 | Rome | Centre | 36.18 | 15.27% | 123.12 | 13.03% |
| 3 | Turin | North-West | 19.24 | 8.12% | 63.05 | 12.60% |
| 4 | Bologna | North-East | 13.60 | 5.74% | 52.09 | 14.37% |
| 5 | Genoa | North-West | 10.92 | 4.61% | 37.22 | 13.04% |
| 6 | Florence | Centre | 9.43 | 3.98% | 32.37 | 13.13% |
| 7 | Naples | South | 9.22 | 3.89% | 46.48 | 17.56% |
| 8 | Padua and Venice | North-East | 8.70 | 3.67% | 34.16 | 14.66% |
| 9 | Verona and Brescia | North-East | 7.16 | 3.02% | 29.23 | 15.11% |
| 10 | Bari | South | 5.24 | 2.21% | 28.64 | 18.52% |
| 11 | Palermo | Islands | 4.93 | 2.08% | 23.88 | 17.09% |
| 12 | Pescara | Centre | 2.44 | 1.03% | 13.77 | 18.89% |
Naples moves from seventh place in 2025 to fifth by 2035 (USD 46.48 million) because it is the largest southern node city on both the FiberCop and Open Fiber plans.
Forecast Scenarios: How Could the 2035 Forecast Change?
The 2035 Italy Edge Data Center Market ranges from USD 745.67 million to USD 953.78 million around a base case of USD 849.72 million, depending on how many announced nodes are actually built.
| Scenario | Assumption from 2026 | 2035 value | CAGR 2025-2035 |
|---|---|---|---|
| Low | Edge capacity additions 15% below base (power prices and permits bind) | USD 745.67 million | 12.15% |
| Base | 160 MW added 2026-2035; installed edge IT 215 MW by 2035 | USD 849.72 million | 13.62% |
| High | Edge capacity additions 15% above base (full FiberCop and Open Fiber programs) | USD 953.78 million | 14.94% |
The swing factor is the conversion pace of telephone exchanges: more than 100 FiberCop sites at a few hundred kW each would on their own add capacity close to the high case.
Competitive Insights: Who Leads the Italy Edge Data Center Market?
TIM Enterprise leads with about 12% of 2025 spend, and the three largest players (TIM Enterprise, Aruba and Equinix) account for about 27% of it (DC Market Insights assessment).
- TIM Enterprise
- FiberCop
- Open Fiber
- Rai Way
- Aruba
- Retelit
- WIIT
- Equinix
- Data4
- EdgeConneX
- Vantage Data Centers
- Microsoft
- Google Cloud
- Amazon Web Services
- Schneider Electric
- Vertiv
- Eaton
TIM Enterprise’s advantage is reach: 17 data centers and 125 MW nationwide once its plan completes, with a dedicated edge cloud budget (Source: W.Media, October 2025). FiberCop and Open Fiber own exchanges and fiber in every region, the cheapest path to new nodes (Source: TelecomTV, August 2026; DatacenterDynamics, September 2025). Rai Way brings broadcast sites with power and security already in place (Source: DatacenterDynamics, November 2024). Aruba and Equinix sell regional and metro colocation to enterprises that need low-latency access to cloud regions. Schneider Electric, Vertiv and Eaton supply most prefabricated power and cooling modules for edge nodes.
Recent Developments
- In August 2026, FiberCop announced plans to convert more than 100 telephone exchanges into edge data centers, with the first node active in Rome (Source: TelecomTV).
- In May 2026, the Italian government announced the EdgeConneX Campus Italia program, 3 billion euro for more than 300 MW across three Lombardy campuses, a large-campus project outside this market (Source: DatacenterDynamics).
- In February 2026, Law Decree 21/2026 introduced a single authorization for data centers (Source: Latham and Watkins).
- In January 2026, the Politecnico di Milano observatory reported 7.1 billion euro invested in Italian data centers in 2023-2025 and 25.4 billion euro forecast for 2026-2028 (Source: Osservatorio Data Center).
- In October 2025, TIM Enterprise set out 1 billion euro of data center investment, including 105 million euro for edge cloud (Source: W.Media).
- In September 2025, Open Fiber opened its third edge data center, near Pescara (Source: DatacenterDynamics).
More country and segment reports are listed under DC Market Insights industry reports; related small-site formats are covered in the Containerized Data Center Market and Micro-mobile Data Center Market reports.
Methodology: How We Built the Italy Edge Data Center Market Model
The model multiplies new or refreshed edge IT capacity by hardware content per MW and adds services and software on the average installed base. Installed edge IT capacity is 22 MW in 2020, 45 MW in 2024, 55 MW in 2025, 67 MW in 2026, 123 MW in 2030 and 215 MW in 2035; 3% of the start-of-year base is refreshed each year, giving 11.35 MW of new or refreshed capacity in 2025 and 26.82 MW in 2035. Hardware is USD 11.80 million per MW in 2025 (power and cooling about 3.10, enclosures, racks and fit-out about 2.20, servers, storage and network about 6.50), Services USD 1.62 million and Software USD 0.44 million per installed MW a year; values rise 1.0%, 1.6% and 2.2% a year. Operator, site size, end use, region and hub shares are set for 2025 and 2035 and sum to the total.
Three bound checks:
- Ceiling 1: 55 MW of edge IT is about 9% of an Italian total of about 609 MW implied by Milan’s 414 MW being 68% of national power (Source: Osservatorio Data Center, Politecnico di Milano, January 2026; DC Market Insights arithmetic).
- Ceiling 2: USD 236.93 million is about 0.04% of the USD 580 billion the world spends on data centers in 2025 (Source: International Energy Agency (IEA), reported by TechCrunch, November 2025).
- Floor: TIM Enterprise’s edge cloud budget of about 35 million euro a year, about USD 38 million, is below the model’s USD 63.57 million for the whole Telco and Fiber Edge segment in 2025.
Full approach: DC Market Insights research methodology. The analyst named on this page built the model, and the reviewer checked the arithmetic, the sources and the dates before publication.
Table of contents
- 01Introduction
- 1.1Market Definition and Scope
- 1.2Research Methodology
- 1.3Key Market Statistics
- 02Executive Summary
- 2.1Market Size 2020-2035
- 2.2Key Takeaways
- 03Market Scope and Estimate Comparison
- 3.1Included and Excluded
- 3.2Why Estimates Differ
- 04Market Dynamics
- 4.1Market Drivers
- 4.2Market Trends
- 4.3Market Challenges
- 4.4Market Opportunities
- 05Pricing Analysis
- 5.1Edge Content per MW, 2020-2035
- 5.2Public Price Anchors
- 06Standards and Regulation
- 6.1EU Energy Reporting
- 6.2Single Authorization
- 6.3Design Standards
- 07Market Segmentation
- 7.1By Component
- 7.2By Operator Type
- 7.3By Site Size
- 7.4By End Use
- 08DC Exclusive
- 8.1Italy Edge Node Tracker
- 8.2Region x Component Matrix
- 09Regional Insights
- 9.1North-West
- 9.2Centre
- 9.3North-East
- 9.4South
- 9.5Islands
- 10Hub Analysis
- 10.1Top 12 Edge Hubs
- 11Forecast Scenarios
- 11.1Low, Base and High Cases
- 12Competitive Landscape
- 12.1Company List
- 12.2Market Share and Advantages
- 13Recent Developments
- Fig. 1Italy Edge Data Center Market Size, 2020-2035
- Table 1Report Attributes
- Table 2Scope Comparison
- Table 3Edge Content per MW
- Table 4Segment Tables
- Table 5Edge Node Tracker
- Table 6Region x Component Matrix
- Table 7Regional Split
- Table 8Top 12 Hubs
- Table 9Forecast Scenarios
About this report
Written by Amit Jain and reviewed by Deepti Agrawal, Senior Editor, Research. Figures are built top-down and bottom-up and reconciled before publication, with 2025 as the base year.
Read our methodologyHow we built this
- Historical period2020-2024
- Base year2025
- Forecast period2026-2035
- Sizing approachTop-down + bottom-up
Need more than the report?
Advisory on this market
Due diligence, site selection and market entry work, by the analysts who wrote this report.
See consulting servicesFrequently asked questions
USD 290.51 million in 2026, up 22.61% from USD 236.93 million in 2025, according to DC Market Insights estimates. The market is projected to reach USD 849.72 million by 2035, a CAGR of 13.62% from 2025 to 2035.
USD 236.93 million in 2025 and USD 849.72 million by 2035 (DC Market Insights estimate), after USD 78.85 million in 2020. The 2025 figure covers hardware for 11.35 MW of new or refreshed edge capacity plus services and software on about 50 MW installed.
A site of up to about 2 MW of IT load built close to users or machines, such as a converted telephone exchange, a regional colocation hall or an on-premises micro data center. Italy had about 55 MW of edge IT capacity in 2025, about 9% of national capacity (DC Market Insights estimate).
13.62% a year from 2025 to 2035 (DC Market Insights estimate), slower than the 24.61% of 2020-2025 because the installed base is larger, even though new or refreshed capacity rises from 11.35 MW in 2025 to 26.82 MW in 2035.
Software, at 17.66% a year from USD 22.00 million in 2025 to USD 111.85 million by 2035, because operators run hundreds of unmanned nodes remotely. Telco and Fiber Edge is the fastest operator type at 16.78%. Both are DC Market Insights estimates.
About USD 11.80 million per MW of IT capacity for hardware in 2025, so a typical 200 kW node costs about USD 2.36 million to equip, plus about USD 2.06 million per installed MW a year for services and software. These are DC Market Insights estimates.
Hardware, with 56.53% of 2025 spend (USD 133.93 million), because every new node needs power, cooling, enclosures, racks and edge servers. Services overtake Hardware by 2035 at USD 388.28 million. These are DC Market Insights estimates.
The North-West, with 45.73% of 2025 spend (USD 108.35 million), led by Milan. The South is the fastest-growing region at 17.73% a year as FiberCop and Open Fiber open nodes in Naples and Bari (DC Market Insights estimate).
FiberCop plans more than 100 converted telephone exchanges, Open Fiber up to 100 nodes at five per region, and Rai Way 18 sites covering 20 regions with 3.4 MW in total, according to company statements reported in 2024-2026.
Milan, with USD 61.93 million in 2025, followed by Rome at USD 36.18 million. Pescara is the fastest-growing hub at 18.89% a year after Open Fiber opened an edge site nearby (DC Market Insights estimate).
TIM Enterprise leads with about 12% of 2025 spend, and TIM Enterprise, Aruba and Equinix together hold about 27% (DC Market Insights assessment). FiberCop, Open Fiber, Rai Way, Schneider Electric and Vertiv are other key players.
USD 745.67 million in the low case, USD 849.72 million in the base case and USD 953.78 million in the high case, depending on how many announced edge nodes are built (DC Market Insights estimate).
No. Cluster computing, applicant tracking software and digital storage devices can run inside edge nodes, but this report counts only edge data center hardware, software and services, USD 290.51 million in 2026. Storage gear installed in edge nodes is counted within Hardware.
Get this report
How do I get the full report?
Request a quote; we reply by email within one business day.
How and when will I receive the report?
By email, within 24–48 business hours of payment.
How can I pay?
Once you accept the quote, we email you a secure payment link.
Can I see a sample first?
Yes. Request a free sample and we will email it to you.
Can the report be tailored to my needs?
Yes. We can add countries, segments or data cuts. Talk to an analyst about the scope you need.
Can I get an invoice or pay against a purchase order?
Write to sales@dcmarketinsights.com and our team will help.