
Data Center Switchgear Market Size, Share & Forecast to 2035
Market at a glance
The Data Center Switchgear market was worth USD 6,220.0 million in 2025 and is forecast to reach USD 15.69 billion by 2035, growing at a 9.69% CAGR. North America accounts for 47.6% of the market.
 By Satyabrat Rajawat, Senior Research Analyst, Strategic Advisory
 Reviewed by Deepti Agrawal
Last updated 10 Oct 2026
Base year 2025 PDF + Excel
Reviewed by Deepti Agrawal
Last updated 10 Oct 2026
Base year 2025 PDF + Excel
Source: DC Market Insights analysis
Key findings
Energized Capacity Doubles from 13.4 GW to 27.4 GW a Year by 2035
Digital and Smart Switchgear Reaches 47.4% of Spend by 2035
Medium-Voltage Lead Times Run from 52 to 80 Weeks
AI and GPU Cloud Campuses Nearly Quadruple Switchgear Spend by 2035
What is inside the report
- 01Introduction
- 02Research Methodology
- 03Executive Summary
- 04Market Dynamics
- 05Pricing Analysis
- 06Standards and Regulation
- 07Supply Chain Analysis
- 08Market Size and Forecast
- 09Market by Product
- 10Market by Insulation (HV and MV Switchgear)
- 21chapters
- 2020-2024Historical period
- 2026-2035Forecast period
- 15Companies profiled
Regional insights
- North America47.6%
- Asia Pacific25.9%
- Europe17.1%
- Latin America4.5%
- Middle East and Africa4.9%
Segmentation
Companies profiled
- Schneider Electric
- Eaton
- ABB
- Siemens
- GE Vernova
- Hitachi Energy
- Mitsubishi Electric
- Legrand
- Vertiv
- Hubbell
- Powell Industries
- LS Electric
- HD Hyundai Electric
- Hyosung Heavy Industries
- Toshiba Energy Systems & Solutions
Recent developments
Mitsubishi Electric Power Products announced an investment of USD 86 million in switchgear production and power electronics in the United States, with the new plant initially producing vacuum and gas circuit breakers (Source: Utility Dive report).
Schneider Electric announced plans to invest USD 700 million in its US operations through 2027, including a plant expansion for greater switchgear and power distribution production (Source: Manufacturing Dive report).
Eaton acquired Fibrebond Corporation for USD 1.43 billion, net of cash acquired (Source: Eaton filing with the US Securities and Exchange Commission).
Hitachi Energy announced a USD 1 billion investment in US grid infrastructure manufacturing, including expanding its breaker and switchgear operations near Pittsburgh, Pennsylvania (Source: Data Center Dynamics report).
Eaton announced a USD 30 million, 370,000-square-foot medium-voltage switchgear factory in Bellevue, Nebraska, with air-insulated and gas-insulated switchgear production starting in the first half of 2027 (Source: Plant Services report).
ABB announced an investment of around USD 200 million in medium-voltage manufacturing across Europe, including SF6-free medium-voltage switchgear (Source: ABB press release).
Full analysis
The Data Center Switchgear Market covers the high-voltage, medium-voltage and low-voltage switchgear, switchboards and transfer switches that connect, protect and isolate the power path of a data center, from the campus substation breaker down to the switchboard that feeds the uninterruptible power supply (UPS) and the rows. DC Market Insights values the global Data Center Switchgear Market at USD 6.22 billion in 2025 and forecasts USD 15.69 billion by 2035, a CAGR of 9.69%. The 2025 value is built from the projects themselves: about 13.4 GW of energized-weighted IT capacity at roughly USD 0.40 million of switchgear per MW gives USD 5.35 billion of new-build spend, and retrofit and upgrade work on an installed base of about 104 GW adds USD 0.87 billion. Digital and smart switchgear is the fastest-growing segment at 17.76% a year because DC Market Insights expects breakers with embedded metering, arc-flash reduction and remote monitoring to become the default specification, and the Middle East and Africa is the fastest-growing region at 13.19% a year as DC Market Insights expects sovereign AI campuses in Saudi Arabia and the United Arab Emirates to build out from a small base.
Executive Summary
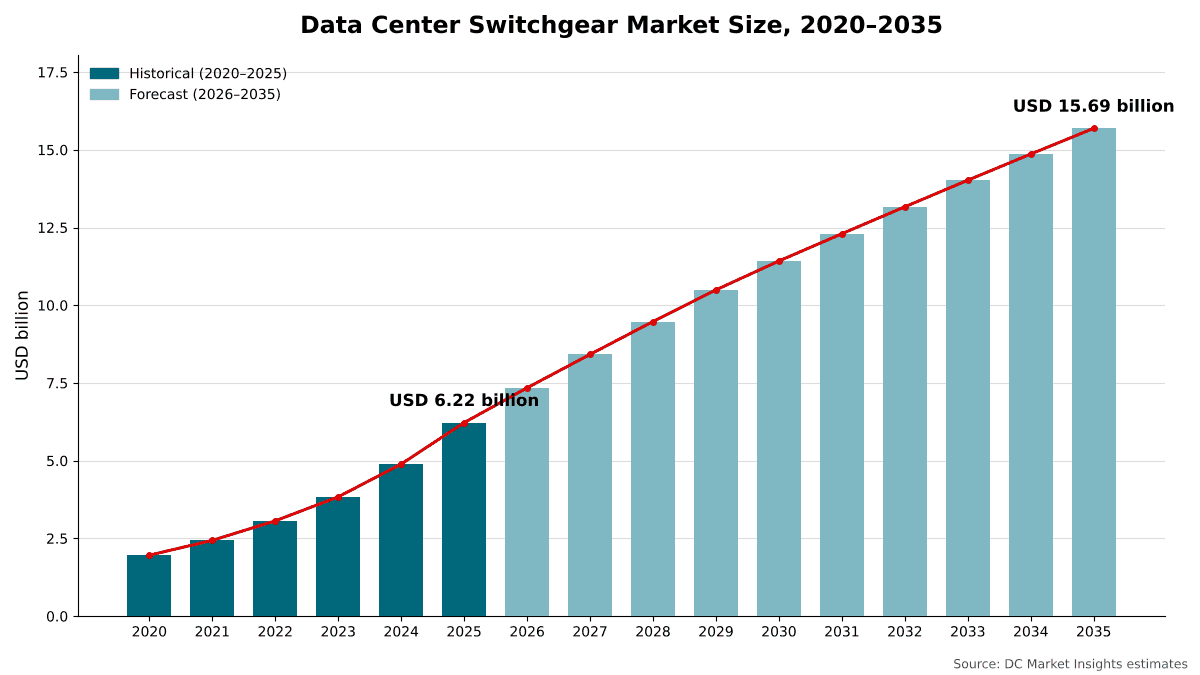
The Global Data Center Switchgear Market size was valued at USD 1.96 billion in 2020, reached USD 6.22 billion in 2025, and is anticipated to reach USD 15.69 billion by 2035, at a CAGR of 9.69% during the forecast period.
| Report attribute | Details |
|---|---|
| Historical Period | 2020-2024 |
| Base Year | 2025 |
| Forecast Period | 2026-2035 |
| Data Center Switchgear Market Size 2025 | USD 6.22 Billion |
| Data Center Switchgear Market, CAGR | 9.69% |
| Data Center Switchgear Market Size 2035 | USD 15.69 Billion |
The market grew at 25.99% a year between 2020 and 2025, and 2025 alone added 27.2% over 2024 as graphics processing unit (GPU) campuses moved from announcements to energization. DC Market Insights estimates that switchgear content rose from about USD 0.28 million per MW of IT load in 2020 to USD 0.40 million per MW in 2025, as more campuses built their own high-voltage bays and switchgear prices rose.
Growth slows to 9.69% a year from 2025 to 2035 as the base gets larger, while energized capacity still roughly doubles to 27.4 GW in 2035.
Market Scope: What Does the Data Center Switchgear Market Cover?
The Data Center Switchgear Market covers switching and protection equipment installed on data center campuses and inside data center buildings, valued at first sale in current US dollars, with 2025 as the base year and forecasts to 2035. DC Market Insights sizes it at USD 6.22 billion in 2025.
Included. High-voltage switchgear above 52 kV in customer-owned and utility delivery substations that serve a data center (air-insulated bays, gas-insulated switchgear and circuit breakers), medium-voltage switchgear from 1 kV to 52 kV (main lineups, generator paralleling switchgear and ring main units), low-voltage switchgear and switchboards up to 1,000 V AC or 1,500 V DC (main switchboards and distribution switchgear with their breakers), automatic transfer switches (ATS) and static transfer switches (STS), plus the embedded metering, protection relays and monitoring sold with the switchgear.
Excluded. Power and distribution transformers, UPS systems, power distribution units (PDU), remote power panels, busways, generators, standalone protection and control systems sold separately from switchgear, cables, utility transmission switchyards that do not serve a data center, and installation labor.
How the segments fit together. The product split (high-voltage, medium-voltage, low-voltage and transfer switches) sums to the full USD 6.22 billion. The insulation split covers only high-voltage and medium-voltage switchgear, worth USD 3.09 billion in 2025, because low-voltage switchgear is air-insulated by design. The technology, data center type and project type splits each re-cut the full market. The high-voltage switchgear line equals the high-voltage switchgear line in our Data Center Substation Market report, so the two reports can be read together without double counting.
Market Drivers: What Drives the Data Center Switchgear Market?
Three drivers explain most of the growth in the Data Center Switchgear Market: energized capacity that doubles from 13.4 GW to 27.4 GW a year by 2035, campuses that connect at transmission voltage, and vendor order books that have swollen with data center work.
Energized Capacity Doubles from 13.4 GW to 27.4 GW a Year by 2035
The Data Center Switchgear Market is a build market first: 86.0% of 2025 spending went into new halls and campuses. DC Market Insights models annual IT capacity completions rising from 12.0 GW in 2025 to 22.0 GW in 2030 and 27.0 GW in 2035. Because switchgear ships months before a hall is energized, the model weights each year’s demand 45% to that year’s completions and 55% to the next year’s, which gives 13.4 GW of switchgear-relevant capacity in 2025 and 27.4 GW in 2035. Demand-side data points the same way: the International Energy Agency (IEA) puts data center electricity use at about 415 TWh in 2024, or around 1.5% of world electricity, and expects it to more than double to around 945 TWh by 2030 (Source: IEA Energy and AI report). BloombergNEF forecast in December 2025 that US data center power demand could reach 106 GW in 2035, 36% higher than its previous forecast (as reported by Utility Dive).
Transmission-Voltage Campuses Lift High-Voltage Switchgear to USD 1.27 Billion
DC Market Insights assumes that a rising share of large campuses take power at transmission voltage and build their own substations, which moves high-voltage breakers and gas-insulated bays into the data center bill of materials. DC Market Insights estimates high-voltage switchgear at USD 1.27 billion in 2025, 20.4% of the market, growing to USD 3.50 billion by 2035 at 10.70% a year, the fastest of the four product lines. In May 2026, LS Electric was reported to have won a USD 64 million contract to supply 38 kV-class switchgear for a microgrid powering a US AI data center, an example of how on-site generation adds medium-voltage switching that a grid-only design would not need.
Vendor Order Books Show Data Center Demand Doubling in a Year
The largest switchgear makers report sharp growth in data center orders. GE Vernova reported second-quarter 2026 Electrification orders of USD 6.3 billion, up 66% organically, with data center orders reaching over USD 5 billion year-to-date, more than double its 2025 total (Source: GE Vernova Form 8-K filed with the US Securities and Exchange Commission). Siemens Smart Infrastructure recorded triple-digit order growth in its data center business, reaching around EUR 6 billion in the first nine months of fiscal 2026, and ABB said data center build-out drove exceptional triple-digit growth in that segment of its Electrification business in the second quarter of 2026. Eaton’s Electrical Americas segment posted record second-quarter 2026 sales of USD 4.0 billion, up 18% organically, with backlog up 33% over June 2025.
Market Trends: How Is Data Center Switchgear Changing?
The Data Center Switchgear Market is shifting toward digital breakers and SF6-free medium-voltage designs.
Digital and Smart Switchgear Reaches 47.4% of Spend by 2035
Digital and smart switchgear, with embedded metering, condition sensors, arc-flash reduction settings and network connections to the building management and electrical power monitoring systems, was worth USD 1.45 billion (23.3%) in 2025. DC Market Insights forecasts it to grow at 17.76% a year to USD 7.44 billion by 2035, when it accounts for 47.4% of the market. The data lets operators track breaker wear and coordinate protection settings as AI rack loads swing with training jobs.
SF6-Free Medium-Voltage Switchgear Grows at 26.60% a Year
SF6-free gas-insulated and vacuum switchgear was worth USD 256.24 million in 2025, 8.3% of high- and medium-voltage switchgear, and DC Market Insights forecasts USD 2.71 billion by 2035, a 33.7% share. The shift is driven by European rules (see Standards and Regulation), and DC Market Insights expects global operators to carry the same specification to other regions. In May 2026, ABB announced an investment of around USD 200 million in its medium-voltage manufacturing across Europe, including SF6-free medium-voltage switchgear.
Market Challenges: What Holds the Data Center Switchgear Market Back?
Lead times of a year or more for medium-voltage switchgear and an 89% rise in the switchgear producer price index since January 2020 are the two constraints that DC Market Insights expects to slow the Data Center Switchgear Market in 2026 and 2027.
Medium-Voltage Lead Times Run from 52 to 80 Weeks
A September 2026 analysis by the law firm Foley & Lardner cited procurement ranges of 52 to 80 weeks for medium-voltage switchgear. Reuters reported in July 2026 that data center construction is driving demand for circuit breakers and switchgear, pushing up costs and stretching wait times for US power companies. DataCentreNews UK reported in February 2026 that UK data centre demand is squeezing switchgear supply, with some commercial building schemes facing lead times of many months.
Switchgear Prices Rose 89% from January 2020 to August 2026
The US Bureau of Labor Statistics producer price index for switchgear and switchboard apparatus manufacturing stood at 411.453 in August 2026, against 363.074 in August 2025 and 217.200 in January 2020, a rise of 13.3% in a year and 89% since January 2020 (Source: US Bureau of Labor Statistics data via FRED). DC Market Insights carries part of the price rise into its spend-per-MW curves: switchgear content per MW rises 41% from 2020 to 2025 in the model, less than the index, because larger power blocks spread each lineup over more megawatts.
Market Opportunities: Where Are the New Revenue Pools?
The two largest new revenue pools in the Data Center Switchgear Market are AI and GPU cloud data centers, growing at 14.36% a year, and retrofit and upgrade work that grows from USD 0.87 billion to USD 3.14 billion by 2035.
AI and GPU Cloud Campuses Nearly Quadruple Switchgear Spend by 2035
AI and GPU cloud data centers spent USD 1.02 billion on switchgear in 2025, and DC Market Insights expects USD 3.91 billion by 2035, when they account for 24.9% of the market. Transformer supply follows the same pattern, as shown in our Data Center Transformer Market report.
Retrofit and Upgrade Spending Reaches USD 3.14 Billion by 2035
Older halls and AI density upgrades need new feeders and breakers. DC Market Insights models retrofit and upgrade spending at USD 0.87 billion in 2025 (14.0% of the market) and USD 3.14 billion in 2035 (20.0%), a CAGR of 13.65%.
Pricing: How Much Do Data Centers Spend on Switchgear per MW?
A new data center spends about USD 0.40 million on switchgear per MW of IT load in 2025, against USD 0.28 million per MW in 2020. These are DC Market Insights estimates covering high-voltage, medium-voltage and low-voltage switchgear and transfer switches, excluding labor.
| Switchgear spend per MW of IT load (USD million) | 2020 | 2025 | 2030 | 2035 |
|---|---|---|---|---|
| High-voltage switchgear | 0.064 | 0.081 | 0.089 | 0.104 |
| Medium-voltage switchgear | 0.079 | 0.118 | 0.127 | 0.134 |
| Low-voltage switchgear and switchboards | 0.119 | 0.172 | 0.181 | 0.188 |
| Transfer switches | 0.022 | 0.029 | 0.031 | 0.033 |
| Total | 0.284 | 0.400 | 0.428 | 0.458 |
Spend per MW keeps rising after 2025, but more slowly, at about 1.4% a year, led by high-voltage content. Cushman & Wakefield puts average greenfield development costs at USD 17.6 million per MW for the most modern facilities, up 21% per MW since its previous guide, so switchgear is about 2.3% of the cost of a new data center in the DC Market Insights model.
Standards and Regulation: Which Rules Shape Data Center Switchgear?
Four sets of rules decide which switchgear a data center may install: the EU F-gas Regulation, the US National Electrical Code (NFPA 70), the IEC 61439 assembly standard and UL 1008 for transfer switches.
EU F-gas Regulation (EU) 2024/573. From 1 January 2026, medium-voltage switchgear for primary and secondary distribution up to and including 24 kV may not be put into operation if it relies on fluorinated gases such as SF6. The ban extends to medium-voltage switchgear above 24 kV and up to 52 kV from 1 January 2030, to high-voltage switchgear from 52 kV to 145 kV (up to 50 kA) from 1 January 2028, and to high-voltage switchgear above 145 kV or above 50 kA short-circuit current from 1 January 2032.
National Electrical Code section 240.87. The arc energy reduction requirement, first introduced in the 2014 edition of the National Electrical Code, applies where the highest continuous current trip setting of a breaker is 1,200 amperes or higher, and accepts methods such as zone-selective interlocking, differential relaying and energy-reducing maintenance switching. In the DC Market Insights view, most main breakers in a data center fall under it, which favors digital trip units.
IEC 61439-1. The international standard for low-voltage switchgear and controlgear assemblies applies to assemblies whose rated voltage does not exceed 1,000 V AC or 1,500 V DC, which in the DC Market Insights view means the same assembly rules can cover direct current distribution inside a data hall.
UL 1008. The US standard for transfer switch equipment, published in July 2022, applies to transfer switches rated up to 1,000 V and excludes solid-state transfer equipment, so static transfer switches fall outside its scope.
Market Segmentation: Which Segment Leads the Data Center Switchgear Market?
Low-voltage switchgear and switchboards lead the Data Center Switchgear Market with 42.5% of 2025 value, and hyperscale data centers lead buyers with 47.3%. Digital and smart switchgear is the fastest-growing segment of the full market at 17.76% a year, because arc-energy rules and AI load swings make embedded monitoring a default specification; within high- and medium-voltage switchgear, SF6-free designs grow even faster at 26.60% a year from a small base.
By Product: Low-Voltage Switchgear and Switchboards Lead with 42.5%
| Product | 2025 (USD billion) | Share 2025 | 2035 (USD billion) | CAGR 2025-2035 |
|---|---|---|---|---|
| High-Voltage Switchgear | 1.27 | 20.4% | 3.50 | 10.70% |
| Medium-Voltage Switchgear | 1.82 | 29.2% | 4.54 | 9.57% |
| Low-Voltage Switchgear and Switchboards | 2.65 | 42.5% | 6.39 | 9.22% |
| Transfer Switches | 0.49 | 7.9% | 1.26 | 9.89% |
High-voltage switchgear gains 1.9 points of share by 2035 as campus substations become standard for large sites.
By Insulation: Air-Insulated Switchgear Leads with 53.8%
| Insulation (HV and MV switchgear) | 2025 (USD billion) | Share 2025 | 2035 (USD billion) | CAGR 2025-2035 |
|---|---|---|---|---|
| Air-Insulated Switchgear (AIS) | 1.66 | 53.8% | 3.59 | 8.00% |
| SF6 Gas-Insulated Switchgear | 1.17 | 37.9% | 1.74 | 4.08% |
| SF6-Free Gas-Insulated and Vacuum Switchgear | 0.26 | 8.3% | 2.71 | 26.60% |
The insulation split covers USD 3.09 billion of high- and medium-voltage switchgear in 2025. SF6 designs keep growing in absolute terms outside Europe, but their share falls from 37.9% to 21.7% by 2035.
By Technology: Conventional Switchgear Leads with 76.4%
Conventional switchgear accounts for USD 4.76 billion (76.4%) in 2025 and grows at 4.94% a year to USD 7.70 billion. Digital and smart switchgear grows from USD 1.45 billion (23.3%) to USD 7.44 billion. Solid-state switchgear, which replaces mechanical contacts with power semiconductors for very fast fault clearing, is worth USD 18.67 million (0.3%) in 2025 and USD 549.17 million by 2035, a CAGR of 40.23%, on the DC Market Insights assumption that direct current distribution for AI racks moves from pilots to production.
By Data Center Type: Hyperscale Data Centers Lead with 47.3%
| Data center type | 2025 (USD billion) | Share 2025 | 2035 (USD billion) | CAGR 2025-2035 |
|---|---|---|---|---|
| Hyperscale Data Centers | 2.94 | 47.3% | 7.31 | 9.52% |
| Colocation Data Centers | 1.69 | 27.1% | 3.58 | 7.81% |
| AI and GPU Cloud Data Centers | 1.02 | 16.4% | 3.91 | 14.36% |
| Enterprise and Edge Data Centers | 0.57 | 9.2% | 0.89 | 4.56% |
AI and GPU cloud data centers grow fastest; enterprise and edge data centers grow slowest as workloads move to cloud and colocation.
By Project Type: New Build Leads with 86.0%
New build accounts for USD 5.35 billion (86.0%) in 2025 and USD 12.55 billion by 2035, a CAGR of 8.90%. Retrofit and upgrade accounts for USD 0.87 billion (14.0%) and grows at 13.65% a year to USD 3.14 billion, as the installed base nearly triples and older halls replace breakers to add capacity, meet arc-energy rules and remove SF6.
DC Exclusive: The Switchgear Spend per MW Model and Product × Data Center Type Matrix
At USD 1.15 billion in 2025, low-voltage switchgear for hyperscale data centers is the single largest cell of the matrix and 18.5% of all data center switchgear spending. It is a DC Market Insights model, not a shipment count, built from 54 inputs: 17 annual completion cohorts (2019 to 2035, energized-weighted), 16 spend-per-MW points (4 products in 4 anchor years), 4 retrofit rates, 4 buyer splits, 5 regional splits, 2 substation-report anchors for high-voltage switchgear and 6 bound checks.
| 2025, USD billion | High-Voltage | Medium-Voltage | Low-Voltage | Transfer Switches | Total |
|---|---|---|---|---|---|
| Hyperscale Data Centers | 0.73 | 0.87 | 1.15 | 0.19 | 2.94 |
| Colocation Data Centers | 0.29 | 0.50 | 0.75 | 0.15 | 1.69 |
| AI and GPU Cloud Data Centers | 0.21 | 0.31 | 0.43 | 0.07 | 1.02 |
| Enterprise and Edge Data Centers | 0.03 | 0.14 | 0.32 | 0.08 | 0.57 |
| Total | 1.27 | 1.82 | 2.65 | 0.49 | 6.22 |
Totals are computed before rounding. Hyperscale buyers put 24.7% of their switchgear budget into high-voltage gear because they own their campus substations, while enterprise and edge data centers put 55.5% into low-voltage switchgear and 13.9% into transfer switches, since they take power at distribution voltage and rely on generator transfer.
The switchgear spend per MW model behind these figures has two inputs that any reader can check: energized capacity each year (13.4 GW in 2025) and switchgear content per MW (USD 0.40 million in 2025). Multiplying the two gives new-build spend; adding retrofit spend on the installed base gives the market. The model and its assumptions are explained on our research methodology page.
Regional Insights: Which Region Leads the Data Center Switchgear Market?
North America leads the Data Center Switchgear Market with 47.6% of 2025 value, and the Middle East and Africa is the fastest-growing region at 13.19% a year, because DC Market Insights expects sovereign AI programs in Saudi Arabia and the United Arab Emirates to add campus-scale capacity from a small base.
North America Leads with 47.6% Share
North American data centers spent USD 2.96 billion on switchgear in 2025, and the region is forecast to reach USD 6.86 billion in 2035, a CAGR of 8.76%. The IEA attributes 45% of global data center electricity use in 2024 to the United States, and the switchgear makers are adding US capacity: Hitachi Energy announced a USD 1 billion US investment in September 2025 that includes expanding breaker and switchgear manufacturing near Pittsburgh, and Eaton is building a USD 30 million, 370,000-square-foot medium-voltage switchgear factory in Bellevue, Nebraska.
Asia Pacific Holds 25.9% Share
Asia Pacific is worth USD 1.61 billion in 2025 and USD 4.54 billion by 2035, a CAGR of 10.90%. In the DC Market Insights allocation, China is the largest market in the region and India and Malaysia grow fastest. Asia Pacific gains 3.0 points of share by 2035, the largest gain of any region.
Europe Holds 17.1% Share
Europe is worth USD 1.06 billion in 2025 and USD 2.41 billion by 2035, a CAGR of 8.54%. DC Market Insights expects grid connection limits in the main hubs to cap the pace of new builds, while the F-gas Regulation lifts the value of each medium-voltage panel as buyers move to SF6-free designs.
Latin America Holds 4.5% Share
Latin America is worth USD 280.09 million in 2025 and USD 827.52 million by 2035, a CAGR of 11.44%; Brazil is the largest country market in the region in the DC Market Insights allocation.
Middle East and Africa Holds 4.9% Share
The Middle East and Africa is worth USD 304.99 million in 2025 and USD 1.05 billion by 2035, the fastest regional growth at 13.19% a year. DC Market Insights expects Saudi Arabia and the United Arab Emirates to drive most of the growth, with South Africa adding colocation capacity.
Country Analysis: Which Countries Buy the Most Data Center Switchgear?
The United States is the largest country market for data center switchgear at USD 2.60 billion in 2025, 41.8% of global value, followed by China at USD 631.94 million (10.2%) and Canada at USD 361.45 million (5.8%). The 12 largest countries account for 80.5% of 2025 spending.
| Rank | Country | Region | 2025 (USD billion) | Share 2025 | 2035 (USD billion) | CAGR 2025-2035 |
|---|---|---|---|---|---|---|
| 1 | United States | North America | 2.60 | 41.8% | 5.91 | 8.56% |
| 2 | China | Asia Pacific | 0.63 | 10.2% | 1.61 | 9.81% |
| 3 | Canada | North America | 0.36 | 5.8% | 0.95 | 10.10% |
| 4 | Japan | Asia Pacific | 0.23 | 3.7% | 0.58 | 9.68% |
| 5 | Germany | Europe | 0.21 | 3.3% | 0.45 | 8.25% |
| 6 | United Kingdom | Europe | 0.19 | 3.1% | 0.42 | 7.98% |
| 7 | India | Asia Pacific | 0.19 | 3.1% | 0.76 | 14.89% |
| 8 | Australia | Asia Pacific | 0.16 | 2.5% | 0.49 | 11.88% |
| 9 | Brazil | Latin America | 0.13 | 2.0% | 0.36 | 11.17% |
| 10 | France | Europe | 0.12 | 1.9% | 0.28 | 8.92% |
| 11 | Malaysia | Asia Pacific | 0.11 | 1.8% | 0.40 | 13.31% |
| 12 | Saudi Arabia | Middle East and Africa | 0.08 | 1.3% | 0.33 | 14.79% |
India is the fastest-growing large country market at 14.89% a year, ahead of Saudi Arabia at 14.79% and Malaysia at 13.31%, as hyperscale and colocation operators add capacity outside the established hubs. The country figures are a DC Market Insights allocation of the regional totals, weighted by each country’s estimated share of installed and new data center capacity.
Forecast Scenarios: How Could the 2035 Forecast Change?
The Data Center Switchgear Market reaches USD 15.69 billion by 2035 in the base case, with a range of USD 13.12 billion to USD 18.08 billion across the low and high scenarios.
| Scenario | Assumption from 2026 | 2035 (USD billion) | CAGR 2025-2035 |
|---|---|---|---|
| Low | Capacity completions 15% below base; switchgear prices flat in real terms after 2027 | 13.12 | 7.74% |
| Base | Completions rise to 27.0 GW a year; spend per MW reaches USD 0.46 million | 15.69 | 9.69% |
| High | Completions 12% above base; faster move to transmission-voltage campuses and digital switchgear | 18.08 | 11.25% |
The low case reflects a two-year pause in AI capital spending; the high case assumes grid connections and factory capacity keep pace with announced hyperscale plans.
Competitive Insights: Who Leads the Data Center Switchgear Market?
- Schneider Electric
- Eaton
- ABB
- Siemens
- GE Vernova
- Hitachi Energy
- Mitsubishi Electric
- Legrand
- Vertiv
- Hubbell
- Powell Industries
- LS Electric
- HD Hyundai Electric
- Hyosung Heavy Industries
- Toshiba Energy Systems & Solutions
Schneider Electric is the market leader with about 16% of the Data Center Switchgear Market in 2025, and the three largest suppliers, Schneider Electric, Eaton and ABB, together hold about 40% (DC Market Insights estimate, based on each company’s data center exposure, factory footprint and reported order trends). Data centers accounted for 30% of Schneider Electric’s end-market exposure, measured as a percentage of 2025 orders, and demand in its Data Center & Networks end market was up triple-digit in the second quarter of 2026. Eaton is adding medium-voltage switchgear capacity in North America, and its Electrical Americas backlog rose 33% over June 2025. ABB reported Electrification orders of USD 7.23 billion in the second quarter of 2026, up 60%. Hitachi Energy and Mitsubishi Electric are expanding US breaker and switchgear manufacturing, and HD Hyundai Electric, Hyosung and Toshiba also supply high-voltage equipment, in the DC Market Insights view. Legrand’s data center business now accounts for 32% of its revenue, Hubbell reported that data center investment drove 10% organic growth in the second quarter of 2026, and Powell Industries reported Commercial and Other Industrial revenue of USD 76.3 million in the quarter to June 2026 against USD 49.5 million a year earlier.
Recent Developments
- In December 2024, Mitsubishi Electric Power Products announced an investment of USD 86 million in switchgear production and power electronics in the United States, with the new plant initially producing vacuum and gas circuit breakers (Source: Utility Dive report).
- In March 2025, Schneider Electric announced plans to invest USD 700 million in its US operations through 2027, including a plant expansion for greater switchgear and power distribution production (Source: Manufacturing Dive report).
- In April 2025, Eaton acquired Fibrebond Corporation for USD 1.43 billion, net of cash acquired (Source: Eaton filing with the US Securities and Exchange Commission).
- In September 2025, Hitachi Energy announced a USD 1 billion investment in US grid infrastructure manufacturing, including expanding its breaker and switchgear operations near Pittsburgh, Pennsylvania (Source: Data Center Dynamics report).
- In April 2026, Eaton announced a USD 30 million, 370,000-square-foot medium-voltage switchgear factory in Bellevue, Nebraska, with air-insulated and gas-insulated switchgear production starting in the first half of 2027 (Source: Plant Services report).
- In May 2026, ABB announced an investment of around USD 200 million in medium-voltage manufacturing across Europe, including SF6-free medium-voltage switchgear (Source: ABB press release).
We follow these deals, launches and capacity announcements as they happen in our data center industry updates.
Methodology: How We Built the Data Center Switchgear Market Model
DC Market Insights built this market bottom-up from 17 annual IT capacity completion cohorts (2019 to 2035), with switchgear demand in each year set at 45% of that year’s completions plus 55% of the next year’s to reflect delivery ahead of energization, which gives 13.4 GW of energized-weighted capacity in 2025. Each cohort was priced with four switchgear spend-per-MW curves (high-voltage, medium-voltage, low-voltage and transfer switches) anchored in 2020, 2025, 2030 and 2035, for a total of USD 0.28 million per MW in 2020, USD 0.40 million in 2025 and USD 0.46 million in 2035. Retrofit and upgrade spending was added on the installed base (about 104 GW at the start of 2025) at about USD 7,600 per MW of installed base per year in 2020, rising 2% a year. The total was split by 4 products, 3 insulation types, 3 technologies, 4 data center types, 2 project types and 5 regions, and every split sums to its total. No supplier discloses data center switchgear sales as a separate line in the filings reviewed, so the result was tested against six bound checks: the high-voltage line equals the high-voltage switchgear line of the DC Market Insights Data Center Substation Market model (USD 1.27 billion in 2025 and USD 3.50 billion in 2035); the rise in spend per MW from 2020 to 2025 (41%) stays below the 67% rise in the US switchgear producer price index from January 2020 to August 2025; switchgear spend of USD 0.40 million per MW is about 2.3% of the USD 17.6 million per MW greenfield development cost reported by Cushman & Wakefield; GE Vernova’s more than USD 5 billion of data center orders in the first half of 2026 across its whole Electrification portfolio stays well above what the model assigns to any single vendor’s switchgear; LS Electric’s single USD 64 million order sits well below the modeled North American market; and Powell Industries’ Commercial and Other Industrial revenue of USD 76.3 million a quarter sits well below the modeled US market. The analyst named on this page built the model, and the reviewer checked the arithmetic, the sources and the dates before publication.
Table of contents
- 01Introduction
- 1.1Market Definition and Scope
- 1.2Research Objectives
- 1.3Currency, Units and Base Year
- 02Research Methodology
- 2.1Bottom-Up Switchgear Spend per MW Model
- 2.2Energized-Weighted Capacity Cohorts
- 2.3Bound Checks and Validation
- 2.4Assumptions and Limitations
- 03Executive Summary
- 3.1Market Snapshot, 2025 and 2035
- 3.2Key Findings
- 3.3Analyst View
- 04Market Dynamics
- 4.1Market Drivers
- 4.2Market Trends
- 4.3Market Challenges
- 4.4Market Opportunities
- 05Pricing Analysis
- 5.1Switchgear Spend per MW by Product, 2020, 2025, 2030 and 2035
- 5.2Producer Price Trends
- 5.3Switchgear Share of Data Center Build Cost
- 06Standards and Regulation
- 6.1EU F-gas Regulation (EU) 2024/573
- 6.2National Electrical Code Section 240.87
- 6.3IEC 61439-1
- 6.4UL 1008
- 07Supply Chain Analysis
- 7.1Component and Breaker Suppliers
- 7.2Switchgear Assemblers and Integrators
- 7.3Lead Times and Factory Capacity
- 08Market Size and Forecast
- 8.1Market Size, 2020-2035
- 8.2New Build versus Retrofit and Upgrade
- 8.3Year-on-Year Growth
- 09Market by Product
- 9.1High-Voltage Switchgear
- 9.2Medium-Voltage Switchgear
- 9.3Low-Voltage Switchgear and Switchboards
- 9.4Transfer Switches
- 10Market by Insulation (HV and MV Switchgear)
- 10.1Air-Insulated Switchgear (AIS)
- 10.2SF6 Gas-Insulated Switchgear
- 10.3SF6-Free Gas-Insulated and Vacuum Switchgear
- 11Market by Technology
- 11.1Conventional Switchgear
- 11.2Digital and Smart Switchgear
- 11.3Solid-State Switchgear
- 12Market by Data Center Type
- 12.1Hyperscale Data Centers
- 12.2Colocation Data Centers
- 12.3AI and GPU Cloud Data Centers
- 12.4Enterprise and Edge Data Centers
- 13Market by Project Type
- 13.1New Build
- 13.2Retrofit and Upgrade
- 14DC Exclusive: Switchgear Spend per MW Model
- 14.1Product × Data Center Type Matrix, 2025
- 14.2Model Inputs
- 15Market by Region
- 15.1North America (United States, Canada)
- 15.2Asia Pacific (China, Japan, India, Australia, Malaysia)
- 15.3Europe (Germany, United Kingdom, France)
- 15.4Latin America (Brazil)
- 15.5Middle East and Africa (Saudi Arabia)
- 16Country Analysis
- 16.1Top 12 Countries, 2025 and 2035
- 16.2Fastest-Growing Countries
- 17Regional Cross-Sections
- 17.1Region by Product, 2025 and 2035
- 17.2Region by Data Center Type, 2025 and 2035
- 18Forecast Scenarios
- 18.1Low Scenario
- 18.2Base Scenario
- 18.3High Scenario
- 19Competitive Landscape
- 19.1Market Share Estimates, 2025
- 19.2Factory Investments and Capacity Additions
- 19.3Recent Developments
- 20Company Profiles
- 20.1Schneider Electric
- 20.2Eaton
- 20.3ABB
- 20.4Siemens
- 20.5GE Vernova
- 20.6Hitachi Energy
- 20.7Mitsubishi Electric
- 20.8Legrand
- 20.9Vertiv
- 20.10Hubbell
- 20.11Powell Industries
- 20.12LS Electric
- 20.13HD Hyundai Electric
- 20.14Hyosung Heavy Industries
- 20.15Toshiba Energy Systems & Solutions
- 21Analyst Recommendations
- 21.1For Data Center Operators
- 21.2For Switchgear Suppliers
- 21.3For Investors
- Fig. 1Data Center Switchgear Market Size, 2020-2035
- Fig. 2Data Center Switchgear Market by Region, 2025 and 2035
- Fig. 3Switchgear Spend per MW by Product, 2020-2035
- Fig. 4Market Share by Product, 2025 and 2035
- Fig. 5Market Share by Data Center Type, 2025 and 2035
- Table 1Report Attributes
- Table 2Switchgear Spend per MW by Product, 2020, 2025, 2030 and 2035
- Table 3Market by Product, 2025 and 2035
- Table 4Market by Insulation, 2025 and 2035
- Table 5Market by Technology, 2025 and 2035
- Table 6Market by Data Center Type, 2025 and 2035
- Table 7Market by Project Type, 2025 and 2035
- Table 8Product × Data Center Type Matrix, 2025
- Table 9Market by Region, 2025 and 2035
- Table 10Top 12 Countries, 2025 and 2035
- Table 11Forecast Scenarios, 2035
- Table 12Recent Developments
About this report
Written by Satyabrat Rajawat and reviewed by Deepti Agrawal, Senior Editor, Research. Figures are built top-down and bottom-up and reconciled before publication, with 2025 as the base year.
Read our methodologyHow we built this
- Historical period2020-2024
- Base year2025
- Forecast period2026-2035
- Sizing approachTop-down + bottom-up
Need more than the report?
Advisory on this market
Due diligence, site selection and market entry work, by the analysts who wrote this report.
See consulting servicesFrequently asked questions
USD 6.22 billion in 2025, rising to USD 15.69 billion by 2035. DC Market Insights estimates the market at USD 1.96 billion in 2020.
9.69% a year from 2025 to 2035. Growth was faster, at 25.99% a year, between 2020 and 2025 as AI campuses moved to energization.
Low-voltage switchgear and switchboards, with USD 2.65 billion or 42.5% of the market in 2025. High-voltage switchgear grows fastest among products at 10.70% a year.
About USD 0.40 million per MW of IT load in 2025, up from USD 0.28 million in 2020, according to DC Market Insights estimates covering high-, medium- and low-voltage switchgear and transfer switches.
North America, with USD 2.96 billion or 47.6% of 2025 value. The Middle East and Africa grows fastest at 13.19% a year.
Schneider Electric leads with about 16% of the market, and Schneider Electric, Eaton and ABB together hold about 40% (DC Market Insights estimate). Siemens, GE Vernova, Hitachi Energy, Mitsubishi Electric, Legrand, Vertiv and Hubbell also compete.
26.60% a year, from USD 256.24 million in 2025 to USD 2.71 billion by 2035, as the EU F-gas Regulation stops F-gas medium-voltage switchgear up to 24 kV from being put into operation from 1 January 2026.
USD 2.60 billion in the United States, or 41.8% of 2025 spending, followed by China at USD 631.94 million. India grows fastest among large country markets at 14.89% a year (DC Market Insights estimate).
Licences, delivery and payment
Which licence should I choose?
Single User is a view-only PDF for one person. Multi User adds a printable PDF and the Excel data for unlimited users at one location. Enterprise covers your whole company and includes 100 free analyst hours.
How and when will I receive the report?
By email, within 24–48 business hours of payment, in the formats of your licence.
How can I pay?
Securely through PayPal: with a PayPal account, a debit or credit card, or PayPal Pay Later where available. Prices are in US dollars.
Can I see a sample first?
Yes. Request a free sample and we will email it to you.
Can the report be tailored to my needs?
Yes. We can add countries, segments or data cuts. Talk to an analyst about the scope you need.
Can I get an invoice or pay against a purchase order?
Write to sales@dcmarketinsights.com and our team will help.