
Server Chassis Market Size, Share & Forecast to 2035
Market at a glance
The Server Chassis market was worth USD 2,880.0 million in 2025 and is forecast to reach USD 6,530.0 million by 2035, growing at a 8.55% CAGR. North America accounts for 45% of the market.
 By Amit Jain, Senior Consultant, ICT & Emerging Technologies
 Reviewed by Deepti Agrawal
Last updated 13 Oct 2026
Base year 2025 PDF + Excel
Reviewed by Deepti Agrawal
Last updated 13 Oct 2026
Base year 2025 PDF + Excel
Source: DC Market Insights analysis
Key findings
AI Capacity Adds USD 3.14 billion of GPU Chassis Demand by 2035
Liquid-Cooled Chassis Reach 58.4% of Value by 2035
Steel and Aluminium Tariffs Raise Chassis Costs
Liquid-Cooled Chassis Add USD 3.46 billion by 2035
What is inside the report
- 01Introduction
- 02Research Methodology
- 03Executive Summary
- 04Market Scope: What Does the Server Chassis Market Cover?
- 05Why Do Server Chassis Market Estimates Differ?
- 06Market Drivers: What Drives the Server Chassis Market?
- 07Market Trends: How Is Server Chassis Design Changing?
- 08Market Challenges: What Holds the Server Chassis Market Back?
- 09Market Opportunities: Where Are the New Revenue Pools?
- 10Pricing: How Much Does a Server Chassis Cost?
- 21chapters
- 2020-2024Historical period
- 2026-2035Forecast period
- 14Companies profiled
Regional insights
- North America45%
- Asia Pacific33%
- Europe15%
- Middle East and Africa3.6%
- Latin America3.4%
Segmentation
Companies profiled
- Chenbro Micom
- Asia Vital Components (AVC)
- Ablecom Technology
- Super Micro Computer (Supermicro)
- Hon Hai Precision Industry (Foxconn)
- Wiwynn
- Quanta Cloud Technology
- Inventec
- Wistron
- AIC Inc
- Giga Computing (GIGABYTE)
- Celestica
- Jabil
- Compucase Enterprise
Recent developments
the US raised the Section 232 tariff on steel and aluminium imports from 25% to 50% (Source: The White House).
Chenbro announced its US NPI site for the fourth quarter of 2025 and a planned Texas mass-production site (Source: Chenbro).
Foxconn and OpenAI agreed to co-design and build AI data center racks in the US (Source: Hon Hai).
the US moved to a flat 50% tariff on articles made almost entirely of steel, aluminium or copper (Source: The White House).
Chenbro showed an NVIDIA Vera Rubin server chassis based on MGX at COMPUTEX (Source: Chenbro).
Wiwynn opened its Texas plant for air-cooled and liquid-cooled racks (Source: Wiwynn).
Full analysis
The Server Chassis Market is valued at USD 3.28 billion in 2026 and is projected to reach USD 6.53 billion by 2035, up from USD 2.88 billion in 2025, a CAGR of 8.55% from 2025 to 2035 (DC Market Insights estimate). The market covers the metal enclosures that house data center servers, including 1U and 2U rack-mount chassis, multi-node and blade chassis, storage server and just a bunch of disks (JBOD) enclosures, and the 4U to 8U and modular chassis built around graphics processing units (GPUs) and other accelerators, together with their backplanes, drive cages, air shrouds and in-chassis liquid-cooling provisions, as used in every data center. The build receipt: about 12.36 million general-purpose and storage servers at an average of USD 135 to USD 340 per chassis give USD 1.97 billion in 2025, and about 603 thousand accelerator server nodes at roughly USD 1,500 per chassis add USD 904.42 million. GPU and accelerator server chassis are the fastest-growing chassis type at 16.17% a year because AI capacity rises from 35% of new data center capacity in 2025 to 66% in 2035, and the Middle East and Africa is the fastest-growing region at 14.24% a year as Saudi Arabia and the United Arab Emirates (UAE) fit out gigawatt-scale AI campuses from a small base.
Key Market Statistics: How Big Is the Server Chassis Market in 2026?
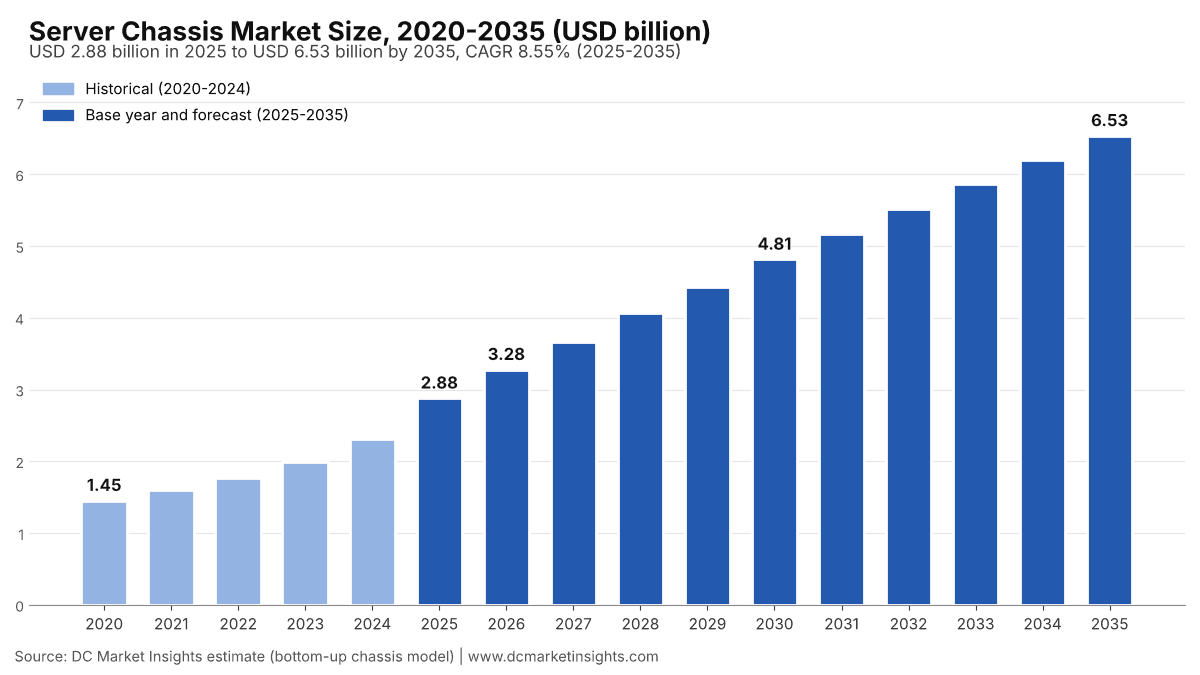
DC Market Insights values the Server Chassis Market at USD 3.28 billion in 2026, 13.9% above the USD 2.88 billion of 2025.
- Market size 2025: USD 2.88 billion
- Market size 2026: USD 3.28 billion
- Market size 2030: USD 4.81 billion
- Market size 2035: USD 6.53 billion
- CAGR 2025-2035: 8.55% in the base case, 5.97% in the low case and 10.43% in the high case
- Largest chassis type: rack-mount general-purpose server chassis, 43.9% of 2025 value (USD 1.26 billion)
- Fastest-growing chassis type: GPU and accelerator server chassis, 16.17% a year, reaching 62.0% of value by 2035
- Fastest-growing cooling design: liquid-cooled chassis, 26.76% a year, from USD 356.00 million to USD 3.81 billion
- Leading region: North America, 45.0% of 2025 value (USD 1.29 billion)
- Fastest-growing region: Middle East and Africa, 14.24% a year
- Largest country: the United States, USD 1.17 billion in 2025 (40.5% of global value)
- Market leader: Chenbro Micom, followed by Asia Vital Components (AVC) and Ablecom Technology (DC Market Insights assessment)
Executive Summary
The Global Server Chassis Market size was valued at USD 1.45 billion in 2020, reached USD 2.88 billion in 2025, and is anticipated to reach USD 6.53 billion by 2035, at a CAGR of 8.55% during the forecast period.
| Report attribute | Details |
|---|---|
| Historical Period | 2020-2024 |
| Base Year | 2025 |
| Forecast Period | 2026-2035 |
| Server Chassis Market Size 2025 | USD 2.88 Billion |
| Server Chassis Market Size 2026 | USD 3.28 Billion |
| Server Chassis Market, CAGR | 8.55% |
| Server Chassis Market Size 2035 | USD 6.53 Billion |
The market grew at 14.68% a year between 2020 and 2025, and 2025 alone added 24.9% over the USD 2.30 billion of 2024 as annual data center completions jumped from 8.8 GW to 12.0 GW and accelerator server nodes rose from about 368 thousand to 603 thousand. Growth eases to 8.55% a year from 2025 to 2035 because general-purpose server units flatten at about 13.5 million a year: denser processors put more compute in each box, so general-purpose chassis value grows only 2.31% a year. GPU and accelerator chassis carry the market instead, rising from 31.4% of value in 2025 to 62.0% in 2035, and liquid-cooled designs rise from 12.4% to 58.4% of value.
Market Scope: What Does the Server Chassis Market Cover?
The Server Chassis Market covers every enclosure that houses a server, storage server or accelerator node inside a data center, valued at the price the server maker pays for the chassis in current US dollars; DC Market Insights sizes it at USD 2.88 billion in 2025 and USD 3.28 billion in 2026.
Included. Rack-mount chassis in 1U, 2U and 4U heights for general-purpose servers; multi-node and blade chassis that share power and cooling across two to eight nodes; storage server chassis and JBOD enclosures; GPU and accelerator chassis for 4U to 8U eight-GPU servers, NVIDIA MGX modular servers and the compute and switch tray enclosures of rack-scale AI systems; the backplanes, drive cages, front panels, air shrouds and in-chassis liquid-cooling manifolds and brackets delivered with the chassis. Both 19-inch Electronic Industries Alliance (EIA) chassis and 21-inch Open Compute Project (OCP) Open Rack sleds are counted.
Excluded. Rack cabinets and enclosures for whole racks, slide rails, power supply units, fans, cold plates and coolant distribution units, motherboards, desktop PC cases, industrial and embedded computer chassis, and network switch or telecom chassis. These sit in their own DC Market Insights reports, such as the U.S. Data Center Racks Market.
How the segments fit together. Chassis type, cooling design and end user each split the same USD 2.88 billion of 2025 value, so every dimension sums to the total in every year from 2020 to 2035. Regions and countries are allocated by where the servers are deployed, not where the chassis are stamped, which is why Taiwan, Vietnam and Mexico, the main production bases, are not among the largest country markets.
Why Do Server Chassis Market Estimates Differ?
DC Market Insights values the Server Chassis Market at USD 3.28 billion in 2026 for data center server enclosures only; estimates that add desktop and gaming PC cases, industrial computer chassis, rack cabinets or slide rails come out two to four times larger.
Broader definitions mix three different products. Desktop and tower PC cases sell in tens of millions of units a year to consumers and gamers and have nothing to do with data center demand. Industrial and embedded chassis follow factory automation and military budgets. Rack cabinets and slide rails are bought per rack rather than per server: King Slide, the largest server rail maker, reported NT$16.28 billion of revenue in the first half of 2026, up 98.95%, which shows how large the rail line alone is. This report keeps all of these out of scope and counts enterprise and government buyers, telecom and edge operators and GPU cloud providers alongside hyperscale cloud providers, because each buys servers in data centers.
| Element | In this report | Why |
|---|---|---|
| Rack-mount, multi-node and blade server chassis | Yes (USD 1.47 billion in 2025) | Core data center server enclosure |
| Storage server and JBOD enclosures | Yes (USD 504.26 million) | Installed in the same racks as servers |
| GPU and accelerator chassis, MGX and rack-scale tray enclosures | Yes (USD 904.42 million) | Fastest-growing data center server enclosure |
| Desktop, tower and gaming PC cases | No | Consumer product, not data center demand |
| Industrial, embedded and telecom chassis | No | Different buyers and standards |
| Rack cabinets, slide rails, power supplies, fans and cold plates | No | Separate component markets with their own suppliers |
Small and mid-sized enterprises (SMEs) that buy a few rack servers a year are in scope through the enterprise and government segment, which holds 31.0% of 2025 value.
Market Drivers: What Drives the Server Chassis Market?
Three drivers lift the Server Chassis Market from USD 2.88 billion in 2025 to USD 6.53 billion in 2035: AI server builds, record server spending and denser chassis designs.
AI Capacity Adds USD 3.14 billion of GPU Chassis Demand by 2035
About 4.2 GW of the 12.0 GW of new data center capacity built in 2025 was AI capacity, and DC Market Insights expects the AI share to reach 60% in 2030 and 66% in 2035. Each AI megawatt needs about 110 accelerator nodes in 2025 at 9 kW per node, and each node needs a chassis worth roughly USD 1,500, about 11 times the price of a general-purpose 1U or 2U chassis. Supermicro, which sells complete AI servers, guided fiscal 2027 net sales of USD 65.0 billion to USD 72.0 billion in August 2026, against USD 22.0 billion two years earlier. The result is GPU and accelerator chassis growth from USD 904.42 million in 2025 to USD 4.05 billion in 2035.
Server Spending Reached USD 366.0 Billion in 2025
International Data Corporation (IDC) forecast a record USD 366.0 billion of server revenue for 2025, 55.3% above the USD 235.7 billion of 2024, and reported USD 112.4 billion in the third quarter of 2025 alone. Wiwynn, an original design manufacturer (ODM) for hyperscale cloud providers, reported 2025 revenue of NT$950.66 billion, up 163.7%. Chassis makers ride the same orders: DC Market Insights puts 2025 chassis value at USD 2.88 billion, or 0.79% of server revenue.
Denser Designs Raise Value per Chassis
General-purpose server units grow only about 0.9% a year from 2025 to 2035 in the DC Market Insights model (from 12.36 million to 13.52 million), but value per chassis rises from USD 135 to USD 155 as 2U boxes take more drives, wider air paths and liquid-cooling provisions. Asia Vital Components lifts its chassis capacity from 400,000 to 600,000 units a month, a 50% step that reflects the shift from simple sheet-metal boxes to thermal-integrated enclosures.
Market Trends: How Is Server Chassis Design Changing?
Liquid-cooled chassis are the main trend, rising from USD 356.00 million in 2025 to USD 3.81 billion in 2035 at 26.76% a year.
Liquid-Cooled Chassis Reach 58.4% of Value by 2035
Accelerators above 1,000 W each cannot be cooled by air alone, so chassis now ship with cold-plate brackets, quick-disconnect mounts and drip trays. Chenbro’s 4U MGX liquid-cooled chassis supports up to 16 liquid-cooled single-slot GPUs. DC Market Insights estimates that 35% of GPU chassis value was liquid-cooled in 2025, rising to 75% in 2030 and 85% in 2035.
Modular MGX Designs Move Chassis Makers to Rack Level
The NVIDIA MGX specification, published in May 2023, gives server makers a modular reference architecture so that one chassis can host many processor and GPU combinations. In May 2026 Chenbro extended its support from standalone chassis to NVIDIA MGX Rack level, so chassis makers now supply tray enclosures, manifolds and rack frames as one package. DC Market Insights counts the tray enclosures in this market (about USD 1,500 per node in 2025) and leaves the rack frame to rack reports.
Production Moves Closer to US Buyers
Server and chassis production is moving to Texas, Mexico and Southeast Asia. Chenbro opened a US new product introduction (NPI) and prototyping site in the fourth quarter of 2025 and is buying land in Texas for mass production, and AVC has invested USD 600 million in Vietnam plants V1 to V8. North America takes 45.0% of 2025 chassis demand, or USD 1.29 billion.
Market Challenges: What Holds the Server Chassis Market Back?
Steel tariffs and flat general-purpose unit volumes are the two main constraints, with general-purpose chassis growing only 2.31% a year.
Steel and Aluminium Tariffs Raise Chassis Costs
Chassis are mostly cold-rolled and galvanised steel. The US raised the Section 232 tariff on steel and aluminium imports from 25% to 50% on 4 June 2025, the Bureau of Industry and Security (BIS) added 407 derivative product categories in August 2025, and from April 2026 articles made entirely or almost entirely of steel, aluminium or copper pay a flat 50%. A USD 135 chassis with about USD 40 of steel faces up to USD 20 of extra duty if shipped alone into the US, so makers ship chassis inside finished servers or build them in the US. DC Market Insights includes this in the rise of general-purpose chassis prices from USD 130 in 2024 to USD 135 in 2025.
General-Purpose Units Flatten at 13.5 Million a Year
Each new general-purpose server replaces 1.5 to 2 older ones because core counts per processor keep rising. In the DC Market Insights model, general-purpose and storage server units grow from 12.36 million in 2025 to only 13.52 million in 2035, so rack-mount general-purpose chassis fall from 43.9% of value to 24.3%.
Market Opportunities: Where Are the New Revenue Pools?
Liquid-cooled GPU chassis and US-built enclosures are the two largest new revenue pools, worth USD 3.81 billion and about USD 2.81 billion of regional demand by 2035.
Liquid-Cooled Chassis Add USD 3.46 billion by 2035
Liquid-cooled chassis grow from USD 356.00 million in 2025 to USD 3.81 billion in 2035. Suppliers that combine sheet metal with cold-plate and manifold know-how, such as AVC, whose 2025 revenue rose 94.59% to NT$139.64 billion, can sell a thermal-integrated chassis at two to three times the price of an air-cooled one.
US Assembly Lifts North American Chassis Demand to USD 2.81 billion by 2035
Wiwynn opened its Texas plant in September 2026 with production and testing for both air-cooled and liquid-cooled racks, and Foxconn agreed with OpenAI in November 2025 to co-design multiple generations of AI data center racks in the US. North American chassis demand grows from USD 1.29 billion in 2025 to USD 2.81 billion in 2035, and chassis made near these plants avoid the 50% metal tariff.
Pricing: How Much Does a Server Chassis Cost?
A general-purpose 1U or 2U server chassis cost about USD 135 at ODM prices in 2025, a storage or JBOD enclosure about USD 340 and a GPU or accelerator chassis about USD 1,500, according to DC Market Insights estimates.
| Chassis type (USD per unit) | 2020 | 2025 | 2030 | 2035 |
|---|---|---|---|---|
| General-purpose rack-mount and multi-node | 110 | 135 | 145 | 155 |
| Storage server and JBOD | 300 | 340 | 370 | 395 |
| GPU and accelerator | 900 | 1,500 | 2,000 | 2,300 |
GPU chassis prices rise faster than general-purpose prices because accelerator nodes grow from 9 kW in 2025 to about 25 kW in 2035 in the DC Market Insights model, and each kilowatt needs heavier steel, more airflow or liquid-cooling hardware. Per kilowatt of IT capacity, however, GPU chassis cost falls from about USD 167 in 2025 to USD 92 in 2035.
Public price anchors. Supermicro’s purchases from Ablecom and Compuware, its chassis and power supply partners, were 3.3% of its cost of sales in fiscal 2025, a ceiling for chassis plus power supplies together. DC Market Insights puts 2025 chassis value alone at 0.79% of IDC’s USD 366.0 billion server revenue forecast, below that 3.3% ceiling as expected for a part bought at ODM prices.
Standards and Regulation: Which Rules Shape Server Chassis?
Four standards and two trade rules shape a USD 2.88 billion market: rack dimensions, open hardware designs, product safety, hazardous-substance limits and US metal tariffs.
- IEC 60297-3-100 and EIA-310-E. The International Electrotechnical Commission (IEC) standard specifies the basic dimensions of front panels, subracks, chassis, racks and cabinets for 19-inch equipment, and EIA-310-E sets design requirements for cabinets, racks and panels; together they fix the 1U height of 44.45 mm.
- OCP Open Rack v3. The Open Compute Project Rack and Power project covers 19-inch EIA compatible and 21-inch Open Rack designs used by hyperscale cloud providers.
- NVIDIA MGX. The MGX server specification (May 2023) sets the modular mechanical layout used by most new GPU chassis.
- IEC 62368-1:2023. The hazard-based product safety standard for information and communication technology (ICT) equipment governs enclosure openings, sharp edges and fire enclosures.
- EU RoHS Directive 2011/65/EU. The Restriction of Hazardous Substances (RoHS) directive limits lead, cadmium and hexavalent chromium in coatings and fasteners on chassis sold in the European Union.
- US Section 232 tariffs. The April 2026 flat 50% rate on articles made almost entirely of steel or aluminium applies to chassis imported on their own.
Market Segmentation: Which Segment Leads the Server Chassis Market?
Rack-mount general-purpose server chassis lead with 43.9% of 2025 value (USD 1.26 billion), but GPU and accelerator server chassis take the lead in 2027 and reach 62.0% of value in 2035.
By Chassis Type: Rack-Mount General-Purpose Server Chassis Lead with 43.9%
About 10.88 million general-purpose compute servers shipped in 2025 in the DC Market Insights model, against about 603 thousand accelerator nodes; NVIDIA held over 90% of server GPU shipments in late 2024, so most GPU chassis follow its HGX and MGX layouts.
| Chassis type | 2025 (USD million) | Share 2025 | 2035 (USD million) | CAGR 2025-2035 |
|---|---|---|---|---|
| Rack-Mount General-Purpose Server Chassis | 1,262.72 | 43.9% | 1,586.20 | 2.31% |
| GPU and Accelerator Server Chassis | 904.42 | 31.4% | 4,048.91 | 16.17% |
| Storage Server and JBOD Enclosures | 504.26 | 17.5% | 640.95 | 2.43% |
| Multi-Node and Blade Server Chassis | 205.56 | 7.1% | 258.22 | 2.31% |
| Total | 2,876.95 | 100.0% | 6,534.28 | 8.55% |
By Cooling Design: Air-Cooled Chassis Lead with 87.6%
Air-cooled chassis hold USD 2.52 billion of 2025 value, but liquid-cooled chassis pass them by 2033 and hold 58.4% of value in 2035.
| Cooling design | 2025 (USD million) | Share 2025 | 2035 (USD million) | CAGR 2025-2035 |
|---|---|---|---|---|
| Air-Cooled Chassis | 2,520.96 | 87.6% | 2,719.90 | 0.76% |
| Liquid-Cooled Chassis | 356.00 | 12.4% | 3,814.38 | 26.76% |
| Total | 2,876.95 | 100.0% | 6,534.28 | 8.55% |
By End User: Hyperscale Cloud Providers Lead with 52.0%
Hyperscale cloud providers buy USD 1.50 billion of chassis in 2025 through their ODMs, and GPU cloud and AI specialists grow fastest at 13.04% a year.
| End user | 2025 (USD million) | Share 2025 | 2035 (USD million) | CAGR 2025-2035 |
|---|---|---|---|---|
| Hyperscale Cloud Providers | 1,496.02 | 52.0% | 3,593.85 | 9.16% |
| Enterprise and Government | 891.86 | 31.0% | 1,502.88 | 5.36% |
| GPU Cloud and AI Specialists | 287.70 | 10.0% | 980.14 | 13.04% |
| Telecom and Edge Operators | 201.39 | 7.0% | 457.40 | 8.55% |
| Total | 2,876.95 | 100.0% | 6,534.28 | 8.55% |
DC Exclusive: The Server Chassis Units × Price Model and Chassis Type × End User Matrix
This DC Market Insights model splits the USD 2.88 billion of 2025 across 4 chassis types and 4 end users, built from 19 inputs including capacity cohorts, kilowatts per server, refresh cycles and price per chassis.
GPU cloud and AI specialists spend 76.9% of their chassis budget on GPU chassis, while enterprise and government buyers spend most on rack-mount general-purpose chassis. The cross-tab below (USD million, 2025) shows where each chassis type is sold.
| Chassis type | Hyperscale Cloud Providers | GPU Cloud and AI Specialists | Enterprise and Government | Telecom and Edge Operators | Total |
|---|---|---|---|---|---|
| Rack-Mount General-Purpose Server Chassis | 582.77 | 38.44 | 508.80 | 132.71 | 1,262.72 |
| Multi-Node and Blade Server Chassis | 118.06 | 6.49 | 66.07 | 14.94 | 205.56 |
| Storage Server and JBOD Enclosures | 291.84 | 21.39 | 163.33 | 27.69 | 504.25 |
| GPU and Accelerator Server Chassis | 503.34 | 221.37 | 153.65 | 26.05 | 904.41 |
| Total | 1,496.01 | 287.69 | 891.85 | 201.39 | 2,876.95 |
Hyperscale cloud providers buy USD 503.34 million of GPU chassis in 2025, 55.7% of the GPU chassis total.
Regional Insights: Which Region Leads the Server Chassis Market?
North America leads with 45.0% of 2025 value (USD 1.29 billion), and the Middle East and Africa grows fastest at 14.24% a year.
North America Leads with 45.0% Share
North America grows from USD 1.29 billion in 2025 to USD 2.81 billion by 2035 at 8.06% a year. CBRE counted 7,481 MW under construction in North American primary markets in the first half of 2026, and Amazon and Wiwynn plan nearly 1,000 new manufacturing jobs in Texas by the end of 2027.
Asia Pacific Holds 33.0% Share
Asia Pacific grows from USD 949.39 million in 2025 to USD 2.22 billion by 2035 at 8.87% a year. China takes USD 455.71 million of the region’s 2025 value, and India grows fastest after its data center capacity rose from about 375 MW in 2020 to around 1,500 MW by 2025. Singapore’s regulator plans at least 300 MW of additional capacity in the near term.
Europe Holds 15.0% Share
Europe grows from USD 431.54 million in 2025 to USD 882.13 million by 2035 at 7.41% a year. Germany (USD 99.25 million) and the United Kingdom (USD 90.62 million) are the largest European markets in 2025; Europe’s share slips from 15.0% to 13.5% by 2035 as power limits slow builds in Frankfurt, London, Amsterdam, Paris and Dublin.
Middle East and Africa Holds 3.6% Share
Middle East and Africa grows from USD 103.57 million in 2025 to USD 392.06 million by 2035 at 14.24% a year. Saudi Arabia’s HUMAIN targets 1.9 GW of data center capacity by 2030 and 6.6 GW by 2034, mostly AI capacity that needs GPU chassis; Saudi Arabia grows 16.34% a year and the UAE 14.98%.
Latin America Holds 3.4% Share
Latin America grows from USD 97.82 million in 2025 to USD 228.70 million by 2035 at 8.86% a year. Brazil (USD 53.80 million) and Mexico (USD 29.34 million) are the largest markets in 2025, and Mexico grows faster at 10.24% a year as server assembly near the US border adds local demand.
Country Analysis: Which Countries Spend the Most on Server Chassis?
The United States is the largest country market at USD 1.17 billion in 2025, 40.5% of global value, and India is the fastest-growing large country at 13.79% a year.
| Rank | Country | Region | 2025 (USD million) | 2035 (USD million) | CAGR 2025-2035 |
|---|---|---|---|---|---|
| 1 | United States | North America | 1,165.17 | 2,500.67 | 7.94% |
| 2 | China | Asia Pacific | 455.71 | 933.09 | 7.43% |
| 3 | Japan | Asia Pacific | 132.92 | 288.82 | 8.07% |
| 4 | Canada | North America | 129.46 | 309.07 | 9.09% |
| 5 | Germany | Europe | 99.25 | 194.07 | 6.94% |
| 6 | United Kingdom | Europe | 90.62 | 176.43 | 6.89% |
| 7 | India | Asia Pacific | 85.45 | 311.03 | 13.79% |
| 8 | Australia | Asia Pacific | 66.46 | 155.52 | 8.87% |
| 9 | South Korea | Asia Pacific | 56.96 | 144.41 | 9.75% |
| 10 | France | Europe | 56.10 | 114.68 | 7.41% |
| 11 | Brazil | Latin America | 53.80 | 114.35 | 7.83% |
| 12 | Singapore | Asia Pacific | 47.47 | 99.97 | 7.73% |
India grows from USD 85.45 million in 2025 to USD 311.03 million in 2035, and Malaysia, just outside the top 12 at USD 37.98 million, grows 13.38% a year on the Johor data center cluster.
Forecast Scenarios: How Could the 2035 Forecast Change?
The Server Chassis Market reaches USD 6.53 billion in 2035 in the base case, within a range of USD 5.14 billion to USD 7.76 billion.
| Scenario | 2035 size | CAGR 2025-2035 | Assumptions |
|---|---|---|---|
| Low | USD 5.14 billion | 5.97% | New capacity 15% below base from 2027, GPU chassis prices 10% lower, accelerator nodes 10% denser |
| Base | USD 6.53 billion | 8.55% | 27 GW of new capacity in 2035, 66% AI share, GPU chassis USD 2,300 |
| High | USD 7.76 billion | 10.43% | New capacity 12% above base from 2027, GPU chassis prices 8% higher, nodes 5% less dense |
The spread of USD 2.62 billion in 2035 comes mostly from GPU chassis, which make up 62.0% of base-case value in 2035.
Competitive Insights: Who Leads the Server Chassis Market?
The five largest chassis suppliers hold about 65% of 2025 value (DC Market Insights estimate, based on Chenbro revenue, AVC chassis capacity and Supermicro’s disclosed chassis sourcing), led by Chenbro Micom with about 25%.
- Chenbro Micom
- Asia Vital Components (AVC)
- Ablecom Technology
- Super Micro Computer (Supermicro)
- Hon Hai Precision Industry (Foxconn)
- Wiwynn
- Quanta Cloud Technology
- Inventec
- Wistron
- AIC Inc.
- Giga Computing (GIGABYTE)
- Celestica
- Jabil
- Compucase Enterprise
Chenbro Micom reported 2025 revenue of NT$22.0 billion, up 51.55%, about USD 709.71 million at NT$31 per US dollar (DC Market Insights conversion); chassis were 99% of its fourth-quarter 2025 revenue, and over 60% of revenue came from large data center end customers. AVC runs 400,000 chassis a month, rising to 600,000, about 4.8 million units a year. Ablecom coordinates the manufacturing of chassis for Supermicro, which reported fiscal 2025 net sales of USD 22.0 billion. Hon Hai said its cloud and networking revenue surpassed consumer electronics for the first time in the fourth quarter of 2025, and Inventec said AI server orders lifted server revenue in 2025; both make chassis in-house for their own servers. AIC builds enterprise server and AI storage systems including JBOD enclosures, while Celestica (USD 12.39 billion of 2025 revenue) and Jabil (USD 29.8 billion in fiscal 2025) build hyperscale servers and storage with their own and bought-in enclosures.
Recent Developments
Six dated events since mid-2025 show the Server Chassis Market moving toward liquid-cooled, rack-level and US-built designs.
- In June 2025, the US raised the Section 232 tariff on steel and aluminium imports from 25% to 50% (Source: The White House).
- In October 2025, Chenbro announced its US NPI site for the fourth quarter of 2025 and a planned Texas mass-production site (Source: Chenbro).
- In November 2025, Foxconn and OpenAI agreed to co-design and build AI data center racks in the US (Source: Hon Hai).
- In April 2026, the US moved to a flat 50% tariff on articles made almost entirely of steel, aluminium or copper (Source: The White House).
- In June 2026, Chenbro showed an NVIDIA Vera Rubin server chassis based on MGX at COMPUTEX (Source: Chenbro).
- In September 2026, Wiwynn opened its Texas plant for air-cooled and liquid-cooled racks (Source: Wiwynn).
More data center hardware reports are listed on the industry page; see also the Data Center Server Market and the AI Server Market.
Methodology: How We Built the Server Chassis Market Model
DC Market Insights built the USD 2.88 billion 2025 value bottom-up from 16 annual capacity cohorts and 19 model inputs.
Server units equal the IT megawatts that need servers divided by kilowatts of capacity per server. General-purpose demand is new conventional capacity (7.8 GW in 2025) plus one-sixth of the installed conventional base refreshed each year, at 2.0 kW of capacity per server in 2025, giving 12.36 million general-purpose and storage servers; 12% of them are storage servers and JBOD enclosures. Accelerator demand is new AI capacity (4.2 GW in 2025) plus 22% of the installed AI base refreshed each year, at 9 kW per node, giving about 603 thousand nodes. Value equals units times price per chassis: USD 135 for general-purpose compute (USD 1.47 billion), USD 340 for storage and JBOD (USD 504.26 million) and USD 1,500 for GPU and accelerator chassis (USD 904.42 million). The installed base grows from about 116 GW in 2025 to about 313 GW in 2035, and the AI share of new capacity rises from 35% to 66%. Region, country and segment splits are DC Market Insights allocations that sum to the total every year.
Bound checks. (1) Ceiling: the USD 2.88 billion market is 0.79% of IDC’s USD 366.0 billion 2025 server revenue forecast, below the 3.3% of cost of sales that Supermicro spends on chassis and power supplies together (Supermicro 10-K). (2) Ceiling: the whole market is under 10% of the NT$950.66 billion (about USD 30.7 billion) 2025 revenue of a single ODM, Wiwynn. (3) Floor: Chenbro’s chassis revenue (about USD 702.61 million) plus AVC’s chassis capacity of 4.8 million units at USD 135 (about USD 648.00 million) give about USD 1.35 billion, below our USD 2.88 billion because Foxconn, Ablecom, Inventec, Wistron and other suppliers also make chassis.
The full approach is described on the research methodology page.
Table of contents
- 01Introduction
- 1.1Market Definition
- 1.2Historical Period, Base Year and Forecast Period
- 1.3Report Attributes
- 02Research Methodology
- 2.1Server Units from Annual Capacity Cohorts
- 2.2Value: Units × Price per Chassis
- 2.3Region, Country and Segment Allocation
- 2.4Bound Checks: Server Revenue and ODM Revenue Ceilings, Supplier Floor
- 03Executive Summary
- 3.1Market Snapshot, 2025, 2026 and 2035
- 3.2Key Market Statistics
- 3.3Market Growth, 2020-2035
- 04Market Scope: What Does the Server Chassis Market Cover?
- 4.1Included: Rack-Mount, Multi-Node, Blade, Storage, JBOD and GPU Chassis
- 4.2Excluded: Rack Cabinets, Slide Rails, Power Supplies, Fans, PC Cases and Telecom Chassis
- 4.3How the Segments Fit Together
- 05Why Do Server Chassis Market Estimates Differ?
- 5.1Broader Definitions: PC Cases, Industrial Chassis, Rack Cabinets and Slide Rails
- 5.2Scope Comparison: What Is In and Out
- 5.3SMEs in the Enterprise and Government Segment
- 06Market Drivers: What Drives the Server Chassis Market?
- 6.1AI Capacity Adds USD 3.14 billion of GPU Chassis Demand by 2035
- 6.2Server Spending Reached USD 366.0 Billion in 2025
- 6.3Denser Designs Raise Value per Chassis
- 07Market Trends: How Is Server Chassis Design Changing?
- 7.1Liquid-Cooled Chassis Reach 58.4% of Value by 2035
- 7.2Modular MGX Designs Move Chassis Makers to Rack Level
- 7.3Production Moves Closer to US Buyers
- 08Market Challenges: What Holds the Server Chassis Market Back?
- 8.1Steel and Aluminium Tariffs Raise Chassis Costs
- 8.2General-Purpose Units Flatten at 13.5 Million a Year
- 09Market Opportunities: Where Are the New Revenue Pools?
- 9.1Liquid-Cooled Chassis Add USD 3.46 billion by 2035
- 9.2US Assembly Lifts North American Chassis Demand to USD 2.81 billion by 2035
- 10Pricing: How Much Does a Server Chassis Cost?
- 10.1Price per Chassis by Type, 2020-2035
- 10.2GPU Chassis Cost per Kilowatt of IT Capacity
- 10.3Public Price Anchors
- 11Standards and Regulation: Which Rules Shape Server Chassis?
- 11.1IEC 60297-3-100 and EIA-310-E
- 11.2OCP Open Rack v3
- 11.3NVIDIA MGX
- 11.4IEC 62368-1:2023
- 11.5EU RoHS Directive 2011/65/EU
- 11.6US Section 232 Tariffs
- 12Server Chassis Market by Chassis Type
- 12.1Rack-Mount General-Purpose Server Chassis
- 12.2GPU and Accelerator Server Chassis
- 12.3Storage Server and JBOD Enclosures
- 12.4Multi-Node and Blade Server Chassis
- 13Server Chassis Market by Cooling Design
- 13.1Air-Cooled Chassis
- 13.2Liquid-Cooled Chassis
- 14Server Chassis Market by End User
- 14.1Hyperscale Cloud Providers
- 14.2Enterprise and Government
- 14.3GPU Cloud and AI Specialists
- 14.4Telecom and Edge Operators
- 15DC Exclusive: The Server Chassis Units × Price Model and Chassis Type × End User Matrix
- 15.1Chassis Type × End User Matrix, 2025
- 15.2GPU Chassis Demand by End User
- 16Regional Insights: Which Region Leads the Server Chassis Market?
- 16.1North America (United States, Canada)
- 16.2Asia Pacific (China, Japan, India, Australia, South Korea, Singapore)
- 16.3Europe (Germany, United Kingdom, France)
- 16.4Middle East and Africa (Saudi Arabia, United Arab Emirates)
- 16.5Latin America (Brazil, Mexico)
- 17Country Analysis: Which Countries Spend the Most on Server Chassis?
- 17.1United States
- 17.2China
- 17.3Japan
- 17.4Canada
- 17.5Germany
- 17.6United Kingdom
- 17.7India
- 17.8Australia
- 17.9South Korea
- 17.10France
- 17.11Brazil
- 17.12Singapore
- 18Forecast Scenarios: How Could the 2035 Forecast Change?
- 18.1Low Scenario
- 18.2Base Scenario
- 18.3High Scenario
- 19Competitive Insights: Who Leads the Server Chassis Market?
- 19.1Market Concentration: Top Five Suppliers
- 20Recent Developments
- 20.1US Steel, Aluminium and Copper Tariffs, 2025-2026
- 20.2US Production Sites: Chenbro and Wiwynn
- 20.3AI Rack Partnerships and MGX Chassis Launches
- 21Company Profiles
- 21.1Chenbro Micom
- 21.2Asia Vital Components (AVC)
- 21.3Ablecom Technology
- 21.4Super Micro Computer (Supermicro)
- 21.5Hon Hai Precision Industry (Foxconn)
- 21.6Wiwynn
- 21.7Quanta Cloud Technology
- 21.8Inventec
- 21.9Wistron
- 21.10AIC Inc.
- 21.11Giga Computing (GIGABYTE)
- 21.12Celestica
- 21.13Jabil
- 21.14Compucase Enterprise
- Fig. 1Server Chassis Market Size, 2020-2035
- Table 1Report Attributes
- Table 2Scope Comparison
- Table 3Price per Chassis, 2020-2035
- Table 4Market by Chassis Type
- Table 5Market by Cooling Design
- Table 6Market by End User
- Table 7Chassis Type × End User Matrix, 2025
- Table 8Top 12 Countries
- Table 9Forecast Scenarios
About this report
Written by Amit Jain and reviewed by Deepti Agrawal, Senior Editor, Research. Figures are built top-down and bottom-up and reconciled before publication, with 2025 as the base year.
Read our methodologyHow we built this
- Historical period2020-2024
- Base year2025
- Forecast period2026-2035
- Sizing approachTop-down + bottom-up
Need more than the report?
Advisory on this market
Due diligence, site selection and market entry work, by the analysts who wrote this report.
See consulting servicesFrequently asked questions
USD 3.28 billion in 2026, up 13.9% from USD 2.88 billion in 2025, according to DC Market Insights estimates. The market is projected to reach USD 6.53 billion by 2035.
8.55% a year from 2025 to 2035, after 14.68% a year between 2020 and 2025, when annual data center completions rose to 12.0 GW and AI servers took a growing share.
A server chassis is the metal enclosure, worth USD 2.88 billion across data centers in 2025, that holds a server’s boards, drives, fans and power supplies in a 1U, 2U, 4U, multi-node, storage or GPU format and mounts in a 19-inch or 21-inch rack.
43.9% of 2025 value, or USD 1.26 billion, goes to rack-mount general-purpose server chassis. GPU and accelerator server chassis grow fastest at 16.17% a year and lead from 2027, reaching USD 4.05 billion by 2035.
About USD 135 for a general-purpose 1U or 2U chassis, USD 340 for a storage or JBOD enclosure and USD 1,500 for a GPU or accelerator chassis at ODM prices in 2025, according to DC Market Insights estimates.
45.0% of 2025 value, or USD 1.29 billion, is spent in North America. The Middle East and Africa grows fastest at 14.24% a year, and India is the fastest large country at 13.79%.
About 65% of 2025 value is held by the five largest suppliers (DC Market Insights estimate), led by Chenbro Micom with about 25%, then Asia Vital Components, Ablecom Technology, Foxconn and Wiwynn. Inventec, Wistron, AIC, Giga Computing, Celestica, Jabil and Compucase also compete.
USD 356.00 million in 2025, rising to USD 3.81 billion by 2035 at 26.76% a year, as GPUs above 1,000 W push chassis toward cold-plate brackets and in-chassis manifolds.
USD 3.28 billion in 2026 is the DC Market Insights figure for data center server enclosures only. Estimates that add desktop PC cases, industrial chassis, rack cabinets or slide rails come out two to four times larger.
A flat 50% Section 232 tariff applies from April 2026 to articles made almost entirely of steel or aluminium, so a USD 135 chassis shipped alone can carry up to USD 20 of extra duty; makers respond by building chassis in Texas and Mexico.
Licences, delivery and payment
Which licence should I choose?
Single User is a view-only PDF for one person. Multi User adds a printable PDF and the Excel data for unlimited users at one location. Enterprise covers your whole company and includes 100 free analyst hours.
How and when will I receive the report?
By email, within 24–48 business hours of payment, in the formats of your licence.
How can I pay?
Securely through PayPal: with a PayPal account, a debit or credit card, or PayPal Pay Later where available. Prices are in US dollars.
Can I see a sample first?
Yes. Request a free sample and we will email it to you.
Can the report be tailored to my needs?
Yes. We can add countries, segments or data cuts. Talk to an analyst about the scope you need.
Can I get an invoice or pay against a purchase order?
Write to sales@dcmarketinsights.com and our team will help.