
AI Server BBU Market Size, Share & Forecast to 2035
Market at a glance
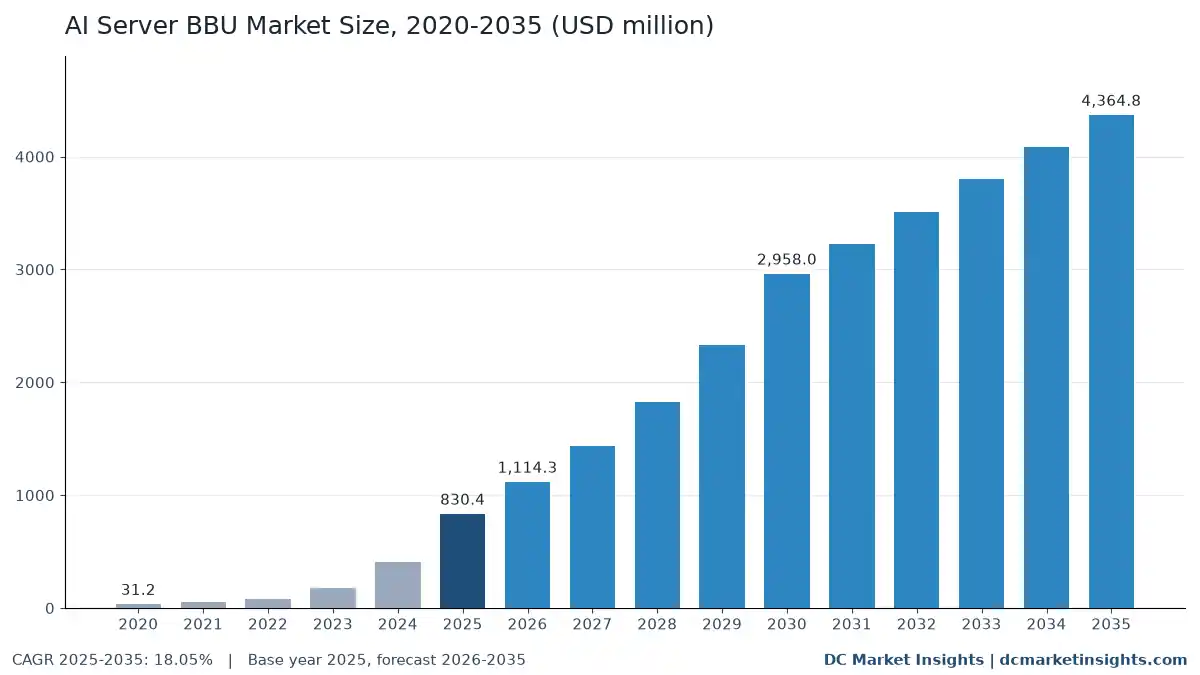
The AI Server BBU market was worth USD 830.4 million in 2025 and is forecast to reach USD 4,360.0 million by 2035, growing at a 18.05% CAGR.
 By Amit Jain, Senior Consultant, ICT & Emerging Technologies
 Reviewed by Deepti Agrawal
Last updated 22 Oct 2026
Base year 2025 PDF + Excel
Key findings
Meta's 140 kW Catalina Rack Ships with an ORv3 Battery Backup Unit
Backup Time Falls from 240 Seconds to 45-90 Seconds
800 V DC Rack and Sidecar BBU: USD 1.27 billion by 2035
What is inside the report
- 01Introduction
- 02Executive Summary
- 03Market Scope
- 04Why Market Estimates Differ
- 05Market Drivers
- 06Market Trends
- 07Market Challenges and Restraints
- 08Market Opportunities
- 09Pricing Analysis
- 10Standards and Regulation
- 19chapters
- 2020-2024Historical period
- 2026-2035Forecast period
- —Companies profiled
Segmentation
Full analysis
The AI Server BBU Market is valued at USD 1.11 billion in 2026 and is projected to reach USD 4.36 billion by 2035, up from USD 830.40 million in 2025, a CAGR of 18.05% from 2025 to 2035 (DC Market Insights estimate). The money in this market follows one design choice: whether a hyperscaler puts lithium-ion battery backup units (BBUs) inside the AI rack instead of relying on a room-level uninterruptible power supply (UPS). Meta made that choice for its Catalina rack, a 140 kilowatt (kW) Open Rack V3 (ORv3) high-power rack that lists a battery backup unit among its parts (Meta Engineering, October 2024). Advanced Energy Solution Holding (AES-KY), a Taiwanese maker of these modules, grew 2025 revenue 59.4% to NT$16.00 billion, and one unnamed customer went from 4% to 37% of its sales (AES-KY audited 2025 financial statements, March 2026). DC Market Insights builds the 2025 figure from 4.20 gigawatts (GW) of new AI rack capacity, 48% of it shipped with in-rack BBUs, at USD 400 per kW of rack load backed. 800 V direct current (DC) rack and sidecar BBUs grow from zero to USD 1.27 billion by 2035, and the Middle East and Africa is the fastest region at 21.98% a year as Saudi Arabia and the United Arab Emirates (UAE) fill new AI campuses.
Key Market Statistics: How Big Is the AI Server BBU Market in 2026?
DC Market Insights values the AI Server BBU Market at USD 1.11 billion in 2026, 34.19% above 2025, because new AI rack capacity with in-rack backup rises from 2.02 GW to 2.84 GW in one year.
- Market size 2025: USD 830.40 million; 2026: USD 1.11 billion; 2030: USD 2.96 billion; 2035: USD 4.36 billion.
- CAGR 2025-2035: 18.05% in the base case; the 2035 range runs from USD 3.23 billion (low, 14.55%) to USD 5.41 billion (high, 20.62%).
- Price: about USD 400 per kW of rack load backed in 2025, falling to USD 215 by 2035 as backup time shortens (DC Market Insights estimate).
- Largest cell chemistry: high-rate nickel manganese cobalt (NMC) and nickel cobalt aluminium (NCA) lithium-ion cells, USD 697.54 million or 84.0% of 2025 value.
- Fastest chemistry: sodium-ion and lithium titanate cells, 41.22% a year; lithium iron phosphate (LFP) reaches USD 1.18 billion by 2035.
- 800 V DC rack and sidecar BBUs: zero in 2025, USD 1.27 billion by 2035, 29.0% of the market.
- BBU module replacement grows from USD 24.00 million in 2025 to USD 1.76 billion by 2035 as the first large AI fleets reach their battery refresh.
- Leading region: North America, USD 493.26 million (59.4%) in 2025; fastest region: Middle East and Africa, 21.98% a year.
- Largest country: United States, USD 455.06 million in 2025; fastest large country: India, 25.80% a year.
- Market leaders: AES-KY, Lite-On Technology and Delta Electronics hold about 70% of 2025 value together (DC Market Insights estimate).
Executive Summary: How Fast Is Spending on AI Server Battery Backup Units Growing?
The Global AI Server BBU Market size was valued at USD 31.20 million in 2020, reached USD 830.40 million in 2025, and is anticipated to reach USD 4.36 billion by 2035, at a CAGR of 18.05% during the forecast period.
| Attribute | Value |
|---|---|
| Historical period | 2020-2024 |
| Base year | 2025 |
| Forecast period | 2026-2035 |
| Market size 2025 | USD 830.40 million |
| Market size 2026 | USD 1.11 billion |
| CAGR 2025-2035 | 18.05% |
| Market size 2035 | USD 4.36 billion |
Spending grew 92.76% a year from 2020 to 2025 from a small base: new AI rack capacity rose from 0.30 GW to 4.20 GW, and the share shipped with in-rack batteries rose from 20% to 48% as ORv3 racks spread beyond Meta. Growth slows to 18.05% a year to 2035 for two reasons in the DC Market Insights model: the price per kW falls from USD 400 to USD 215 because designs move from 240 seconds of backup to 45-90 seconds, and capacitor shelves take over the sub-second smoothing job. Replacement keeps the curve rising after 2030, when racks installed in 2025-2030 need new modules.
What Is an AI Server BBU and What Does the Market Include?
AI server BBUs were a USD 830.40 million market in 2025, counting only battery backup sold into racks that hold AI accelerators.
The AI server BBU market covers rack-level battery backup units: battery modules, the shelves and chargers that hold them, and their battery management electronics, bought for racks with graphics processing units (GPUs) or custom AI accelerators, valued at the BBU maker’s selling price.
Included: ORv3 48 V to 54 V BBU modules and shelves; higher-power 50 V shelves such as 33 kW designs; 800 V DC BBU shelves in power racks and sidecars; capacitor backup units sold in BBU slots; replacement modules for installed AI racks.
Excluded: room-level UPS batteries and battery cabinets, covered in the Data Center Battery Market; campus battery energy storage systems (BESS), flywheels and grid-scale storage, covered in the Data Center Energy Storage Market; power supply units and power shelves; BBUs in racks of general-purpose servers without accelerators.
How the segments fit together: every dollar sits once in each dimension: cell chemistry, rack power architecture, deployment (new racks or replacement) and end user. Regions and countries follow where the AI racks are installed, using the same deployment shares as the DC Market Insights accelerator model.
Why Do AI Server BBU Market Estimates Differ?
AI server BBU estimates differ by boundary; DC Market Insights puts the market at USD 1.11 billion in 2026.
Broader definitions add BBUs in every Open Rack, including storage and general compute racks, the lithium-ion cells sold to BBU makers counted a second time, UPS battery cabinets in AI halls, or campus battery energy storage, and they come out several times larger. DC Market Insights counts one sale per BBU, at the module and shelf level, only where the rack holds AI accelerators; the cell value is inside that price. All rack BBU spending in data centers, AI and non-AI, was about USD 2.33 billion in 2025 in the DC Market Insights Data Center Battery Market model, so AI racks were about 36% of rack BBU spending. Buyers in scope range from hyperscale cloud providers to GPU cloud providers, colocation tenants and enterprises with small AI clusters.
| Element | In this estimate | Why |
|---|---|---|
| BBU modules and shelves in AI racks (48 V to 54 V) | Yes, USD 830.40 million in 2025 | Core product of the market |
| 800 V DC rack and sidecar BBU | Yes, USD 1.27 billion by 2035 | Same backup role in the next power design |
| Capacitor backup units in BBU slots | Yes, USD 24.91 million in 2025 | Bought instead of a BBU for short holdup |
| BBUs in non-AI server racks | No | No AI accelerator in the rack |
| Room UPS batteries and campus BESS | No | Facility storage, covered in separate reports |
| Cells sold to BBU makers | No (inside module price) | Counting them again would double count |
Market Drivers: Why Are Hyperscalers Putting Batteries Inside AI Racks?
AI server BBU spending rises 34.19% in 2026 because three forces push batteries into the rack at once.
Meta’s 140 kW Catalina Rack Ships with an ORv3 Battery Backup Unit
Meta’s Catalina design for NVIDIA GB200 systems uses the ORv3 high-power rack at up to 140 kW and lists a battery backup unit as part of the rack, according to Meta Engineering (October 2024). An ORv3 BBU module delivers 3 kW for 4 minutes, and a shelf of six modules runs 15 kW for more than 240 seconds with one spare module, according to the Open Rack V3 specifications written by Meta and Delta Electronics (OCP Open Rack V3 48V BBU Module Rev 1.4, September 2023). At 120 kW per NVL72-class rack, that is eight shelves and about USD 48,000 of BBU per rack at the 2025 price in the DC Market Insights model.
AES-KY Sales Up 59.4% as One Customer Reaches 37% of Revenue
AES-KY reported 2025 revenue of NT$16.00 billion, against NT$10.04 billion in 2024, with lithium-ion battery modules at 99.7% of sales; its largest customer rose from NT$408.03 million (4%) to NT$6.00 billion (37%), and Asia revenue nearly tripled to NT$9.26 billion, according to AES-KY’s audited 2025 statements (March 2026). The company names data centers as the main source of growth in backup power demand in its 2024 annual report. Monthly filings show January to September 2026 revenue of NT$14.57 billion, up 26.27% on 2025.
Alphabet, Amazon and Meta Plan USD 130-205 Billion Each of 2026 Capital Spending
Alphabet raised its 2026 capital expenditure guide to USD 195-205 billion in July 2026, Amazon plans about USD 200 billion and Meta guides USD 130-145 billion, against USD 91.4 billion, USD 131.8 billion and USD 72.2 billion in 2025, according to the companies’ earnings releases. NVIDIA reported data center revenue of USD 89.0 billion in the quarter to July 2026, up 117%, on the Blackwell Ultra ramp (NVIDIA filing, August 2026). DC Market Insights ties BBU demand to the 5.60 GW of AI capacity commissioned in 2026, not to chip revenue directly.
Market Trends: How Is AI Rack Battery Backup Design Changing?
Three design shifts move AI server BBU value, with 800 V products reaching USD 1.27 billion by 2035.
Backup Time Falls from 240 Seconds to 45-90 Seconds
The 2022 ORv3 shelf specification asked for more than 240 seconds at 15 kW; the Mt. Diablo disaggregated power rack specification from Microsoft, Meta and Google, published by the Open Compute Project (OCP) on 8 October 2026, asks for 45 to 90 seconds at full load when a BBU is used. Lite-On Technology’s newest 50 V shelf holds 12 kW for 45 seconds. Shorter holdup cuts energy per kW by a factor of three to five, which is why DC Market Insights lowers the price from USD 400 to USD 290 per kW by 2030.
800 V BBU Shelves from Lite-On, Delta and Flex
Lite-On shows a 22 kW 3U shelf at 800 V with 60 seconds of full-power backup (Lite-On analyst meeting, July 2026); Delta Electronics showed 800 V in-row power racks of 660 kW carrying 480 kW of BBU at NVIDIA GTC in March 2026; Flex offers BBUs and capacitor backup units as options on its 800 VDC power rack for NVIDIA Vera Rubin (Flex, March 2026). DC Market Insights models 800 V rack and sidecar BBUs at 29.0% of 2035 value.
Capacitors Take the Sub-Second Job: 65 J per GPU in GB300 Power Shelves
NVIDIA filled part of the GB300 NVL72 power supply volume with 65 joules of capacitor storage per GPU, built with Lite-On, cutting peak grid demand by 30% (NVIDIA technical blog, July 2025), and its 800 VDC white paper puts capacitors below 100 milliseconds and batteries beyond about 10 seconds. Capacitor backup units in BBU slots grow from USD 24.91 million in 2025 to USD 305.54 million by 2035 in the DC Market Insights model.
Market Challenges and Restraints: What Holds Back AI Server BBU Spending?
Two restraints cap AI server BBU growth at 18.05% a year, well below the 92.76% of 2020-2025.
25% Section 301 Duty on Chinese Non-EV Lithium-Ion Batteries from 2026
The Office of the United States Trade Representative (USTR) raised the Section 301 tariff on Chinese lithium-ion non-electric-vehicle batteries (tariff line 8507.60.0020) to 25% in 2026 (Federal Register 89 FR 76581, September 2024), and opened a second four-year review in May 2026. In the United States, a USD 455.06 million market in 2025, Chinese-made modules lose their price advantage, so BBU lines sit in Taiwan, Thailand, Mexico and the United States; Lite-On said in July 2026 that its BBU lines run at full capacity (Lite-On second-quarter 2026 call, July 2026).
Room UPS Still Wins Half of AI Racks: In-Rack Attach at 48% in 2025
NVIDIA’s own GB200 NVL72 user guide describes a 120 kW rack with eight power shelves and no BBU, and NVIDIA’s 800 VDC white paper calls backup an optional role for rack storage. DC Market Insights puts the share of new AI rack kW shipped with in-rack BBUs at 48% in 2025, rising only to 68% by 2035, because colocation operators keep central UPS and battery rooms. Fire codes add cost: UL 9540A, the battery fire test method, moved to a sixth edition in March 2026, effective 1 January 2027.
Market Opportunities: Where Will New AI Server BBU Revenue Come From?
Two pools add USD 3.03 billion of 2035 value that barely existed in 2025.
800 V DC Rack and Sidecar BBU: USD 1.27 billion by 2035
Racks above 200 kW cannot stay on 54 V busbars, NVIDIA says, and 800 V power racks such as Mt. Diablo hold BBUs at 800 kW to 1.1 MW per power rack. DC Market Insights expects 800 V products to start in 2027 and reach USD 1.27 billion by 2035; a 1.1 MW power rack at 90 seconds needs about 27.5 kilowatt-hours (kWh) of delivered energy.
BBU Module Replacement: USD 1.76 billion by 2035
The ORv3 module specification sets an eight-year life, and Delta rates its shelf for 240 seconds after six years; AI racks are refreshed sooner, so DC Market Insights models a five-year module replacement cycle. Replacement grows from USD 24.00 million in 2025 to USD 1.76 billion by 2035, 53.65% a year, as the 8.18 GW of BBU-backed AI racks added in 2030 reach their refresh.
Pricing Analysis: How Much Does an AI Server BBU Cost per kW?
An AI server BBU cost about USD 400 per kW of rack load backed in 2025, or about USD 48,000 for a 120 kW rack at 240 seconds (DC Market Insights estimate).
| Year | USD per kW backed | Per 3 kW ORv3 module | Per 120 kW AI rack | Typical design backup time |
|---|---|---|---|---|
| 2020 | USD 520 | USD 1,560 | USD 62,400 | 240 s |
| 2025 | USD 400 | USD 1,200 | USD 48,000 | 240 s |
| 2026 | USD 378 | USD 1,134 | USD 45,360 | 180 s |
| 2030 | USD 290 | USD 870 | USD 34,800 | 90 s |
| 2035 | USD 215 | USD 645 | USD 25,800 | 60 s |
Public price anchors are thin because suppliers do not disclose BBU prices. AES-KY’s gross margin of 37.61% in the first half of 2025, from its July 2025 investor presentation, shows a product priced well above its cell cost: an ORv3 module holds 66 cells of the 18650 size in an 11-series, 6-parallel pack, about 22 cells per kW. Lite-On said in April 2026 that whole power racks sell for about USD 100,000-200,000 each, a level above power supply units and BBUs. DC Market Insights keeps the same USD 400 per kW 2025 anchor as its Data Center Battery Market model, so the two estimates reconcile.
Which Specifications, Safety Tests and Battery Laws Apply to AI Server BBUs?
Seven documents shape an AI server BBU sold in 2026, starting with the OCP specifications behind the USD 830.40 million of 48 V to 54 V shelves sold in 2025.
- OCP Open Rack V3 BBU Shelf Rev 1.1 (September 2022) and BBU Module Rev 1.4 (September 2023): 3 kW modules, six per shelf with 5+1 redundancy, 240 seconds at 15 kW, eight-year life; the shelf list requires UL 1973, IEC 62133, IEC 62368-1, UL 9540 and UL 9540A reports.
- OCP Mt. Diablo Disaggregated Power Rack v1.0.0 (October 2026): BBU or capacitor bank storage in the power rack, 45-90 seconds at 100% load.
- UL 9540A sixth edition (March 2026): the cell-to-installation fire propagation test, effective 1 January 2027; NFPA 855, the National Fire Protection Association standard for energy storage, names it as the test method in its 2026 edition.
- IEC 62619:2022: safety of industrial lithium cells and batteries, including UPS use; added to the ORv3 module specification.
- UN 38.3 (UN Manual of Tests and Criteria, Rev. 8, Amendment 1, September 2025): transport tests for each module shipped.
- EU Battery Regulation (EU) 2023/1542: a battery passport from 18 February 2027 for industrial batteries above 2 kWh. A single ORv3 module holds about 0.36 kWh and sits below the line, but 800 V sidecar packs of tens of kWh do not.
- US Section 301 tariffs: 25% on Chinese non-EV lithium-ion batteries from 2026, under review since May 2026.
Market Segmentation: Which AI Server BBU Types Take the Most Spend?
High-rate NMC and NCA lithium-ion BBUs took 84.0% of 2025 spending, USD 697.54 million of USD 830.40 million.
By Cell Chemistry
High-rate cylindrical cells hold the market because a BBU must discharge at 15-20 times its capacity for a few minutes; Molicel says its S Series cells give over 1.5 minutes of backup with a six-year retention period. LFP gains share to 27.0% by 2035 as cell makers move high-power cylindrical lines toward BBU.
| Cell chemistry | 2025 (USD million) | Share 2025 | 2035 (USD million) | CAGR 2025-2035 |
|---|---|---|---|---|
| High-Rate NMC and NCA Lithium-Ion | USD 697.54 million | 84.0% | USD 2,618.90 million | 14.14% |
| Lithium Iron Phosphate | USD 99.65 million | 12.0% | USD 1,178.51 million | 28.02% |
| Sodium-Ion and Lithium Titanate | USD 8.30 million | 1.0% | USD 261.89 million | 41.22% |
| Supercapacitor and Hybrid Capacitor Modules | USD 24.91 million | 3.0% | USD 305.54 million | 28.49% |
By Rack Power Architecture
All 2025 value sat in 48 V to 54 V shelves; 800 V products start in 2027 and reach 29.0% of value by 2035.
| Rack power architecture | 2025 (USD million) | Share 2025 | 2035 (USD million) | CAGR 2025-2035 |
|---|---|---|---|---|
| 48 V to 54 V In-Rack BBU Shelves | USD 830.40 million | 100.0% | USD 3,099.04 million | 14.08% |
| 800 V DC Rack and Sidecar BBU | USD 0.00 million | 0.0% | USD 1,265.80 million | new from 2027 |
By Deployment
New AI rack installations were 97.1% of 2025 value; replacement reaches 40.3% by 2035.
| Deployment | 2025 (USD million) | Share 2025 | 2035 (USD million) | CAGR 2025-2035 |
|---|---|---|---|---|
| New AI Rack Installations | USD 806.40 million | 97.1% | USD 2,605.28 million | 12.44% |
| BBU Module Replacement | USD 24.00 million | 2.9% | USD 1,759.56 million | 53.65% |
By End User
Hyperscale cloud providers bought 68.0% of 2025 value; GPU cloud and neocloud providers grow 21.13% a year as they adopt ORv3-style racks.
| End user | 2025 (USD million) | Share 2025 | 2035 (USD million) | CAGR 2025-2035 |
|---|---|---|---|---|
| Hyperscale Cloud Providers | USD 564.67 million | 68.0% | USD 2,487.96 million | 15.99% |
| GPU Cloud and Neocloud Providers | USD 141.17 million | 17.0% | USD 960.26 million | 21.13% |
| Colocation and Enterprise AI Deployments | USD 83.04 million | 10.0% | USD 611.08 million | 22.09% |
| Sovereign and Research AI Facilities | USD 41.52 million | 5.0% | USD 305.54 million | 22.09% |
DC Exclusive: AI Rack Backup Teardown, from 1 kWh per Shelf to 27.5 kWh per Power Rack
DC Market Insights built this teardown from seven published BBU designs, converting each into energy, cell count and 2025 value: a 120 kW AI rack on ORv3 shelves holds about 8 kWh and USD 48,000 of BBU.
| Design | Backup power | Backup time | Energy delivered | 18650-class cells at 22 per kW | Value at USD 400 per kW |
|---|---|---|---|---|---|
| OCP Open Rack V3 BBU module (Meta spec Rev 1.4, 2023) | 3 kW | 240 s | 0.20 kWh | 66 | USD 1,200 |
| OCP Open Rack V3 BBU shelf, 6 modules, 5+1 (Rev 1.1, 2022) | 15 kW | 240 s | 1.00 kWh | 330 | USD 6,000 |
| Delta 33 kW BBU shelf, 50 V, 6 x 5.5 kW | 33 kW | 90 s | 0.82 kWh | 726 | USD 13,200 |
| Lite-On 12 kW 2U BBU shelf, 50 V | 12 kW | 45 s | 0.15 kWh | 264 | USD 4,800 |
| Lite-On 22 kW 3U BBU shelf, 800 V | 22 kW | 60 s | 0.37 kWh | 484 | USD 8,800 |
| 120 kW NVL72-class rack on ORv3 shelves (8 shelves) | 120 kW | 240 s | 8.00 kWh | 2,640 | USD 48,000 |
| Mt. Diablo power rack, 1.1 MW at 90 s (OCP v1.0.0, 2026) | 1,100 kW | 90 s | 27.50 kWh | 24,200 | USD 440,000 |
The teardown shows why value per kW falls even as racks grow. At 240 seconds a kW of backup needs 0.067 kWh delivered; at 45 seconds it needs 0.0125 kWh. Cell count per kW stays near 22 only because suppliers move to higher-power cells, so cost per kW falls more slowly than energy per kW. Energy and cell columns are DC Market Insights calculations from the published power and time ratings; the value column uses the 2025 model price for every design, including the 800 V power rack.
Regional Insights: Where Are AI Server BBUs Installed?
North America led with USD 493.26 million, 59.4% of 2025 value, and the Middle East and Africa grows fastest at 21.98% a year.
North America
North America grows from USD 493.26 million in 2025 to USD 2.40 billion by 2035, 17.15% a year. Meta, Microsoft and Google wrote the ORv3 and Mt. Diablo specifications, and Amazon alone plans about USD 200 billion of 2026 capital spending.
Asia Pacific
Asia Pacific grows from USD 204.28 million to USD 1.12 billion, 18.52% a year. It is also the supply base: AES-KY’s Asia revenue rose from NT$3.25 billion in 2024 to NT$9.26 billion in 2025, and Panasonic expects data center sales to rise from JPY 322 billion in the year to March 2026 to JPY 550 billion in the year to March 2027 (Panasonic, May 2026).
Europe
Europe grows from USD 76.40 million to USD 436.48 million, 19.04% a year. From 18 February 2027 the EU Battery Regulation adds a QR code to every battery and a passport to packs above 2 kWh.
Middle East and Africa
The Middle East and Africa grows from USD 40.69 million to USD 296.81 million, 21.98% a year, the fastest rate, as Saudi Arabia (22.47%) and the UAE (22.41%) fill new AI campuses.
Latin America
Latin America grows from USD 15.78 million to USD 113.49 million, 21.81% a year, from AI clusters in Brazil, Mexico and Chile.
Which Countries Spend Most on AI Server BBUs?
The United States spent USD 455.06 million on AI server BBUs in 2025, 54.8% of the market; India is the fastest large country at 25.80% a year.
| Rank | Country | Region | 2025 (USD million) | 2035 (USD million) | CAGR 2025-2035 |
|---|---|---|---|---|---|
| 1 | United States | North America | USD 455.06 million | USD 2,199.88 million | 17.07% |
| 2 | China | Asia Pacific | USD 92.17 million | USD 392.84 million | 15.60% |
| 3 | Canada | North America | USD 38.20 million | USD 200.78 million | 18.05% |
| 4 | Japan | Asia Pacific | USD 29.06 million | USD 148.40 million | 17.71% |
| 5 | South Korea | Asia Pacific | USD 19.10 million | USD 109.12 million | 19.04% |
| 6 | United Kingdom | Europe | USD 19.10 million | USD 100.39 million | 18.05% |
| 7 | India | Asia Pacific | USD 14.95 million | USD 148.40 million | 25.80% |
| 8 | Saudi Arabia | Middle East and Africa | USD 14.95 million | USD 113.49 million | 22.47% |
| 9 | Germany | Europe | USD 14.95 million | USD 82.93 million | 18.69% |
| 10 | United Arab Emirates | Middle East and Africa | USD 13.29 million | USD 100.39 million | 22.41% |
| 11 | Australia | Asia Pacific | USD 12.46 million | USD 69.84 million | 18.81% |
| 12 | France | Europe | USD 10.80 million | USD 65.47 million | 19.75% |
China ranks second with USD 92.17 million in 2025 but grows a slower 15.60% a year because export controls limit its access to the newest accelerator racks.
Forecast Scenarios: How Large Could the AI Server BBU Market Be by 2035?
The 2035 AI server BBU market ranges from USD 3.23 billion to USD 5.41 billion around a base of USD 4.36 billion.
| Scenario | 2035 (USD million) | CAGR 2025-2035 | Assumption |
|---|---|---|---|
| Low | USD 3,229.98 million | 14.55% | In-rack attach stays near 50% and capacitor units replace batteries for holdup under 30 seconds |
| Base | USD 4,364.84 million | 18.05% | Attach rises to 68%, USD 215 per kW in 2035, five-year replacement |
| High | USD 5,412.40 million | 20.62% | 800 V power racks standardise battery backup and diesel reduction programmes lengthen holdup |
Who Are the Leading AI Server BBU Makers?
AES-KY, Lite-On Technology and Delta Electronics held about 70% of the USD 830.40 million 2025 market together (DC Market Insights estimate, based on AES-KY’s reported revenue and Lite-On’s stated BBU share).
- Advanced Energy Solution Holding (AES-KY)
- Lite-On Technology
- Delta Electronics
- Dynapack International Technology
- Simplo Technology
- Panasonic Energy
- LG Energy Solution
- Samsung SDI
- E-One Moli Energy (Molicel)
- Flex
- Infineon Technologies
- Murata Manufacturing
- EVE Energy
AES-KY’s 2025 revenue of NT$16.00 billion, about USD 500.03 million at NT$32 per US dollar, is almost all lithium-ion battery modules, and DC Market Insights attributes about USD 330 million of it to AI rack BBUs, about 40% of the market. Lite-On said BBUs will be close to 20% of its cloud segment in 2026 while the segment grows about 70%. Delta sells a 33 kW 50 V BBU shelf that runs 24 kW for 240 seconds after six years, plus a supercapacitor power capacitance shelf rated 20 kW for 15 seconds. Cell makers supply the modules: LG Energy Solution plans full-scale production of high-power tabless 2170 cells for BBU in the second half of 2026, and Samsung SDI credited BBUs and UPS batteries for AI data centers in its second-quarter 2026 results. Infineon Technologies publishes a 12 kW BBU reference design built from 3 kW power boards.
What Has Changed Recently for AI Server BBUs?
Seven dated events since March 2026 point to higher-power and 800 V BBUs in a market worth USD 1.11 billion in 2026.
- In October 2026, OCP published the Mt. Diablo Disaggregated Power Rack Specification v1.0.0 with BBU holdup of 45-90 seconds at full load (Source: Open Compute Project).
- In October 2026, Microsoft described Mt. Diablo sidecars with optional energy storage and open requirements for backup with less diesel (Source: Microsoft Azure).
- In July 2026, Lite-On said BBUs would be close to 20% of its cloud segment in 2026 and that two new cloud customers take mostly BBU shipments (Source: Lite-On Technology).
- In July 2026, LG Energy Solution set full-scale production of high-power tabless 2170 cells for BBU in the second half of 2026 (Source: LG Energy Solution).
- In May 2026, Panasonic raised its data center sales plan to JPY 550 billion for the year to March 2027 and JPY 950 billion for the year to March 2029 (Source: Panasonic Holdings).
- In March 2026, Delta Electronics showed 660 kW 800 V in-row power racks with 480 kW of BBU at NVIDIA GTC (Source: Delta Electronics).
- In March 2026, UL published the sixth edition of UL 9540A, effective 1 January 2027 (Source: UL Standards and Engagement).
Key Takeaways
Four AI server BBU findings matter most, starting from a USD 1.11 billion market in 2026.
- 2026 market size: USD 1.11 billion, up 34.19%, because BBU-backed AI rack capacity rises from 2.02 GW to 2.84 GW.
- 800 V DC Rack and Sidecar BBU reaches USD 1.27 billion by 2035, because racks above 200 kW leave 54 V busbars.
- BBU Module Replacement reaches USD 1.76 billion by 2035, because the AI fleets of 2025-2030 reach their battery refresh.
- Price per kW falls 46% to USD 215 by 2035, because backup time falls from 240 seconds to 45-90 seconds.
Research Methodology: How Did DC Market Insights Size the AI Server BBU Market?
DC Market Insights sized AI server BBUs bottom-up at USD 830.40 million for 2025.
The receipt: 12.0 GW of new IT capacity worldwide in 2025 x 35% AI share = 4.20 GW of AI racks; x 48% shipped with in-rack BBUs = 2.02 GW; x USD 400 per kW = USD 806.40 million; plus replacement of the 0.06 GW of BBU-backed AI racks installed in 2020 at the 2025 price = USD 24.00 million; total USD 830.40 million. The capacity, AI-share and price inputs are the same as in other DC Market Insights models, including the Data Center Battery Market and the AI Server Market; the Data Center Power Supply Unit Market covers the power shelves beside the BBUs.
Three bound checks hold. First ceiling: USD 830.40 million is 0.43% of NVIDIA’s USD 193.7 billion data center revenue for fiscal 2026. Second ceiling: it is 36% of the USD 2.33 billion of all rack BBU spending in the DC Market Insights Data Center Battery Market model, consistent with a 35% AI share of new capacity and a higher attach rate in AI racks. Floor: AES-KY’s 2025 battery module revenue of NT$15.95 billion, about USD 498 million, is mostly data center backup, and with Lite-On, Delta and Dynapack added the market cannot be under about USD 0.6 billion. Full method notes are on the research methodology page.
Table of contents
- 01Introduction
- 1.1Report Description
- 1.2Key Market Statistics, 2025, 2026, 2030 and 2035
- 02Executive Summary
- 2.1Market Snapshot, 2025, 2026 and 2035
- 2.2Market Size Chart, 2020-2035
- 03Market Scope
- 3.1Included
- 3.2Excluded
- 3.3How the Segments Fit Together
- 04Why Market Estimates Differ
- 4.1Scope Table: In and Out of This Estimate
- 05Market Drivers
- 5.1Meta's 140 kW Catalina Rack Ships with an ORv3 Battery Backup Unit
- 5.2AES-KY Sales Up 59.4% as One Customer Reaches 37% of Revenue
- 5.3Alphabet, Amazon and Meta Plan USD 130-205 Billion Each of 2026 Capital Spending
- 06Market Trends
- 6.1Backup Time Falls from 240 Seconds to 45-90 Seconds
- 6.2800 V BBU Shelves from Lite-On, Delta and Flex
- 6.3Capacitors Take the Sub-Second Job: 65 J per GPU in GB300 Power Shelves
- 07Market Challenges and Restraints
- 7.125% Section 301 Duty on Chinese Non-EV Lithium-Ion Batteries from 2026
- 7.2Room UPS Still Wins Half of AI Racks: In-Rack Attach at 48% in 2025
- 08Market Opportunities
- 8.1800 V DC Rack and Sidecar BBU: USD 1.27 billion by 2035
- 8.2BBU Module Replacement: USD 1.76 billion by 2035
- 09Pricing Analysis
- 9.1BBU Price per kW, 2020-2035
- 9.2Public Price Anchors
- 10Standards and Regulation
- 10.1OCP Open Rack V3 BBU Shelf and Module Specifications
- 10.2OCP Mt. Diablo Disaggregated Power Rack v1.0.0
- 10.3UL 9540A Sixth Edition and NFPA 855
- 10.4IEC 62619:2022
- 10.5UN 38.3
- 10.6EU Battery Regulation (EU) 2023/1542
- 10.7US Section 301 Tariffs
- 11Market Segmentation
- 11.1By Cell Chemistry
- 11.2High-Rate NMC and NCA Lithium-Ion
- 11.3Lithium Iron Phosphate
- 11.4Sodium-Ion and Lithium Titanate
- 11.5Supercapacitor and Hybrid Capacitor Modules
- 11.6By Rack Power Architecture
- 11.748 V to 54 V In-Rack BBU Shelves
- 11.8800 V DC Rack and Sidecar BBU
- 11.9By Deployment
- 11.10New AI Rack Installations
- 11.11BBU Module Replacement
- 11.12By End User
- 11.13Hyperscale Cloud Providers
- 11.14GPU Cloud and Neocloud Providers
- 11.15Colocation and Enterprise AI Deployments
- 11.16Sovereign and Research AI Facilities
- 12DC Exclusive: AI Rack Backup Teardown
- 12.1OCP Open Rack V3 BBU module (Meta spec Rev 1.4, 2023)
- 12.2OCP Open Rack V3 BBU shelf, 6 modules, 5+1 (Rev 1.1, 2022)
- 12.3Delta 33 kW BBU shelf, 50 V, 6 x 5.5 kW
- 12.4Lite-On 12 kW 2U BBU shelf, 50 V
- 12.5Lite-On 22 kW 3U BBU shelf, 800 V
- 12.6120 kW NVL72-class rack on ORv3 shelves (8 shelves)
- 12.7Mt. Diablo power rack, 1.1 MW at 90 s (OCP v1.0.0, 2026)
- 13Regional Insights
- 13.1North America
- 13.2Asia Pacific
- 13.3Europe
- 13.4Middle East and Africa
- 13.5Latin America
- 14Country Analysis
- 14.1United States
- 14.2China
- 14.3Canada
- 14.4Japan
- 14.5South Korea
- 14.6United Kingdom
- 14.7India
- 14.8Saudi Arabia
- 14.9Germany
- 14.10United Arab Emirates
- 14.11Australia
- 14.12France
- 15Forecast Scenarios, 2035
- 15.1Low Scenario
- 15.2Base Scenario
- 15.3High Scenario
- 16Competitive Insights
- 16.1Advanced Energy Solution Holding (AES-KY)
- 16.2Lite-On Technology
- 16.3Delta Electronics
- 16.4Dynapack International Technology
- 16.5Simplo Technology
- 16.6Panasonic Energy
- 16.7LG Energy Solution
- 16.8Samsung SDI
- 16.9E-One Moli Energy (Molicel)
- 16.10Flex
- 16.11Infineon Technologies
- 16.12Murata Manufacturing
- 16.13EVE Energy
- 17Recent Developments
- 17.1OCP Mt. Diablo Specification, October 2026
- 17.2Microsoft Mt. Diablo Sidecar Storage, October 2026
- 17.3Lite-On BBU Share of Cloud Segment, July 2026
- 17.4LG Energy Solution High-Power 2170 Cells for BBU, July 2026
- 17.5Panasonic Data Center Sales Plan, May 2026
- 17.6Delta 800 V In-Row Power Racks with BBU, March 2026
- 17.7UL 9540A Sixth Edition, March 2026
- 18Key Takeaways
- 18.12026 Market Size
- 18.2800 V DC Rack and Sidecar BBU by 2035
- 18.3BBU Module Replacement by 2035
- 18.4Price per kW by 2035
- 19Research Methodology
- 19.1Model Inputs
- 19.2Bound Checks
- Fig. 1AI Server BBU Market Size, 2020-2035 (USD million)
- Table 1Market Snapshot, 2025, 2026 and 2035
- Table 2Scope Table: In and Out of This Estimate
- Table 3BBU Price per kW, 2020-2035
- Table 4Market by Cell Chemistry, 2025 and 2035
- Table 5Market by Rack Power Architecture, 2025 and 2035
- Table 6Market by Deployment, 2025 and 2035
- Table 7Market by End User, 2025 and 2035
- Table 8AI Rack Backup Teardown
- Table 9Top 12 Countries, 2025 and 2035
- Table 102035 Forecast Scenarios
About this report
Written by Amit Jain and reviewed by Deepti Agrawal, Senior Editor, Research. Figures are built top-down and bottom-up and reconciled before publication, with 2025 as the base year.
Read our methodologyHow we built this
- Historical period2020-2024
- Base year2025
- Forecast period2026-2035
- Sizing approachTop-down + bottom-up
Need more than the report?
Advisory on this market
Due diligence, site selection and market entry work, by the analysts who wrote this report.
See consulting servicesFrequently asked questions
USD 1.11 billion in 2026, up 34.19% from USD 830.40 million in 2025, according to DC Market Insights estimates. The market is projected to reach USD 4.36 billion by 2035, a CAGR of 18.05% from 2025.
18.05% a year from 2025 to 2035, after 92.76% a year from 2020 to 2025, because the price per kW falls from USD 400 to USD 215 as backup time shortens.
A battery backup unit is a lithium-ion module that sits in a shelf inside the AI rack and carries the rack load through a power cut. An OCP Open Rack V3 module delivers 3 kW for 4 minutes from 66 cells.
About USD 400 per kW of rack load in 2025, or about USD 48,000 for a 120 kW NVL72-class rack at 240 seconds (DC Market Insights estimate), falling to USD 215 per kW by 2035.
The 2022 ORv3 shelf runs 15 kW for more than 240 seconds; the October 2026 Mt. Diablo specification asks for 45 to 90 seconds at full load, and Lite-On’s 12 kW shelf holds 45 seconds.
800 V DC rack and sidecar BBUs, from zero in 2025 to USD 1.27 billion by 2035, because racks above 200 kW move off 54 V busbars. Among chemistries, sodium-ion and lithium titanate grow 41.22% a year.
NVIDIA built 65 joules of capacitor storage per GPU into GB300 NVL72 power shelves for sub-second smoothing; battery backup is optional. DC Market Insights puts in-rack BBU attach at 48% of new AI rack kW in 2025.
North America, with USD 493.26 million or 59.4% of 2025 value by installation. The Middle East and Africa grows fastest at 21.98% a year, and India is the fastest large country at 25.80%.
AES-KY, Lite-On Technology and Delta Electronics hold about 70% of 2025 value together (DC Market Insights estimate). AES-KY’s 2025 revenue rose 59.4% to NT$16.00 billion, almost all lithium-ion battery modules.
USD 1.11 billion in 2026 is the DC Market Insights value of BBUs in AI racks only. Estimates that add BBUs in non-AI racks, cells counted twice, room UPS batteries or campus storage come out larger.
Licences, delivery and payment
Which licence should I choose?
Single User is a view-only PDF for one person. Multi User adds a printable PDF and the Excel data for unlimited users at one location. Enterprise covers your whole company and includes 100 free analyst hours.
How and when will I receive the report?
By email, within 24–48 business hours of payment, in the formats of your licence.
How can I pay?
Securely through PayPal: with a PayPal account, a debit or credit card, or PayPal Pay Later where available. Prices are in US dollars.
Can I see a sample first?
Yes. Request a free sample and we will email it to you.
Can the report be tailored to my needs?
Yes. We can add countries, segments or data cuts. Talk to an analyst about the scope you need.
Can I get an invoice or pay against a purchase order?
Write to sales@dcmarketinsights.com and our team will help.