
Data Center Battery Market Size, Share & Forecast to 2035
Market at a glance
The Data Center Battery market was worth USD 3,650.0 million in 2025 and is forecast to reach USD 9,250.0 million by 2035, growing at a 9.75% CAGR. North America accounts for 44.6% of the market.
 By Satyabrat Rajawat, Senior Research Analyst, Strategic Advisory
 Reviewed by Deepti Agrawal
Last updated 10 Oct 2026
Base year 2025 PDF + Excel
Source: DC Market Insights analysis
Key findings
Rack BBU Modules Reach USD 2.33 Billion as Backup Moves into the Rack
LFP Grows 19.17% a Year as Operators Choose Safer Cells
A Battery Room Fire Took 647 Systems Offline
Replacement Becomes 58.2% of Demand by 2035
What is inside the report
- 01Introduction
- 02Research Methodology
- 03Executive Summary
- 04Market Dynamics
- 05Pricing Analysis
- 06Standards and Regulation
- 07Supply Chain Analysis
- 08Market Size and Forecast
- 09Market by Chemistry
- 10Market by Application
- 20chapters
- 2020-2024Historical period
- 2026-2035Forecast period
- 12Companies profiled
Regional insights
- North America44.6%
- Asia Pacific27.8%
- Europe18.1%
- Middle East and Africa5.1%
- Latin America4.4%
Segmentation
Companies profiled
- Panasonic Energy
- Samsung SDI
- LG Energy Solution
- EnerSys
- Vertiv
- Eaton
- Dynapack
- ZincFive
- Lite-On
- AcBel
- Delta Electronics
- Peak Energy
Recent developments
ZincFive closed a USD 30 million Series F funding round to scale nickel-zinc battery backup for AI data centers (Source: insideHPC news report).
EnerSys launched DataSafe HX530T and HX600T lead batteries for high-rate data center UPS applications in North America (Source: Batteries International news report).
Energy Vault secured an initial 1.5 GWh offtake of Peak Energy's US-manufactured sodium-ion batteries for its AI data center storage offering (Source: ESS News report).
Panasonic Energy set a data-center energy storage sales target of approximately 1 trillion yen for the fiscal year ending March 2029 (Source: Panasonic Holdings investor presentation).
Samsung SDI said it will expand production capacity for high-power cylindrical batteries to address growing BBU demand (Source: Samsung SDI earnings release).
Dynapack said its BBU supplies to AI data centers could reach NT$6 billion to NT$7 billion in 2026 (Source: Taipei Times news report).
Full analysis
The Data Center Battery Market covers the electrochemical batteries that keep data center IT equipment running through power interruptions until generators start or loads shut down safely: battery strings and cabinets for centralized uninterruptible power supply (UPS) systems, batteries for edge and distributed UPS units, and battery backup unit (BBU) modules mounted in server racks. DC Market Insights values the global Data Center Battery Market at USD 3.65 billion in 2025 and forecasts USD 9.25 billion by 2035, a CAGR of 9.75%. The 2025 value is built from capacity: about 10.5 GW of new IT capacity, of which 42% (about 4.41 GW) carries rack BBU modules at about USD 400 per kW (USD 1.76 billion) and the remaining 6.09 GW carries about 1.52 GWh of UPS batteries at a blended USD 416 per kWh (USD 634.00 million); battery replacement across an installed base of about 66.7 GW adds USD 1.25 billion. Lithium iron phosphate (LFP) is the fastest-growing segment at 19.17% a year because UPS cabinet makers and newer BBU designs are moving to the safer, longer-life chemistry, and the Middle East and Africa is the fastest-growing region at 12.55% a year as DC Market Insights expects new AI campuses in the Gulf to add capacity from a small base.
Executive Summary
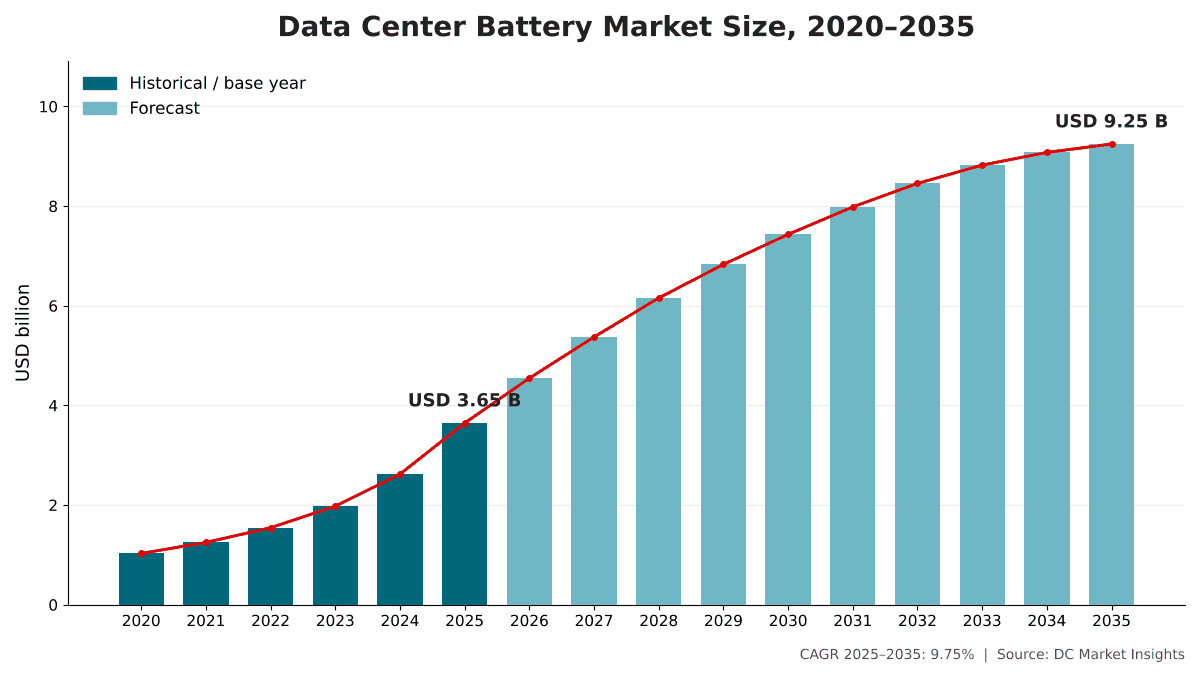
The Global Data Center Battery Market size was valued at USD 1.03 billion in 2020, reached USD 3.65 billion in 2025, and is anticipated to reach USD 9.25 billion by 2035, at a CAGR of 9.75% during the forecast period.
| Report attribute | Details |
|---|---|
| Historical Period | 2020-2024 |
| Base Year | 2025 |
| Forecast Period | 2026-2035 |
| Data Center Battery Market Size 2025 | USD 3.65 Billion |
| Data Center Battery Market, CAGR | 9.75% |
| Data Center Battery Market Size 2035 | USD 9.25 Billion |
DC Market Insights estimates that the market grew at 28.79% a year between 2020 and 2025, and that 2025 alone added 39.1% over 2024. Rack BBU drove most of that rise: hyperscale and AI operators moved backup energy from the battery room into the rack, and the share of new IT capacity carrying rack BBU rose from 12% in 2020 to 42% in 2025 in the DC Market Insights model.
Growth slows to 9.75% a year from 2025 to 2035 because battery prices keep falling while installed lithium-ion strings last longer than the lead-acid strings they replace. In the model, the price of a rack BBU module falls from USD 400 per kW in 2025 to USD 215 per kW in 2035, new IT capacity rises from 10.5 GW to 23.6 GW a year, and replacement of BBU modules on an installed base that passes 110 GW of BBU-equipped capacity becomes the largest source of demand from 2033.
Market Scope: What Does the Data Center Battery Market Cover?
DC Market Insights values the Data Center Battery Market at USD 3.65 billion in 2025. The market covers battery hardware sold for data center backup power, valued at first sale in current US dollars, with 2025 as the base year and forecasts to 2035.
Included. Battery cells, modules, strings and cabinets with their battery management systems (BMS) for centralized UPS systems; batteries for single-phase, row-level and edge UPS units; and rack BBU modules, including the charger and discharger built into each module. Chemistries covered are lithium-ion (LFP and nickel manganese cobalt (NMC) types), valve-regulated lead-acid (VRLA), nickel-zinc and sodium-ion. Replacement batteries for installed systems are included.
Excluded. UPS power electronics such as rectifiers, inverters and static switches; BBU shelves, power supply units and rack power shelves; flywheels and supercapacitors; campus-scale battery energy storage systems (BESS) used for grid services or load smoothing; generators; and installation labor. Campus BESS, flywheels and supercapacitors are covered in the Data Center Energy Storage Market report, and UPS electronics in the Data Center UPS Market report.
How the segments fit together. The application split (rack BBU, centralized UPS and edge UPS batteries) and the deployment split (new builds and replacement) are the build layers of the model. The chemistry, data center type and regional splits re-cut the same total.
Market Drivers: What Drives the Data Center Battery Market?
Rack-level battery backup units (BBU), worth USD 2.33 billion in 2025 in the DC Market Insights model, are the largest of three growth drivers in the data center battery market. The other two are rising data center electricity demand and the shift from lead-acid to lithium-ion in UPS battery rooms.
Rack BBU Modules Reach USD 2.33 Billion as Backup Moves into the Rack
The Open Compute Project (OCP) Open Rack Version 3 (V3) BBU specification puts a 3 kW discharger in each BBU module and requires the battery pack to deliver 3 kW for at least 4 minutes, and it names lithium-ion as suitable for this high discharge rate (Source: OCP Open Rack V3 BBU specification). DC Market Insights estimates that 42% of new IT capacity carried rack BBU in 2025, rising to 55% in 2030 and 60% in 2035, and that rack BBU accounts for 64.0% of 2025 market value. Suppliers are adding capacity: Taiwanese pack maker Dynapack says its BBU supplies to AI data centers could reach 6 billion to 7 billion New Taiwan dollars (NT$) in 2026 and expects mass production of 8 kW and 12 kW BBUs to start in the fourth quarter, and Panasonic Energy plans to begin mass production of BBUs built for high-voltage direct current (HVDC) power within the fiscal year ending March 2027.
Data Center Electricity Use Doubles to About 945 TWh by 2030
The International Energy Agency (IEA) estimates that data centers used around 415 terawatt hours (TWh) of electricity in 2024 and projects consumption to double to around 945 TWh by 2030 in its Base Case (Source: IEA Energy and AI). BloombergNEF counted 23.1 GW of data center capacity under construction across 831 sites, 15.9 GW of it in the United States. DC Market Insights models new IT capacity rising from 10.5 GW in 2025 to 19.5 GW in 2030 and 23.6 GW in 2035, which lifts the installed base from about 66.7 GW in 2025 to about 239.8 GW in 2035. Nearly every megawatt of new IT load needs backup energy, most of it from batteries in the rack or in a UPS room.
Lithium-Ion Replaces Lead-Acid in UPS Battery Rooms
Vertiv states that lithium-ion UPS batteries last 8 to 10 years or more, two to three times the life of VRLA units, and are smaller and lighter. DC Market Insights estimates that lithium-ion took 55% of new centralized UPS battery capacity in 2025, rising to 74% in 2030 and 84% in 2035. UPS makers now sell lithium cabinets sized for high-density halls: Vertiv’s EnergyCore lithium battery cabinets are 600 mm wide, optimized for five minutes of end-of-life runtime, listed to the Underwriters Laboratories (UL) 1973 standard and tested to UL 9540A (Source: Vertiv news release), and Eaton sells the Eaton Samsung Gen 3 lithium-ion battery system with performance guaranteed for up to 12 years.
Market Trends: How Are Data Center Batteries Changing?
Lithium-ion holds 82.5% of 2025 value, according to DC Market Insights estimates. Three changes stand out: LFP is gaining on NMC, BBU power ratings are rising with AI rack density, and non-lithium chemistries are winning a niche on safety.
LFP Grows 19.17% a Year as Operators Choose Safer Cells
LFP batteries are worth USD 651.44 million in 2025 and USD 3.76 billion by 2035 in the DC Market Insights model, rising from 17.9% to 40.7% of market value. NMC and other lithium-ion types still lead the data center battery market, which DC Market Insights attributes to the use of high-power cylindrical cells in BBU modules. Samsung SDI says it will expand production capacity for high-power cylindrical batteries to meet growing demand from BBU, after higher sales of high-power batteries for UPS systems and BBUs, along with power tools and electric vehicles in Europe, lifted its battery business revenue (Source: Samsung SDI earnings release, July 2026).
BBU Ratings Rise from 3 kW to 12 kW per Module
The OCP Open Rack V3 module is rated at 3 kW, while Dynapack plans mass production of 8 kW and 12 kW BBUs in the fourth quarter of 2026, and Panasonic Energy lists high-output BBUs as a new product in its medium-term plan and cites BBU built-in shelves among next-generation data center platforms. DC Market Insights models the BBU module price falling from USD 400 per kW in 2025 to USD 295 per kW in 2030 as higher-rated modules spread fixed costs over more kilowatts.
Nickel-Zinc and Sodium-Ion Win a Safety Niche
ZincFive, which raised a USD 30 million Series F funding round, says nearly 2 GW of its nickel-zinc battery backup cabinets are deployed or contracted across the data center industry (Source: insideHPC news report). In July 2026, Samsung SDI said it is advancing development of a sodium-ion battery for AI data center UPS applications. Nickel-zinc and sodium-ion together are worth USD 21.72 million in 2025 and USD 111.89 million by 2035 in the model, a CAGR of 17.81%.
Market Challenges: What Holds the Data Center Battery Market Back?
A single lithium-ion battery fire in September 2025 took 647 government systems offline in South Korea. Fire risk and long lead-acid replacement cycles are the two main constraints.
A Battery Room Fire Took 647 Systems Offline
In September 2025, a fire at South Korea’s National Information Resources Service (NIRS) data center in Daejeon destroyed 384 batteries and knocked 647 systems offline (Source: Korea Times news report). The UPS system, lithium-ion batteries and servers were all housed in the same room. DC Market Insights expects incidents of this kind to push operators toward separate battery rooms, fire-rated cabinets and LFP or non-lithium chemistries, which raise cost per kWh in the short term.
Lead-Acid Lingers in the Installed Base
DC Market Insights estimates that VRLA batteries are still worth USD 616.73 million in 2025, or 16.9% of market value, because colocation and enterprise sites replace existing strings like for like. EnerSys launched its DataSafe HX530T and HX600T lead batteries for high-rate data center UPS applications in North America in January 2026 (Source: Batteries International news report), and lead-acid batteries accounted for an estimated 67% of US apparent consumption of lead in 2025 according to the US Geological Survey (USGS). DC Market Insights models VRLA value falling 5.18% a year to USD 362.47 million in 2035, slowing the shift to lithium-ion in older halls.
Market Opportunities: Where Are the New Revenue Pools?
Replacement and retrofit work rises from USD 1.25 billion in 2025 to USD 5.38 billion in 2035 in the DC Market Insights model, the largest new revenue pool in the data center battery market. Graphics processing unit (GPU) and neocloud operators are the fastest-growing buyer group at 14.00% a year.
Replacement Becomes 58.2% of Demand by 2035
Rack BBU modules are replaced about every five years in the DC Market Insights model, against ten years for lithium-ion UPS strings. As BBU-equipped capacity grows from about 11.4 GW in 2025 to about 110.1 GW in 2035, replacement and retrofit spending grows 15.73% a year and rises from 34.2% to 58.2% of market value. Replacement contracts also convert VRLA strings to lithium-ion cabinets during UPS upgrades.
GPU and Neocloud Operators Spend USD 1.94 Billion by 2035
Specialist GPU cloud operators spent USD 524.11 million on data center batteries in 2025, rising to USD 1.94 billion in 2035 in the model. Their racks use BBU designs from the start. LG Energy Solution says UPS and BBU have become critical parts for data centers and plans to strengthen its lineup for them (Source: LG Energy Solution earnings release, July 2026).
Pricing: How Much Do Data Center Batteries Cost?
A rack BBU module costs about USD 400 per kW of backed-up IT load in 2025. A lithium-ion UPS battery cabinet costs about USD 520 per kWh and a VRLA string about USD 280 per kWh. These are DC Market Insights estimates for data center battery market hardware excluding labor.
| Battery price (USD) | 2020 | 2025 | 2030 | 2035 |
|---|---|---|---|---|
| Lithium-ion UPS battery system, per kWh | 700 | 520 | 430 | 360 |
| VRLA UPS battery string, per kWh | 300 | 280 | 270 | 260 |
| Nickel-zinc UPS battery cabinet, per kWh | 620 | 500 | 420 | 350 |
| Rack BBU module, per kW of backed-up IT load | 420 | 400 | 295 | 215 |
Cell prices set the floor. BloombergNEF found that average lithium-ion pack prices fell 8% in 2025 to a record low of USD 108 per kWh, and that stationary storage packs dropped to USD 70 per kWh. UPS and BBU batteries cost several times more per kWh because they are built to discharge at high power for minutes, with fire-rated cabinets and their own BMS. On the lead-acid side, the USGS reports that the North American lead price averaged 106 cents per pound in the first 10 months of 2025, against 108.8 cents in 2024, which keeps VRLA prices flat.
Standards and Regulation: Which Rules Shape Data Center Batteries?
NFPA 855, now in its 2026 edition, is one of 4 rule sets that shape products in the data center battery market. The others are the UL 9540 and UL 9540A safety standards, the IEC 62619 lithium cell standard and the OCP rack specifications.
NFPA 855 (2026 edition). The National Fire Protection Association (NFPA) Standard for the Installation of Stationary Energy Storage Systems sets requirements for installing stationary energy storage systems, including battery systems.
UL 9540 and UL 9540A. UL 9540, the Standard for Energy Storage Systems and Equipment, covers electrical, electrochemical, mechanical and other storage technologies. UL 9540A is the test method for evaluating thermal runaway fire propagation in battery energy storage systems, and Vertiv cites it for its EnergyCore cabinets.
IEC 62619:2022. The International Electrotechnical Commission (IEC) standard specifies requirements and tests for the safe operation of secondary lithium cells and batteries used in industrial applications, including stationary applications.
OCP Open Rack V3 BBU. The Open Compute Project specification sets a 3 kW BBU module that must discharge for at least 4 minutes, which sets a minimum backup energy per module.
Market Segmentation: Which Segment Leads the Data Center Battery Market?
DC Market Insights estimates that NMC and other lithium-ion types lead with 64.6% of 2025 value. Rack BBU leads applications with 64.0%, and hyperscale data centers lead buyers with 51.7%. LFP is the fastest-growing segment at 19.17% a year, against 7.83% for NMC, because UPS cabinet makers and newer BBU designs favor its longer life and lower fire risk.
By Chemistry: NMC and Other Lithium-Ion Lead with 64.6%
| Chemistry | 2025 (USD billion) | Share 2025 | 2035 (USD billion) | CAGR 2025-2035 |
|---|---|---|---|---|
| NMC and Other Lithium-Ion | 2.36 | 64.6% | 5.01 | 7.83% |
| Lithium Iron Phosphate (LFP) | 0.65 | 17.9% | 3.76 | 19.17% |
| Lead-Acid (VRLA) | 0.62 | 16.9% | 0.36 | -5.18% |
| Nickel-Zinc and Sodium-Ion | 0.02 | 0.6% | 0.11 | 17.81% |
LFP rises from 17.9% to 40.7% of value by 2035, while VRLA falls from 16.9% to 3.9%.
By Application: Rack BBU Leads with 64.0%
| Application | 2025 (USD billion) | Share 2025 | 2035 (USD billion) | CAGR 2025-2035 |
|---|---|---|---|---|
| Rack-Level Battery Backup Units (BBU) | 2.33 | 64.0% | 7.23 | 11.99% |
| Centralized UPS Batteries | 1.16 | 31.7% | 1.73 | 4.13% |
| Edge and Distributed UPS Batteries | 0.16 | 4.3% | 0.28 | 5.99% |
Centralized UPS batteries grow only 4.13% a year because lithium-ion strings last longer than the VRLA strings they replace, so fewer replacements are bought per megawatt.
By Data Center Type: Hyperscale Data Centers Lead with 51.7%
| Data center type | 2025 (USD billion) | Share 2025 | 2035 (USD billion) | CAGR 2025-2035 |
|---|---|---|---|---|
| Hyperscale Data Centers | 1.89 | 51.7% | 4.94 | 10.11% |
| Colocation Data Centers | 0.71 | 19.4% | 1.59 | 8.44% |
| GPU and Neocloud Providers | 0.52 | 14.4% | 1.94 | 14.00% |
| Enterprise Data Centers | 0.42 | 11.5% | 0.55 | 2.74% |
| Edge Data Centers | 0.11 | 3.0% | 0.23 | 7.41% |
In the DC Market Insights model, hyperscale operators buy most rack BBU modules, colocation providers buy the largest share of centralized UPS batteries, and enterprise data centers grow slowest as workloads move to cloud and colocation sites.
By Deployment: New Builds Lead with 65.8%
New builds account for USD 2.40 billion of 2025 value and reach USD 3.87 billion by 2035, a CAGR of 4.90%. Replacement and retrofit work is worth USD 1.25 billion in 2025 and grows faster at 15.73% a year, overtaking new builds in 2032 in the base case.
DC Exclusive: The Chemistry × Application Battery Matrix
At USD 2.05 billion in 2025, NMC-type rack BBU is the single largest cell of the matrix and 56.3% of the data center battery market. The matrix is a DC Market Insights model built from 45 inputs: 16 annual IT capacity cohorts (2020 to 2035), 5 price curves, 4 chemistry and BBU adoption curves, 3 replacement cycles, 10 buyer weights, 2 LFP share curves and 5 regional splits.
| 2025, USD billion | Centralized UPS | Edge and Distributed UPS | Rack BBU | Total |
|---|---|---|---|---|
| NMC and Other Lithium-Ion | 0.27 | 0.04 | 2.05 | 2.36 |
| Lithium Iron Phosphate (LFP) | 0.33 | 0.04 | 0.28 | 0.65 |
| Lead-Acid (VRLA) | 0.54 | 0.07 | 0.00 | 0.62 |
| Nickel-Zinc and Sodium-Ion | 0.02 | 0.00 | 0.00 | 0.02 |
| Total | 1.16 | 0.16 | 2.33 | 3.65 |
VRLA is still the largest chemistry inside centralized UPS rooms, at USD 542.72 million or 46.9% of that application, while rack BBU is almost entirely lithium-ion and 88% NMC-type. The chemistry contest therefore plays out in UPS rooms, where LFP cabinets and nickel-zinc cabinets compete to replace lead-acid strings. Totals may not add because of rounding.
The key inputs are new IT capacity (10.5 GW in 2025), the rack BBU share of it (42%) and the five-year BBU replacement cycle. The assumptions are explained on our research methodology page.
Regional Insights: Which Region Leads the Data Center Battery Market?
North America leads with 44.6% of 2025 value, according to DC Market Insights estimates. The Middle East and Africa is the fastest-growing region at 12.55% a year, because DC Market Insights expects new AI campuses in Saudi Arabia and the United Arab Emirates to add capacity from a small base.
North America Leads with 44.6% Share
DC Market Insights estimates that North American operators spent USD 1.63 billion on data center batteries in 2025, and the region is forecast to reach USD 3.82 billion in 2035, a CAGR of 8.93%. The United States hosts 15.9 GW of the 23.1 GW of data center capacity under construction worldwide according to BloombergNEF.
Asia Pacific Holds 27.8% Share
Asia Pacific is worth USD 1.01 billion in 2025 and USD 2.84 billion by 2035, a CAGR of 10.84%. The region is also home to several suppliers named in this report: Panasonic Energy in Japan, Samsung SDI and LG Energy Solution in South Korea, and Dynapack, Lite-On and AcBel in Taiwan.
Europe Holds 18.1% Share
Europe is worth USD 659.86 million in 2025 and USD 1.49 billion by 2035, a CAGR of 8.52%. DC Market Insights expects colocation-heavy markets such as Frankfurt, Amsterdam and Dublin to keep a higher share of centralized UPS batteries than North America.
Middle East and Africa Holds 5.1% Share
The Middle East and Africa is worth USD 185.93 million in 2025 and USD 606.32 million by 2035, growing fastest at 12.55% a year, with new campuses designed for rack BBU from the start.
Latin America Holds 4.4% Share
Latin America is worth USD 160.41 million in 2025 and USD 484.50 million by 2035, a CAGR of 11.69%, with DC Market Insights assuming longer battery runtimes than in North America because of weaker grids.
Country Analysis: Which Countries Spend the Most on Data Center Batteries?
The United States leads with USD 1.44 billion in 2025. That is 39.5% of global value, followed by China at USD 364.85 million (10.0%) and Canada at USD 169.10 million (4.6%). The 12 largest countries account for 79.5% of 2025 spending.
| Rank | Country | Region | 2025 (USD billion) | Share 2025 | 2035 (USD billion) | CAGR 2025-2035 |
|---|---|---|---|---|---|---|
| 1 | United States | North America | 1.44 | 39.5% | 3.31 | 8.68% |
| 2 | China | Asia Pacific | 0.36 | 10.0% | 0.98 | 10.44% |
| 3 | Canada | North America | 0.17 | 4.6% | 0.45 | 10.33% |
| 4 | United Kingdom | Europe | 0.14 | 3.9% | 0.30 | 7.92% |
| 5 | Japan | Asia Pacific | 0.14 | 3.8% | 0.36 | 10.14% |
| 6 | Germany | Europe | 0.14 | 3.7% | 0.31 | 8.72% |
| 7 | India | Asia Pacific | 0.10 | 2.8% | 0.48 | 16.74% |
| 8 | South Korea | Asia Pacific | 0.10 | 2.6% | 0.28 | 11.14% |
| 9 | Australia | Asia Pacific | 0.09 | 2.4% | 0.27 | 11.94% |
| 10 | France | Europe | 0.08 | 2.3% | 0.20 | 9.02% |
| 11 | Brazil | Latin America | 0.07 | 2.0% | 0.24 | 12.29% |
| 12 | Netherlands | Europe | 0.07 | 1.9% | 0.15 | 8.02% |
India is the fastest-growing large country market at 16.74% a year, as hyperscale and colocation operators add new capacity from a small base. The country figures are a DC Market Insights allocation of the regional totals, weighted by each country’s estimated share of installed and new data center capacity.
Forecast Scenarios: How Could the 2035 Forecast Change?
The base case for the data center battery market reaches USD 9.25 billion by 2035. Scenarios give a range of USD 7.71 billion to USD 10.56 billion across the low and high scenarios.
| Scenario | Assumption from 2026 | 2035 (USD billion) | CAGR 2025-2035 |
|---|---|---|---|
| Low | Capacity additions 15% below base; BBU modules replaced every six years | 7.71 | 7.78% |
| Base | Additions rise to 23.6 GW a year; rack BBU reaches 60% of new capacity | 9.25 | 9.75% |
| High | Additions 10% above base; slower BBU price declines as module ratings rise | 10.56 | 11.22% |
The low case reflects a pause in AI capital spending and longer service lives for lithium-ion modules. The high case assumes that higher-rated BBU modules hold their price per kW and that supplier targets such as Panasonic Energy’s are met in full.
Competitive Insights: Who Leads the Data Center Battery Market?
- Panasonic Energy
- Samsung SDI
- LG Energy Solution
- EnerSys
- Vertiv
- Eaton
- Dynapack
- ZincFive
- Lite-On
- AcBel
- Delta Electronics
- Peak Energy
DC Market Insights estimates that the three largest lithium-ion cell and pack suppliers, Panasonic Energy, Samsung SDI and LG Energy Solution, together hold about 55% of 2025 value, because NMC-type cylindrical cells dominate rack BBU. Panasonic Energy targets data-center energy storage sales of approximately 1 trillion yen in the fiscal year ending March 2029, about three times the fiscal 2026 level, and its target covers its data center storage business as a whole. EnerSys reported record fiscal 2026 net sales of USD 3.75 billion, said strength in its data center business drove favorable price and mix, and is advancing a new lithium data center solution into customer commissioning (Source: EnerSys filing with the US Securities and Exchange Commission). Vertiv, with second-quarter 2026 net sales of USD 3.27 billion, and Eaton sell lithium-ion battery cabinets with their UPS platforms. ZincFive makes nickel-zinc battery backup cabinets for data centers. In Taiwan, Dynapack makes BBU packs, Lite-On reports strong demand for AI server power supplies and BBUs, AcBel is developing BBUs, and Delta Electronics reported record second-quarter 2026 revenue of NT$183.26 billion. Peak Energy makes sodium-ion batteries, and Energy Vault has secured an initial 1.5 GWh offtake of them for its AI data center storage offering.
Recent Developments
- In December 2025, ZincFive closed a USD 30 million Series F funding round to scale nickel-zinc battery backup for AI data centers (Source: insideHPC news report).
- In January 2026, EnerSys launched DataSafe HX530T and HX600T lead batteries for high-rate data center UPS applications in North America (Source: Batteries International news report).
- In February 2026, Energy Vault secured an initial 1.5 GWh offtake of Peak Energy’s US-manufactured sodium-ion batteries for its AI data center storage offering (Source: ESS News report).
- In June 2026, Panasonic Energy set a data-center energy storage sales target of approximately 1 trillion yen for the fiscal year ending March 2029 (Source: Panasonic Holdings investor presentation).
- In July 2026, Samsung SDI said it will expand production capacity for high-power cylindrical batteries to address growing BBU demand (Source: Samsung SDI earnings release).
- In July 2026, Dynapack said its BBU supplies to AI data centers could reach NT$6 billion to NT$7 billion in 2026 (Source: Taipei Times news report).
We follow these data center battery market deals, launches and capacity announcements as they happen in our data center industry updates.
Methodology: How We Built the Data Center Battery Market Model
DC Market Insights built this market bottom-up from 16 annual IT capacity cohorts (2020 to 2035). The installed base of about 57 GW of IT capacity at the end of 2024 is consistent with the IEA estimate of around 415 TWh of data center electricity use in 2024 at an assumed power usage effectiveness of 1.4 and average utilization of 60%, and 1.5% of the base retires each year. Each year’s new capacity is split between rack BBU (12% in 2020, 42% in 2025, 60% in 2035), priced per kW, and centralized UPS batteries at 0.25 MWh per MW, split by chemistry and priced with separate lithium-ion, VRLA, nickel-zinc and sodium-ion cost curves. Replacement spending is added on the installed base, with VRLA strings replaced every 5 years, lithium-ion and nickel-zinc UPS strings every 10 years and BBU modules every 5 years. The total was split by 4 chemistries, 3 applications, 5 data center types, 2 deployment types and 5 regions, and every split sums to the market total. The result was checked against three bounds: a ceiling from the DC Market Insights Data Center Energy Storage Market model, whose UPS and rack BBU layers (USD 4.07 billion in 2025, including BBU chargers, flywheels and supercapacitors) must exceed this battery-only value; a floor from named supplier activity, with Dynapack’s NT$6 billion to NT$7 billion of 2026 BBU supplies and ZincFive’s nearly 2 GW of cabinets sitting well inside the modeled values; and a price check against BloombergNEF’s USD 108 per kWh average lithium-ion pack price, which sits well below the modeled USD 520 per kWh for complete UPS battery systems.
Table of contents
- 01Introduction
- 1.1Market Definition and Scope
- 1.2Included and Excluded Products
- 1.3Currency, Pricing and Base Year
- 1.4Key Stakeholders
- 02Research Methodology
- 2.1Bottom-Up Capacity Cohort Model
- 2.2Price Curves and Replacement Cycles
- 2.3Bound Checks
- 2.4Data Sources and Assumptions
- 03Executive Summary
- 3.1Market Snapshot, 2025 and 2035
- 3.2Key Findings
- 3.3Analyst Viewpoint
- 04Market Dynamics
- 4.1Drivers
- 4.2Trends
- 4.3Challenges
- 4.4Opportunities
- 05Pricing Analysis
- 5.1Lithium-Ion UPS Battery System Price per kWh
- 5.2VRLA UPS Battery String Price per kWh
- 5.3Nickel-Zinc UPS Battery Cabinet Price per kWh
- 5.4Rack BBU Module Price per kW
- 5.5Cell and Pack Price Benchmarks
- 06Standards and Regulation
- 6.1NFPA 855
- 6.2UL 9540 and UL 9540A
- 6.3IEC 62619
- 6.4OCP Open Rack V3 BBU Specification
- 07Supply Chain Analysis
- 7.1Cell Manufacturers
- 7.2Pack and BBU Module Makers
- 7.3UPS and Battery Cabinet Vendors
- 7.4Recycling and End-of-Life
- 08Market Size and Forecast
- 8.1Market Size, 2020-2035
- 8.2Year-on-Year Growth
- 8.3New Builds versus Replacement
- 09Market by Chemistry
- 9.1NMC and Other Lithium-Ion
- 9.2Lithium Iron Phosphate (LFP)
- 9.3Lead-Acid (VRLA)
- 9.4Nickel-Zinc and Sodium-Ion
- 10Market by Application
- 10.1Rack-Level Battery Backup Units (BBU)
- 10.2Centralized UPS Batteries
- 10.3Edge and Distributed UPS Batteries
- 11Market by Data Center Type
- 11.1Hyperscale Data Centers
- 11.2Colocation Data Centers
- 11.3GPU and Neocloud Providers
- 11.4Enterprise Data Centers
- 11.5Edge Data Centers
- 12Market by Deployment
- 12.1New Builds
- 12.2Replacement and Retrofit
- 13DC Exclusive: Chemistry × Application Battery Matrix
- 13.1Values by Chemistry and Application, 2025
- 13.2Model Inputs
- 14Market by Region
- 14.1North America (United States, Canada)
- 14.2Asia Pacific (China, Japan, India, South Korea, Australia)
- 14.3Europe (United Kingdom, Germany, France, Netherlands)
- 14.4Middle East and Africa
- 14.5Latin America (Brazil)
- 15Country Analysis
- 15.1Top 12 Countries, 2025 and 2035
- 15.2Fastest-Growing Countries
- 16Regional Cross-Sections
- 16.1Regional Share and Growth, 2025 and 2035
- 16.2Country Share within Each Region, 2025
- 17Forecast Scenarios
- 17.1Low Scenario
- 17.2Base Scenario
- 17.3High Scenario
- 18Competitive Landscape
- 18.1Supplier Concentration
- 18.2Competitive Positioning by Chemistry
- 18.3Recent Developments
- 19Company Profiles
- 19.1Panasonic Energy
- 19.2Samsung SDI
- 19.3LG Energy Solution
- 19.4EnerSys
- 19.5Vertiv
- 19.6Eaton
- 19.7Dynapack
- 19.8ZincFive
- 19.9Lite-On
- 19.10AcBel
- 19.11Delta Electronics
- 19.12Peak Energy
- 20Analyst Recommendations
- 20.1For Data Center Operators
- 20.2For Battery and BBU Suppliers
- 20.3For Investors
- Fig. 1Data Center Battery Market Size, 2020–2035
- Fig. 2Market Share by Chemistry, 2025 and 2035
- Fig. 3Market Share by Application, 2025 and 2035
- Fig. 4Market Share by Data Center Type, 2025 and 2035
- Fig. 5Market Share by Region, 2025
- Fig. 6Rack BBU Share of New IT Capacity, 2020–2035
- Fig. 7New Builds versus Replacement, 2025 and 2035
- Fig. 8Forecast Scenarios, 2035
- Table 1Report Attributes
- Table 2Battery Prices, 2020, 2025, 2030 and 2035
- Table 3Market by Chemistry, 2025 and 2035
- Table 4Market by Application, 2025 and 2035
- Table 5Market by Data Center Type, 2025 and 2035
- Table 6Market by Deployment, 2025 and 2035
- Table 7Chemistry × Application Matrix, 2025
- Table 8Market by Region, 2025 and 2035
- Table 9Top 12 Countries, 2025 and 2035
- Table 10Forecast Scenarios, 2035
- Table 11Standards and Regulations
About this report
Written by Satyabrat Rajawat and reviewed by Deepti Agrawal, Senior Editor, Research. Figures are built top-down and bottom-up and reconciled before publication, with 2025 as the base year.
Read our methodologyHow we built this
- Historical period2020-2024
- Base year2025
- Forecast period2026-2035
- Sizing approachTop-down + bottom-up
Need more than the report?
Advisory on this market
Due diligence, site selection and market entry work, by the analysts who wrote this report.
See consulting servicesFrequently asked questions
USD 3.65 billion in 2025, rising to USD 9.25 billion by 2035. DC Market Insights estimates the market at USD 1.03 billion in 2020.
9.75% a year from 2025 to 2035. Growth was faster, at 28.79% a year, between 2020 and 2025 as rack BBU adoption rose (DC Market Insights estimate).
Rack-level battery backup units, with USD 2.33 billion or 64.0% of 2025 value, ahead of centralized UPS batteries at 31.7% (DC Market Insights estimate).
NMC and other lithium-ion types, with 64.6% of 2025 value. LFP is the fastest-growing segment at 19.17% a year, while VRLA lead-acid falls 5.18% a year (DC Market Insights estimates).
About USD 400 per kW for a rack BBU module, USD 520 per kWh for a lithium-ion UPS battery system and USD 280 per kWh for VRLA in 2025, according to DC Market Insights estimates.
North America, with USD 1.63 billion or 44.6% of 2025 value. The Middle East and Africa grows fastest at 12.55% a year (DC Market Insights estimates).
Panasonic Energy, Samsung SDI and LG Energy Solution together hold about 55% of 2025 value (DC Market Insights estimate). EnerSys, Vertiv, Eaton, Dynapack, ZincFive, Lite-On, AcBel, Delta Electronics and Peak Energy also compete.
USD 1.44 billion in the United States, or 39.5% of 2025 spending, followed by China at USD 364.85 million. India grows fastest among large country markets at 16.74% a year (DC Market Insights estimate).
Licences, delivery and payment
Which licence should I choose?
Single User is a view-only PDF for one person. Multi User adds a printable PDF and the Excel data for unlimited users at one location. Enterprise covers your whole company and includes 100 free analyst hours.
How and when will I receive the report?
By email, within 24–48 business hours of payment, in the formats of your licence.
How can I pay?
Securely through PayPal: with a PayPal account, a debit or credit card, or PayPal Pay Later where available. Prices are in US dollars.
Can I see a sample first?
Yes. Request a free sample and we will email it to you.
Can the report be tailored to my needs?
Yes. We can add countries, segments or data cuts. Talk to an analyst about the scope you need.
Can I get an invoice or pay against a purchase order?
Write to sales@dcmarketinsights.com and our team will help.