
Server Storage Area Network Market Size, Share & Forecast to 2035
Market at a glance
The Server Storage Area Network market was worth USD 15.91 billion in 2025 and is forecast to reach USD 25.99 billion by 2035, growing at a 5.03% CAGR. North America accounts for 38.66% of the market.
 By Amit Jain, Senior Consultant, ICT & Emerging Technologies
 Reviewed by Deepti Agrawal
Last updated 16 Oct 2026
Base year 2025 PDF + Excel
Reviewed by Deepti Agrawal
Last updated 16 Oct 2026
Base year 2025 PDF + Excel
Source: DC Market Insights analysis
Key findings
A larger enterprise and colocation installed base
Gen 8 Fibre Channel at 128G
Cloud and hyperscale use other architectures
End-to-end NVMe block storage
What is inside the report
- 01Introduction
- 02Executive Summary
- 03Market Scope and Estimate Comparison
- 04Market Dynamics
- 05Pricing Analysis
- 06Standards and Regulation
- 07Market Segmentation
- 08DC Exclusive
- 09Regional Insights
- 10Country Analysis
- 13chapters
- 2020-2024Historical period
- 2026-2035Forecast period
- 15Companies profiled
Regional insights
- North America38.66%
- Asia Pacific30.21%
- Europe22.87%
- Middle East and Africa4.43%
- Latin America3.83%
Segmentation
Companies profiled
- Dell Technologies (PowerMax, PowerStore, PowerVault)
- Huawei (OceanStor Dorado)
- NetApp (AFF, ASA)
- Hewlett Packard Enterprise (Alletra, MSA)
- Everpure, formerly Pure Storage (FlashArray)
- IBM (FlashSystem, DS8000)
- Hitachi Vantara (VSP One)
- Broadcom (Brocade switches, Emulex HBAs)
- Cisco (MDS switches)
- Marvell (QLogic HBAs)
- Lenovo (ThinkSystem DE and DM)
- Fujitsu (ETERNUS)
- Inspur
- Infinidat
- MacroSAN
Recent developments
Dell Technologies launched PowerStore Elite at Dell Technologies World (Source: Dell investor relations).
IBM launched the FlashSystem 5600, 7600 and 9600 with up to 40% greater data efficiency (Source: IBM newsroom).
Broadcom introduced the Brocade X8 directors and G820 switch, the first Gen 8 128G Fibre Channel platforms (Source: Broadcom press release).
Hitachi Vantara launched VSP One Block High End, an all-flash NVMe block array (Source: Hitachi press release).
NetApp introduced AFX, a disaggregated all-flash system for AI workloads (Source: NetApp newsroom).
Broadcom launched the Brocade G710 24-port 64G top-of-rack SAN switch (Source: Broadcom press release).
Full analysis
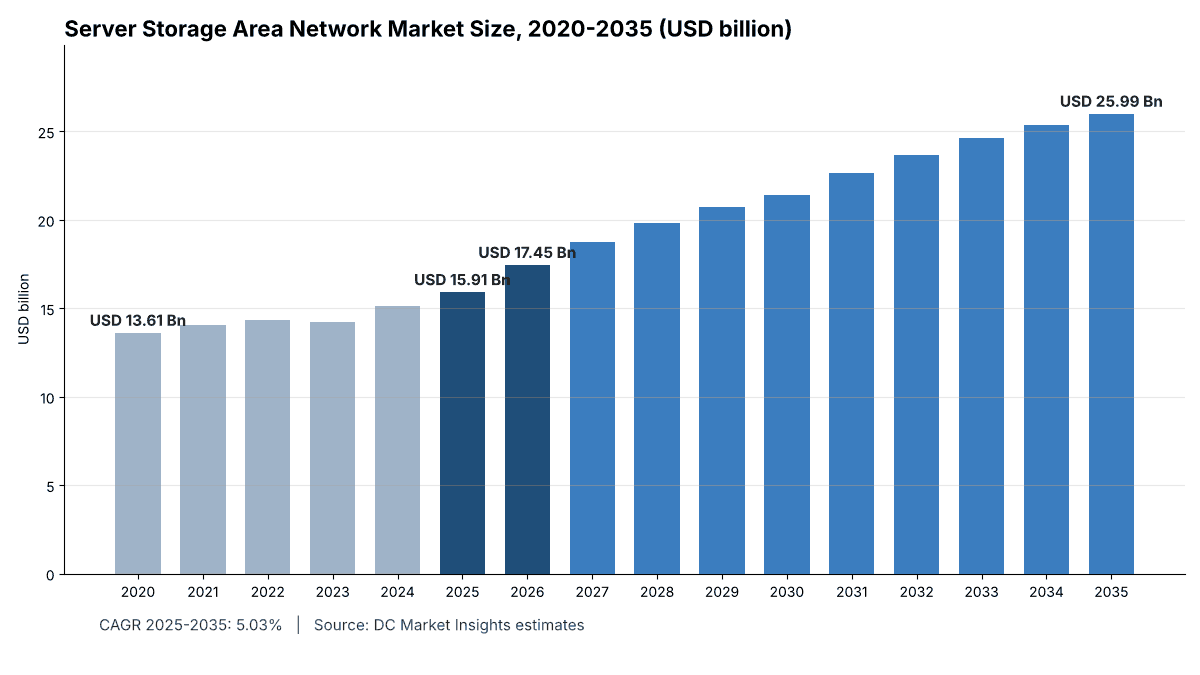
The Server Storage Area Network Market is valued at USD 17.45 billion in 2026 and is projected to reach USD 25.99 billion by 2035, up from USD 15.91 billion in 2025, a CAGR of 5.03% from 2025 to 2035 (DC Market Insights estimate). The market covers the networked block storage that servers in a data center reach over a dedicated storage area network (SAN): external block arrays, Fibre Channel (FC) switches and directors, host bus adapters (HBAs), and the SAN management software and support sold with them. The 2025 build receipt is 116,000 megawatts (MW) of installed IT capacity, of which 60,320 MW of enterprise, colocation and edge halls x USD 0.2526 million of SAN spend per MW a year = USD 15.24 billion, plus 55,680 MW of hyperscale and cloud halls x USD 0.0121 million per MW = USD 673.73 million, for a total of USD 15.91 billion. NVMe over Fabrics (NVMe-oF) is the fastest-growing segment at 16.20% a year because all-flash arrays need a lower-latency path than SCSI-based protocols, and the Middle East and Africa is the fastest-growing region at 7.77% a year as sovereign cloud and banking capacity is built in the Gulf. SAN is the block-storage slice of the Data Center Storage Market.
Key Market Statistics: How Big Is the Server Storage Area Network Market in 2026?
DC Market Insights values the Server Storage Area Network Market at USD 17.45 billion in 2026, 9.67% above the USD 15.91 billion of 2025, as all-flash refresh and new colocation halls lift block storage spend.
- Market size 2025: USD 15.91 billion
- Market size 2026: USD 17.45 billion
- Market size 2030: USD 21.41 billion
- Market size 2035: USD 25.99 billion
- CAGR 2025-2035: 5.03% (low case 3.91%, high case 6.02%)
- Largest component: Storage Arrays, 74.63% of 2025 revenue
- Fastest segment: NVMe over Fabrics, 16.20% a year
- Largest protocol: Fibre Channel, 58.34% of 2025 revenue
- Fastest buyer type: Hyperscale and Cloud, 15.38% a year
- Leading region: North America, 38.66% of 2025 revenue
- Fastest-growing region: Middle East and Africa, 4.43% of 2025 revenue, growing 7.77% a year
- Largest country: United States, 34.46% of 2025 revenue
- Market leader: Dell Technologies, about 21% of 2025 revenue (DC Market Insights assessment)
Executive Summary: How Did SAN Spending Recover After 2023?
Data center operators spent USD 15.91 billion on SAN storage, fabric and adapters in 2025. The Global Server Storage Area Network Market size was valued at USD 13.61 billion in 2020, reached USD 15.91 billion in 2025, and is anticipated to reach USD 25.99 billion by 2035, at a CAGR of 5.03% during the forecast period. Between 2020 and 2025 the market grew only 3.17% a year because spending dipped in 2023, when enterprises paused storage orders and used up capacity bought in 2021 and 2022.
| Report attribute | Details |
|---|---|
| Historical Period | 2020-2024 |
| Base Year | 2025 |
| Forecast Period | 2026-2035 |
| Server Storage Area Network Market Size 2025 | USD 15.91 billion |
| Server Storage Area Network Market Size 2026 | USD 17.45 billion |
| Server Storage Area Network Market CAGR (2025-2035) | 5.03% |
| Server Storage Area Network Market Size 2035 | USD 25.99 billion |
Growth after 2025 is faster than in 2020-2025 for two reasons. First, the installed base of enterprise and colocation capacity keeps growing from 60,320 MW to about 113,170 MW by 2035 even as hyperscale halls take most new power. Second, a hardware refresh cycle has begun: Dell Technologies reported fiscal 2026 storage revenue of USD 16.63 billion against USD 16.46 billion a year earlier, while Everpure (formerly Pure Storage) grew revenue 16% to about USD 3.66 billion (Source: Dell fourth-quarter fiscal 2026 results, SEC filing; Everpure fiscal 2026 results). Spend per MW still falls, from USD 0.2526 million to USD 0.2048 million a year for each enterprise MW, because the price of flash per terabyte keeps dropping.
Key takeaways:
- USD 15.91 billion in 2025, USD 17.45 billion in 2026 and USD 25.99 billion by 2035, a 5.03% CAGR.
- Storage Arrays take 74.63% of revenue; switches, directors and HBAs make up most of the rest.
- Fibre Channel still carries 58.34% of SAN revenue, but its share falls to 44.71% by 2035 as NVMe over Fabrics grows 16.20% a year.
- All-flash arrays rise from 61.47% to 79.36% of revenue by 2035.
- North America leads with 38.66%; the Middle East and Africa grows fastest at 7.77%.
Market Scope: What Counts as a Server Storage Area Network?
The Server Storage Area Network Market is the annual revenue from block storage networks that connect data center servers to shared storage, USD 15.91 billion in 2025 across about 116,000 MW of installed IT capacity (DC Market Insights estimate).
Included. External block storage arrays (all-flash, hybrid flash and hard disk drive (HDD) arrays) sold with Fibre Channel, Internet Small Computer Systems Interface (iSCSI) or NVMe over Fabrics front ends; unified arrays for the share of capacity served as block; Fibre Channel switches and directors; Fibre Channel and NVMe HBAs and converged adapters; array operating software, replication, multipathing and SAN fabric management software; and vendor support contracts for the above.
Excluded. Network-attached storage (NAS) and scale-out file systems, object storage, direct-attached storage inside servers, software-defined storage running on standard servers, tape libraries, backup appliances, general Ethernet switches used for iSCSI traffic, cloud block-storage services billed by the hour, and installation labor.
Related technologies. Fibre Channel over Ethernet (FCoE) traffic is counted under iSCSI and Ethernet Block, and InfiniBand-attached block storage, mostly in high-performance computing, under NVMe over Fabrics. Hyperconverged and software-defined server SANs, which pool drives inside servers instead of using an external array, are excluded because their spend is counted as servers and software.
How the segments fit together. Every split in this report sums to the same total: four components, three interconnect protocols, three array media types, four data center types, seven end-use industries and five regions. Storage Arrays are USD 11.87 billion in 2025. Flash media inside the arrays is sized separately in the All Flash Data Center Market report.
Why Do Server Storage Area Network Market Estimates Differ?
DC Market Insights values the Server Storage Area Network Market at USD 17.45 billion in 2026; published estimates differ mainly because some count all external storage, including file and object systems, while this report counts only block storage networks.
| Element | In this report | Why |
|---|---|---|
| Block arrays on FC, iSCSI or NVMe-oF | Yes | The core of a SAN |
| FC switches, directors and HBAs | Yes | The SAN fabric |
| Array software and support | Yes | Sold with the array, counted at vendor revenue |
| NAS, scale-out file and object storage | No | File and object access, not block |
| Server-internal SSDs and HDDs | No | Direct-attached, no network |
| Storage outside data centers (branch offices, PCs) | No | Not data center demand |
Market Drivers: What Drives SAN Refresh in Data Centers?
Three drivers lift the Server Storage Area Network Market from USD 15.91 billion in 2025 to USD 25.99 billion by 2035: a growing enterprise and colocation installed base, the move to all-flash NVMe arrays, and stricter rules on operational resilience.
A larger enterprise and colocation installed base
Data centers used about 415 terawatt-hours (TWh) of electricity in 2024, around 1.5% of world consumption, and the International Energy Agency (IEA) expects that to more than double to about 945 TWh by 2030 (Source: IEA Energy and AI, April 2025). Most of that new power goes to hyperscale and artificial intelligence (AI) halls, which rarely use a classic SAN, but the enterprise, colocation and edge share of installed capacity still grows from 60,320 MW in 2025 to about 87,000 MW in 2030. Each of those MW carries databases, virtual machines and enterprise resource planning (ERP) systems that run on shared block storage. That base generates a 2025 spend of USD 15.24 billion.
All-flash and NVMe arrays replace older hybrid systems
NetApp reported a record all-flash array annualized net revenue run rate of USD 4.1 billion at the end of fiscal 2025, up 14% (Source: NetApp fiscal 2025 results, May 2025), and a record quarterly all-flash revenue of USD 1.2 billion in the fourth quarter of fiscal 2026 (Source: NetApp fiscal 2026 results, May 2026). Hitachi Vantara launched VSP One Block High End, an all-flash NVMe block array, in November 2025 (Source: Hitachi press release, November 2025). All-Flash Arrays grow 7.75% a year to 2035 while HDD Arrays shrink 4.04% a year.
Resilience and data protection rules
The EU Digital Operational Resilience Act (DORA), Regulation (EU) 2022/2554, applies from 17 January 2025 and sets information and communication technology (ICT) risk rules for banks, insurers and other financial entities (Source: Malta Financial Services Authority, January 2023). Synchronous replication between two SAN arrays is the standard way to meet tight recovery targets, which keeps banking, financial services and insurance (BFSI) the largest end-use industry at 27.38% of 2025 revenue.
Market Trends: How Is the SAN Fabric Changing?
Three trends reshape the server storage area network: 128G Fibre Channel, NVMe over Fabrics on Ethernet, and AI features built into arrays.
Gen 8 Fibre Channel at 128G
The Fibre Channel Physical Interface standard FC-PI-8 for 128GFC was completed by the end of 2023, and the Fibre Channel Industry Association (FCIA) expected 128GFC products on the market by the end of 2025 (Source: FCIA, December 2024). Broadcom introduced the Brocade X8 directors and G820 switch, which it called the first 128G Fibre Channel platforms, in November 2025 (Source: Broadcom press release, November 2025). Fibre Channel revenue still grows 2.27% a year because banks and governments refresh directors rather than move off FC.
NVMe over Fabrics on Ethernet and FC
With the NVMe 2.0 specifications of 2021, the NVMe-oF specification was merged into the base NVMe specification, so one command set now runs over Fibre Channel, remote direct memory access (RDMA) and TCP (Source: NVM Express, December 2022). NVMe over Fabrics grows from 11.09% of SAN revenue in 2025 to 30.46% by 2035, the fastest segment in this report.
Autonomous and AI-ready block arrays
IBM launched the FlashSystem 5600, 7600 and 9600 in February 2026, claiming up to 40% greater data efficiency than the previous generation (Source: IBM newsroom, February 2026). Dell launched PowerStore Elite at Dell Technologies World in May 2026 (Source: Dell investor relations, May 2026). SAN Management Software and Services grow 7.17% a year, faster than hardware, as these features are sold as subscriptions.
Market Challenges: What Holds the Server Storage Area Network Market Back?
Two challenges limit server SAN market growth: hyperscale clouds that avoid classic SANs, and the falling price of flash per terabyte.
Cloud and hyperscale use other architectures
Hyperscale and cloud halls hold 48% of installed IT capacity in 2025 and about 64% by 2035, yet they buy little SAN equipment: a 2025 spend of USD 12,100 per MW a year against USD 252,600 per MW in enterprise halls. These are DC Market Insights estimates. Dell Technologies grew total Infrastructure Solutions Group revenue 40% in fiscal 2026 while its storage line grew only 1%, because AI servers took most of the new budget (Source: Dell fiscal 2026 results). Enterprise SAN spend grows only 2.73% a year.
Flash price per terabyte keeps falling
An HPE Modular Smart Array (MSA) 2070 all-flash Fibre Channel array with 46 terabytes (TB) of raw capacity lists at USD 15,152 at a US reseller (Source: US reseller listing, October 2026), about USD 330 per TB. Lower prices let buyers get more capacity for the same budget, so spend per enterprise MW falls from USD 252,600 a year in 2025 to USD 204,800 by 2035 in the DC Market Insights model. Hybrid Flash Arrays shrink 0.33% a year.
Market Opportunities: Where Are the New SAN Revenue Pools?
The two largest new revenue pools in the server storage area network market are NVMe over Fabrics, which reaches 30.46% of server SAN revenue by 2035, and colocation SANs, which roughly double over the decade.
End-to-end NVMe block storage
NVMe over Fabrics rises from 11.09% of server SAN revenue in 2025 to 30.46% by 2035, the largest share gain of any segment. Vendors that ship end-to-end NVMe arrays with 64G or 128G FC and 100 gigabit Ethernet (GbE) ports gain most. Not-AND (NAND) flash supply for these arrays is covered in the NAND Flash and Enterprise SSD Market report.
Colocation and private cloud SANs
Colocation SAN spend doubles from a 2025 base of USD 4.16 billion to USD 8.15 billion, a 6.94% CAGR, as enterprises move racks out of their own buildings but keep shared block storage for regulated data. Storage-as-a-service contracts, where the vendor owns the array and bills per TB, fit this buyer best.
Pricing: How Much Does a SAN Cost per MW?
For a server storage area network, an enterprise data center spends about USD 0.2526 million per MW of installed IT capacity a year on SAN arrays, fabric and support in 2025, against USD 0.0121 million per hyperscale MW (DC Market Insights estimate).
| Year | Enterprise, colocation and edge (USD million per MW a year) | Hyperscale and cloud (USD million per MW a year) |
|---|---|---|
| 2020 | 0.3053 | 0.0100 |
| 2025 | 0.2526 | 0.0121 |
| 2030 | 0.2281 | 0.0131 |
| 2035 | 0.2048 | 0.0140 |
Public price anchors:
- An Emulex LPe35002 dual-port 32G Fibre Channel HBA lists at USD 1,998 (Source: SHI reseller listing, October 2026).
- A Brocade G720 24-port 64G Fibre Channel switch lists at USD 28,079.99 (Source: US reseller listing, October 2026).
- An HPE MSA 2070 all-flash array with two 32G FC controllers and 46 TB lists at USD 15,152 (Source: US reseller listing, October 2026).
- A Lenovo ThinkSystem DE4000H hybrid controller enclosure with 16G FC lists at USD 33,440 (Source: SHI public sector listing, October 2026).
The model’s spend per MW values are DC Market Insights estimates; a dual-fabric SAN for one enterprise MW of about 110 racks typically needs two switches, a mid-range array and two HBAs per server.
Standards and Regulation: Which Rules Shape SAN Storage?
Three sets of rules shape server storage area network products and demand: Fibre Channel and NVMe standards, EU ecodesign rules for storage products, and financial resilience rules.
Interface standards. The InterNational Committee for Information Technology Standards (INCITS) T11 committee completed the Fibre Channel Physical Interface (FC-PI) standard FC-PI-7 for 64GFC in November 2018 and FC-PI-8 for 128GFC by the end of 2023 (Source: FCIA). Over 90% of Fibre Channel links use multimode fiber and vertical cavity surface emitting lasers (VCSELs) (Source: FCIA roadmap, August 2023).
EU ecodesign. Commission Regulation (EU) 2019/424 sets ecodesign requirements for servers and online data storage products, with power supply efficiency rules from 1 March 2020, a stricter tier from 1 January 2023, a secure data deletion function and firmware availability from 1 March 2021.
Resilience and energy reporting. DORA applies to EU financial entities from 17 January 2025, and Delegated Regulation (EU) 2024/1364 requires operators of data centers with at least 500 kilowatts (kW) of IT power to report energy data every year (Source: EUR-Lex, March 2024).
Market Segmentation: Which Segment Leads the Server Storage Area Network Market?
Storage Arrays lead the Server Storage Area Network Market with 74.63% of 2025 revenue, and NVMe over Fabrics is the fastest-growing segment at 16.20% a year to 2035 (DC Market Insights estimate).
By Component: Storage Arrays Lead with 74.63%
Arrays carry the controllers, flash and software, so they take most of every SAN budget.
| Component | 2025 (USD million) | Share 2025 | 2035 (USD million) | CAGR 2025-2035 |
|---|---|---|---|---|
| Storage Arrays | 11,874.05 | 74.63% | 19,732.40 | 5.21% |
| SAN Switches and Directors | 1,968.14 | 12.37% | 2,750.21 | 3.40% |
| SAN Management Software and Services | 1,228.30 | 7.72% | 2,453.88 | 7.17% |
| Host Bus Adapters | 840.08 | 5.28% | 1,057.97 | 2.33% |
By Interconnect Protocol: Fibre Channel Leads with 58.34%
Fibre Channel remains the default for mission-critical databases; NVMe over Fabrics gains share on both FC and Ethernet.
| Interconnect protocol | 2025 (USD million) | Share 2025 | 2035 (USD million) | CAGR 2025-2035 |
|---|---|---|---|---|
| Fibre Channel | 9,282.22 | 58.34% | 11,622.12 | 2.27% |
| iSCSI and Ethernet Block | 4,863.86 | 30.57% | 6,454.42 | 2.87% |
| NVMe over Fabrics | 1,764.48 | 11.09% | 7,917.91 | 16.20% |
By Array Media: All-Flash Arrays Lead with 61.47%
Flash has become the default for primary block storage; HDD arrays remain for low-cost secondary tiers.
| Array media | 2025 (USD million) | Share 2025 | 2035 (USD million) | CAGR 2025-2035 |
|---|---|---|---|---|
| All-Flash Arrays | 9,780.22 | 61.47% | 20,629.20 | 7.75% |
| Hybrid Flash Arrays | 4,276.76 | 26.88% | 4,138.32 | -0.33% |
| HDD Arrays | 1,853.58 | 11.65% | 1,226.94 | -4.04% |
By Data Center Type: Enterprise Leads with 62.41%
Enterprise-owned data centers still run most SANs, but colocation grows faster as racks move to third-party halls.
| Data center type | 2025 (USD million) | Share 2025 | 2035 (USD million) | CAGR 2025-2035 |
|---|---|---|---|---|
| Enterprise | 9,929.07 | 62.41% | 12,995.69 | 2.73% |
| Colocation | 4,163.79 | 26.17% | 8,146.66 | 6.94% |
| Edge | 1,143.97 | 7.19% | 2,035.37 | 5.93% |
| Hyperscale and Cloud | 673.73 | 4.23% | 2,816.74 | 15.38% |
By End-Use Industry: BFSI Leads with 27.38%
Banks and insurers buy SANs for core banking databases and replication; healthcare grows fastest as imaging and records systems expand.
| End-use industry | 2025 (USD million) | Share 2025 | 2035 (USD million) | CAGR 2025-2035 |
|---|---|---|---|---|
| BFSI | 4,356.31 | 27.38% | 6,535.01 | 4.14% |
| IT and Telecom | 3,121.65 | 19.62% | 5,684.99 | 6.18% |
| Government and Defense | 2,095.42 | 13.17% | 3,134.93 | 4.11% |
| Healthcare | 1,818.58 | 11.43% | 3,462.46 | 6.65% |
| Manufacturing | 1,632.42 | 10.26% | 2,784.01 | 5.48% |
| Others | 1,532.19 | 9.63% | 2,251.12 | 3.92% |
| Retail and E-commerce | 1,353.99 | 8.51% | 2,141.94 | 4.69% |
DC Exclusive: The SAN Spend per MW Model and Region x Component Matrix
The largest cell of the server storage area network market is North America Storage Arrays, USD 4.50 billion in 2025. This is a DC Market Insights model built from 16 inputs and tested against 3 bound checks, listed under Methodology.
The 16 inputs are installed IT MW for 2020, 2025, 2030 and 2035, the enterprise, colocation and edge share of installed MW for the same four years, four spend values per enterprise MW and four spend values per hyperscale MW. The table below shows the 2025 build.
| Hall type (2025) | Installed IT MW | SAN spend per MW a year | SAN spend 2025 |
|---|---|---|---|
| Enterprise, colocation and edge | 60,320 | USD 0.2526 million | USD 15,236.83 million |
| Hyperscale and cloud | 55,680 | USD 0.0121 million | USD 673.73 million |
| Total | 116,000 | USD 0.1372 million | USD 15,910.56 million |
The matrix below splits the 2025 market by region and component; rows and columns sum to the totals above.
| Region (USD million, 2025) | Storage Arrays | Switches and Directors | HBAs | Software and Services | Total |
|---|---|---|---|---|---|
| North America | 4,496.46 | 795.71 | 327.44 | 531.42 | 6,151.03 |
| Asia Pacific | 3,705.60 | 547.25 | 241.66 | 312.07 | 4,806.58 |
| Europe | 2,673.47 | 469.10 | 202.55 | 293.63 | 3,638.75 |
| Middle East and Africa | 536.41 | 84.28 | 36.42 | 47.73 | 704.84 |
| Latin America | 462.11 | 71.80 | 32.01 | 43.45 | 609.37 |
| Total | 11,874.05 | 1,968.14 | 840.08 | 1,228.30 | 15,910.57 |
Regional Insights: Which Region Leads the Server Storage Area Network Market?
North America leads the server storage area network market with 38.66% of 2025 revenue, and the fastest-growing region is the Middle East and Africa, which holds 4.43% and grows 7.77% a year to 2035 (DC Market Insights estimate).
| Region | 2025 (USD million) | Share 2025 | 2035 (USD million) | CAGR 2025-2035 |
|---|---|---|---|---|
| North America | 6,151.02 | 38.66% | 9,342.41 | 4.27% |
| Asia Pacific | 4,806.58 | 30.21% | 8,754.93 | 6.18% |
| Europe | 3,638.75 | 22.87% | 5,230.09 | 3.69% |
| Middle East and Africa | 704.84 | 4.43% | 1,489.48 | 7.77% |
| Latin America | 609.37 | 3.83% | 1,177.55 | 6.81% |
North America Leads with 38.66% Share
The United States is home to the largest SAN vendors and the biggest enterprise data center base. Dell, NetApp, Hewlett Packard Enterprise (HPE) and IBM all report most of their revenue there, and the region grows 4.27% a year as US banks and insurers refresh Fibre Channel directors to 64G and 128G.
Asia Pacific Holds 30.21% Share
Asia Pacific grows 6.18% a year, led by China, Japan, India and South Korea. China buys mostly from domestic vendors such as Huawei and Inspur, and India is the fastest-growing large country at 10.32% a year as banks and government agencies add data center capacity.
Europe Holds 22.87% Share
Europe grows 3.69% a year, the slowest region, because enterprise capacity moves to cloud faster than in other regions. DORA and EU ecodesign rules keep refresh spending steady in banking and government.
Middle East and Africa Holds 4.43% Share and Grows Fastest
The Middle East and Africa is the fastest-growing region at 7.77% a year because Saudi Arabia, the United Arab Emirates and Qatar require banking and government data to stay in the country, which favors on-premises and colocation SANs over foreign public cloud.
Latin America Holds 3.83% Share
Latin America grows 6.81% a year, led by Brazil and Mexico, where banks run large Fibre Channel estates and colocation operators expand in Sao Paulo and Queretaro.
Country Analysis: Which Countries Spend the Most on SAN Storage?
The United States leads the server storage area network market with 34.46% of 2025 revenue, and India is the fastest-growing country in the top 12 at 10.32% a year (DC Market Insights estimate). The 12 countries below hold 79.03% of 2025 revenue.
| Rank | Country | Region | 2025 (USD million) | Share 2025 | 2035 (USD million) | CAGR |
|---|---|---|---|---|---|---|
| 1 | United States | North America | 5,482.40 | 34.46% | 8,287.65 | 4.22% |
| 2 | China | Asia Pacific | 1,983.68 | 12.47% | 3,801.39 | 6.72% |
| 3 | Japan | Asia Pacific | 895.47 | 5.63% | 1,411.29 | 4.65% |
| 4 | Germany | Europe | 776.51 | 4.88% | 1,080.54 | 3.36% |
| 5 | United Kingdom | Europe | 721.20 | 4.53% | 1,011.50 | 3.44% |
| 6 | Canada | North America | 498.85 | 3.14% | 795.97 | 4.78% |
| 7 | France | Europe | 477.04 | 3.00% | 665.27 | 3.38% |
| 8 | India | Asia Pacific | 455.18 | 2.86% | 1,215.18 | 10.32% |
| 9 | Australia | Asia Pacific | 430.67 | 2.71% | 738.04 | 5.53% |
| 10 | South Korea | Asia Pacific | 412.40 | 2.59% | 715.28 | 5.66% |
| 11 | Brazil | Latin America | 265.81 | 1.67% | 502.93 | 6.58% |
| 12 | Saudi Arabia | Middle East and Africa | 174.73 | 1.10% | 429.42 | 9.41% |
Outside the top 12, Italy holds 2.17% of server storage area network revenue, Spain 1.58%, the Netherlands 1.46%, Mexico 1.12%, the United Arab Emirates 0.94%, Russia 0.68% and South Africa 0.61%. These shares are DC Market Insights estimates.
Forecast Scenarios: What Could Change the 2035 SAN Forecast?
The 2035 Server Storage Area Network Market ranges from USD 23.35 billion to USD 28.54 billion around a base case of USD 25.99 billion, depending on how fast enterprise capacity moves to public cloud.
| Scenario | Assumption from 2026 | 2035 value | CAGR 2025-2035 |
|---|---|---|---|
| Low | Enterprise and colocation MW growth and spend per MW 15% below base (faster cloud migration) | USD 23.35 billion | 3.91% |
| Base | Enterprise, colocation and edge share of installed MW falls from 52% to 36% | USD 25.99 billion | 5.03% |
| High | Enterprise and colocation MW growth and spend per MW 15% above base (sovereign and private AI on premises) | USD 28.54 billion | 6.02% |
Competitive Insights: Who Leads the Server Storage Area Network Market?
Dell Technologies leads the server storage area network market with about 21% of 2025 revenue, and the three largest suppliers (Dell Technologies, Huawei and NetApp) hold about 41% (DC Market Insights assessment).
- Dell Technologies (PowerMax, PowerStore, PowerVault)
- Huawei (OceanStor Dorado)
- NetApp (AFF, ASA)
- Hewlett Packard Enterprise (Alletra, MSA)
- Everpure, formerly Pure Storage (FlashArray)
- IBM (FlashSystem, DS8000)
- Hitachi Vantara (VSP One)
- Broadcom (Brocade switches, Emulex HBAs)
- Cisco (MDS switches)
- Marvell (QLogic HBAs)
- Lenovo (ThinkSystem DE and DM)
- Fujitsu (ETERNUS)
- Inspur
- Infinidat
- MacroSAN
Dell’s advantage is scale: its storage revenue was USD 16.63 billion in fiscal 2026 (Source: Dell results, February 2026), of which block arrays are the largest part. NetApp’s revenue reached USD 6.93 billion in fiscal 2026, up 5% (Source: NetApp fiscal 2026 results). Everpure’s fiscal 2026 revenue passed USD 3.6 billion with 16% growth (Source: Everpure fiscal 2026 results). In the fabric, Broadcom’s 10-K for fiscal 2025 describes its fibre channel host bus adapters and mission-critical FC SAN products (Source: Broadcom 10-K, December 2025).
Recent Developments
Recent server storage area network launches came from array and fabric vendors alike.
- In May 2026, Dell Technologies launched PowerStore Elite at Dell Technologies World (Source: Dell investor relations).
- In February 2026, IBM launched the FlashSystem 5600, 7600 and 9600 with up to 40% greater data efficiency (Source: IBM newsroom).
- In November 2025, Broadcom introduced the Brocade X8 directors and G820 switch, the first Gen 8 128G Fibre Channel platforms (Source: Broadcom press release).
- In November 2025, Hitachi Vantara launched VSP One Block High End, an all-flash NVMe block array (Source: Hitachi press release).
- In October 2025, NetApp introduced AFX, a disaggregated all-flash system for AI workloads (Source: NetApp newsroom).
- In January 2025, Broadcom launched the Brocade G710 24-port 64G top-of-rack SAN switch (Source: Broadcom press release).
More storage and IT equipment reports are listed under DC Market Insights industry reports; flash media is covered in the All Flash Data Center Market report and NAND supply in the NAND Flash and Enterprise SSD Market report.
Methodology: How We Built the Server Storage Area Network Market Model
The server storage area network model multiplies installed IT capacity by SAN spend per MW, separately for enterprise, colocation and edge halls and for hyperscale and cloud halls. Installed capacity is 70,500 MW in 2020, 116,000 MW in 2025, 207,091 MW in 2030 and 314,368 MW in 2035, in line with the DC Market Insights Capacity model. The enterprise, colocation and edge share of installed MW is 62% in 2020, 52% in 2025, 42% in 2030 and 36% in 2035. SAN spend per enterprise MW a year is USD 0.3053 million (2020), 0.2526 (2025), 0.2281 (2030) and 0.2048 (2035); per hyperscale MW it is 0.0100, 0.0121, 0.0131 and 0.0140. Segment shares are set for 2025 and 2035 and scaled so every split sums to the total.
Three bound checks:
- Ceiling 1: USD 15.91 billion is 2.74% of the USD 580 billion the world invests in data centers in 2025 (Source: IEA World Energy Outlook 2025).
- Ceiling 2: four vendors alone, Dell storage (USD 16.46 billion, fiscal 2025), NetApp (USD 6.57 billion), Pure Storage (USD 3.17 billion) and the HPE Hybrid Cloud segment (USD 5.75 billion), had combined revenue of USD 31.95 billion in fiscal years ending in 2025 including file, backup and services, so a block SAN market of USD 15.91 billion is well inside their total.
- Floor: Pure Storage’s fiscal 2025 revenue of USD 3.17 billion came almost entirely from flash arrays, and the model’s Storage Arrays segment of USD 11.87 billion is 3.7 times that one supplier.
Full approach: DC Market Insights research methodology. The analyst named on this page built the model, and the reviewer checked the arithmetic, the sources and the dates before publication.
Table of contents
- 01Introduction
- 1.1Market Definition and Scope
- 1.2Research Methodology
- 1.3Key Market Statistics
- 02Executive Summary
- 2.1Market Size 2020-2035
- 2.2Key Takeaways
- 03Market Scope and Estimate Comparison
- 3.1Included and Excluded
- 3.2Why Estimates Differ
- 04Market Dynamics
- 4.1Market Drivers
- 4.2Market Trends
- 4.3Market Challenges
- 4.4Market Opportunities
- 05Pricing Analysis
- 5.1SAN Spend per MW, 2020-2035
- 5.2Public Price Anchors
- 06Standards and Regulation
- 6.1Fibre Channel and NVMe Standards
- 6.2EU Ecodesign
- 6.3Resilience and Energy Reporting
- 07Market Segmentation
- 7.1By Component
- 7.2By Interconnect Protocol
- 7.3By Array Media
- 7.4By Data Center Type
- 7.5By End-Use Industry
- 08DC Exclusive
- 8.1SAN Spend per MW Model
- 8.2Region x Component Matrix
- 09Regional Insights
- 9.1North America
- 9.2Asia Pacific
- 9.3Europe
- 9.4Middle East and Africa
- 9.5Latin America
- 10Country Analysis
- 10.1Top 12 Countries
- 11Forecast Scenarios
- 11.1Low, Base and High Cases
- 12Competitive Landscape
- 12.1Company List
- 12.2Market Share and Advantages
- 13Recent Developments
- Fig. 1Server Storage Area Network Market Size, 2020-2035
- Table 1Report Attributes
- Table 2Scope Comparison
- Table 3SAN Spend per MW
- Table 4Segment Tables
- Table 5SAN Spend per MW Model
- Table 6Region x Component Matrix
- Table 7Regional Split
- Table 8Top 12 Countries
- Table 9Forecast Scenarios
About this report
Written by Amit Jain and reviewed by Deepti Agrawal, Senior Editor, Research. Figures are built top-down and bottom-up and reconciled before publication, with 2025 as the base year.
Read our methodologyHow we built this
- Historical period2020-2024
- Base year2025
- Forecast period2026-2035
- Sizing approachTop-down + bottom-up
Need more than the report?
Advisory on this market
Due diligence, site selection and market entry work, by the analysts who wrote this report.
See consulting servicesFrequently asked questions
USD 17.45 billion in 2026, up 9.67% from USD 15.91 billion in 2025, according to DC Market Insights estimates. The market is projected to reach USD 25.99 billion by 2035, a CAGR of 5.03% from 2025 to 2035.
USD 15.91 billion in 2025 and USD 25.99 billion by 2035 (DC Market Insights estimate), after USD 13.61 billion in 2020. The 2025 figure covers SAN arrays, Fibre Channel switches, HBAs and SAN software for 116,000 MW of installed IT capacity.
5.03% a year from 2025 to 2035 (DC Market Insights estimate), faster than the 3.17% of 2020-2025, when storage orders dipped in 2023 before an all-flash refresh began.
USD 15.91 billion of 2025 spending went on server storage area networks: dedicated networks that connect data center servers to shared block storage arrays over Fibre Channel, iSCSI or NVMe over Fabrics. NAS, object storage and server-internal drives are excluded.
74.63% of 2025 revenue goes to Storage Arrays, the leading component, because arrays carry the controllers, flash and software. SAN Switches and Directors, Host Bus Adapters and SAN Management Software and Services make up the rest (DC Market Insights estimate).
16.2% a year is the growth rate of NVMe over Fabrics, the fastest segment, rising from 11.09% of SAN revenue in 2025 to 30.46% by 2035 as all-flash arrays move off SCSI-based protocols (DC Market Insights estimate).
USD 1,998 buys a dual-port 32G Fibre Channel HBA, USD 28,079.99 a Brocade G720 24-port 64G switch and USD 15,152 an HPE MSA 2070 46 TB all-flash array at US resellers. DC Market Insights puts SAN spend at USD 0.2526 million per enterprise MW a year in 2025.
38.66% of 2025 revenue comes from North America, the leading region. The Middle East and Africa is the fastest-growing region at 7.77% a year because Gulf states require banking and government data to stay in the country (DC Market Insights estimate).
About 21% of 2025 revenue goes to Dell Technologies, the leader, and Dell, Huawei and NetApp together hold about 41% (DC Market Insights assessment). HPE, Everpure (formerly Pure Storage), IBM, Hitachi Vantara, Broadcom and Cisco follow.
58.34% of 2025 SAN revenue runs on Fibre Channel, the leading protocol, because banks and governments trust it for mission-critical databases. Its share falls to 44.71% by 2035 as NVMe over Fabrics grows (DC Market Insights estimate).
27.38% of 2025 revenue comes from banking, financial services and insurance (BFSI), the largest end-use industry, because core banking databases and synchronous replication run on SAN arrays (DC Market Insights estimate).
2023 was when the FC-PI-8 standard for 128GFC was completed, and Broadcom shipped the first 128G Fibre Channel directors and switches in November 2025. DC Market Insights expects banks and governments to refresh directors to 64G and 128G over the forecast period.
Licences, delivery and payment
Which licence should I choose?
Single User is a view-only PDF for one person. Multi User adds a printable PDF and the Excel data for unlimited users at one location. Enterprise covers your whole company and includes 100 free analyst hours.
How and when will I receive the report?
By email, within 24–48 business hours of payment, in the formats of your licence.
How can I pay?
Securely through PayPal: with a PayPal account, a debit or credit card, or PayPal Pay Later where available. Prices are in US dollars.
Can I see a sample first?
Yes. Request a free sample and we will email it to you.
Can the report be tailored to my needs?
Yes. We can add countries, segments or data cuts. Talk to an analyst about the scope you need.
Can I get an invoice or pay against a purchase order?
Write to sales@dcmarketinsights.com and our team will help.