
Optical Transceivers for AI Data Centers Market Size, Share & Forecast to 2035
Market at a glance
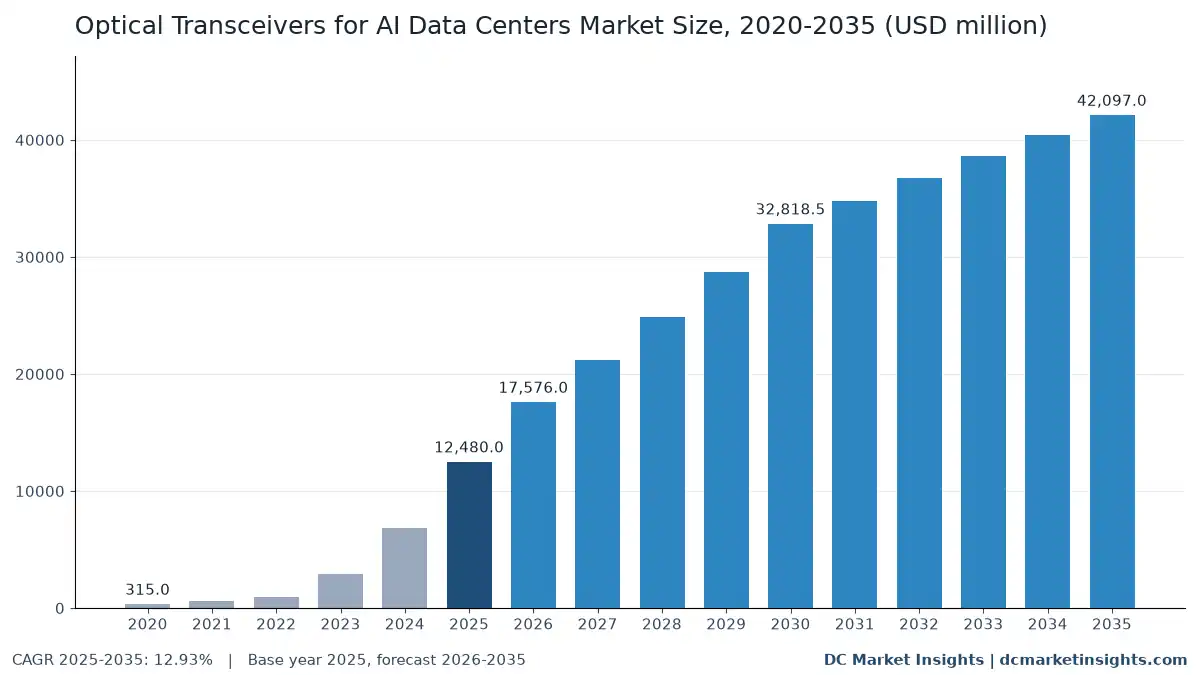
The Optical Transceivers for AI Data Centers market was worth USD 12.48 billion in 2025 and is forecast to reach USD 42.10 billion by 2035, growing at a 12.93% CAGR.
 By Amit Jain, Senior Consultant, ICT & Emerging Technologies
 Reviewed by Deepti Agrawal
Last updated 22 Oct 2026
Base year 2025 PDF + Excel
Key findings
NVIDIA Networking Revenue Up 142% to USD 31.38 Billion in Fiscal 2026
1.6T DR8 Modules Ship in Volume Before IEEE 802.3dj Is Final
Co-Packaged Optics Engines: USD 12.21 billion by 2035
What is inside the report
- 01Introduction
- 02Executive Summary
- 03Market Scope
- 04Why Market Estimates Differ
- 05Market Drivers
- 06Market Trends
- 07Market Challenges and Restraints
- 08Market Opportunities
- 09Pricing Analysis
- 10Standards and Trade Rules
- 19chapters
- 2020-2024Historical period
- 2026-2035Forecast period
- —Companies profiled
Segmentation
Full analysis
The Optical Transceivers for AI Data Centers Market is valued at USD 17.58 billion in 2026 and is projected to reach USD 42.10 billion by 2035, up from USD 12.48 billion in 2025, a CAGR of 12.93% from 2025 to 2035 (DC Market Insights estimate). Spending here is set by one ratio: how many optical modules an AI cluster needs for every graphics processing unit (GPU) or custom accelerator, because every GPU in a scale-out fabric carries its own 800 gigabit per second (800G) network port and every switch tier above it adds more links. NVIDIA’s networking revenue, which includes cable solutions with optical modules, rose 142% to USD 31.38 billion in fiscal 2026 (NVIDIA Form 10-K, February 2026), and Zhongji Innolight sold 21.09 million optical modules in 2025, 44.55% more than in 2024, with 90.58% of sales outside China (Zhongji Innolight 2025 annual report, March 2026). DC Market Insights builds the 2025 figure from 8.0 million AI accelerators shipped, 3.0 optical modules per accelerator and a blended price of USD 520 per module. Co-packaged optics (CPO) engines are the fastest technology at 47.55% a year, and the Middle East and Africa is the fastest region at 16.69% as Saudi Arabia and the United Arab Emirates (UAE) fill new AI campuses.
Key Market Statistics: How Big Is the Optical Transceivers for AI Data Centers Market in 2026?
DC Market Insights values the Optical Transceivers for AI Data Centers Market at USD 17.58 billion in 2026, 40.83% above 2025, because module shipments into AI clusters rise from 24.0 million to 33.8 million in one year.
- Market size 2025: USD 12.48 billion; 2026: USD 17.58 billion; 2030: USD 32.82 billion; 2035: USD 42.10 billion.
- CAGR 2025-2035: 12.93% in the base case; the 2035 range runs from USD 31.15 billion (low, 9.58%) to USD 52.20 billion (high, 15.38%).
- Volume: 24.0 million optical modules went into AI clusters in 2025, rising to 94.6 million by 2035 (DC Market Insights estimate).
- Largest data rate: 800G modules, USD 8.61 billion or 69.0% of 2025 value.
- Fastest data rate: 1.6T modules, 26.56% a year to USD 21.05 billion by 2035; 3.2T and above starts in 2028 and reaches USD 15.58 billion.
- Fastest technology: co-packaged optics engines, 47.55% a year to USD 12.21 billion by 2035.
- Leading region: North America, USD 7.41 billion or 59.4% of 2025 value; fastest region: the Middle East and Africa at 16.69%.
- Largest country: the United States, USD 6.84 billion in 2025; India is the fastest large country at 20.34% a year.
- Market leaders: Zhongji Innolight and Eoptolink together hold about 59% of 2025 value (DC Market Insights estimate).
Executive Summary: How Fast Is Spending on Optics for AI Clusters Growing?
The Global Optical Transceivers for AI Data Centers Market size was valued at USD 315.00 million in 2020, reached USD 12.48 billion in 2025, and is anticipated to reach USD 42.10 billion by 2035, at a CAGR of 12.93% during the forecast period.
| Attribute | Detail |
|---|---|
| Historical period | 2020-2024 |
| Base year | 2025 |
| Forecast period | 2026-2035 |
| Market size 2025 | USD 12.48 billion |
| Market size 2026 | USD 17.58 billion |
| CAGR 2025-2035 | 12.93% |
| Market size 2035 | USD 42.10 billion |
Growth was 108.73% a year from 2020 to 2025, when AI clusters moved from 100G and 200G ports to 400G and 800G and accelerator shipments rose from 0.7 million to 8.0 million. From 2025 the pace slows to 12.93% because the price per module drifts from USD 520 to USD 445 by 2035 while modules per accelerator rise from 3.0 to 4.3. Optics take about 3.2% of the USD 390.19 billion that DC Market Insights puts on the AI Data Center Market in 2025.
What Counts as an AI Data Center Optical Transceiver?
The market covers USD 12.48 billion of 2025 spending on optical links inside and between AI clusters: pluggable transceivers, active optical cables and co-packaged optical engines that carry GPU and accelerator traffic.
Included
Included are 400G, 800G, 1.6T and 3.2T pluggable modules in OSFP and QSFP-DD form factors with a digital signal processor (DSP); linear pluggable optics (LPO) and linear receive optics (LRO) without a full DSP; active optical cables (AOC); co-packaged optics engines and external laser sources mounted with switch chips; and coherent 800G-ZR modules that join AI buildings on one campus or across a metro (scale-across). Value is counted at the module maker’s selling price in the year the cluster is built.
Excluded
Excluded are modules for general cloud front-end networks outside AI clusters, telecom and 5G optics, passive fibre and connectors (counted in the Data Center Fiber Optic Cabling Connectivity Market), copper direct-attach cables, switches and network interface cards themselves, and photonic chips sold to module makers (counted in the Silicon Photonics Market).
How the Segments Fit Together
Each USD of the USD 12.48 billion total appears once in each of four splits: data rate, optics technology, network layer and end user. Regions and countries follow where the AI cluster is installed, not where the module is made.
Why Do Optical Transceivers for AI Data Centers Market Estimates Differ?
USD 17.58 billion in 2026 is the DC Market Insights value of optics inside AI clusters only; estimates for the same name that count every data-center transceiver, or add telecom optics, can be close to twice as large.
The Optical Transceiver Market is valued by DC Market Insights at USD 23.96 billion in 2025, so the AI cluster share is 52.1% of all optical transceiver spending. Broader definitions add cloud front-end networks of non-AI halls, telecom 5G fronthaul, metro and long-haul coherent modules, enterprise campus optics and, in some cases, optical components, laser chips and passive fibre. DC Market Insights counts optical modules and engines only where they connect AI accelerators, their storage and their campus links, and it includes co-packaged optics engines that a module-only count leaves out. Buyers in scope include hyperscale cloud providers, GPU cloud and neocloud operators, colocation tenants and enterprises running private AI clusters, and sovereign or research AI facilities.
| Element | In this estimate | Why |
|---|---|---|
| 800G and 1.6T modules in AI back-end fabrics | Yes, USD 8.99 billion in 2025 | Core spend per GPU |
| Front-end and storage optics of AI clusters | Yes, USD 2.50 billion in 2025 | Built and bought with the cluster |
| Co-packaged optics engines | Yes, USD 249.60 million in 2025 | Replace switch-side pluggables |
| Telecom, 5G and long-haul optics | No | Not AI data-center demand |
| Passive fibre, connectors and copper cables | No | Counted in cabling reports |
Market Drivers: Why Are AI Clusters Buying So Many Optical Modules?
Three dated events explain the 40.83% rise in 2026: a GPU vendor whose networking sales more than doubled, a hyperscaler cluster built from millions of optics, and 2026 capital budgets that rose again in October.
NVIDIA Networking Revenue Up 142% to USD 31.38 Billion in Fiscal 2026
NVIDIA reported networking revenue of USD 31.38 billion for the year to January 2026, against USD 12.99 billion a year earlier, and its Form 10-K lists cable solutions, including optical modules, in that business (NVIDIA Form 10-K, February 2026). The pace continued: Data Center networking reached USD 14.8 billion in the quarter to April 2026, up 199% (NVIDIA CFO commentary, May 2026). Every GB200 and GB300 rack sold into a scale-out fabric pulls one 800G module per GPU at the network interface and, in the DC Market Insights teardown below, 1.5 to 2.75 switch-side modules more.
Meta’s Prometheus Cluster Runs on “Millions of Optics”
Meta described its Prometheus supercluster in New Albany, Ohio, in October 2026 as hundreds of thousands of GPUs heading towards about 1 million, connected by 800G scale-out per GPU, 2x400G FR4 pluggables inside buildings and 800G-ZR coherent optics for links beyond about 10 kilometres (km) (Engineering at Meta, October 2026). At 3.0 modules per GPU, 1 million GPUs would need about 3.0 million modules, worth about USD 1.56 billion at 2025 prices (DC Market Insights estimate).
Alphabet, Amazon and Meta Set USD 135-200 Billion Each for 2026 Capital Spending
Alphabet raised its 2026 capital expenditure guidance to USD 180-190 billion (Alphabet, June 2026), Amazon expects about USD 200 billion (Amazon, February 2026) and Meta narrowed its range to USD 135-145 billion on 21 October 2026 (Meta Platforms, October 2026). The International Energy Agency (IEA) put big technology capital spending above USD 400 billion in 2025 with a further rise of about 75% in 2026 (IEA Key Questions on Energy and AI, April 2026); AI cluster optics equal about 3.1% of the 2025 figure.
Market Trends: How Are AI Data Center Optics Changing?
The 1.6T generation, lower-power linear modules and switch-mounted optics move USD 36.62 billion of 2035 value into ports faster than 800G.
1.6T DR8 Modules Ship in Volume Before IEEE 802.3dj Is Final
Zhongji Innolight says it was first to ship 1.6T DR8 OSFP224 modules with 8x200G optical lanes (Zhongji Innolight half-year report, August 2026), and Lumentum reported that its cloud module growth comes from 1.6T adoption (Lumentum, August 2026). The Institute of Electrical and Electronics Engineers (IEEE) 802.3dj standard for 200G per lane was still in sponsor ballot in July 2026 (IEEE 802.3, July 2026). DC Market Insights puts 1.6T at USD 2.00 billion in 2025 and USD 21.05 billion by 2035.
Linear Pluggable Optics Cut Module Power from 16 W to Under 9 W
Arista lists its 800G DSP-based modules at 16 watts (W) and its 800G LPO modules at under 9 W, a saving of about 45% per port (Arista optics data sheet, 2026). Zhongji Innolight offers LRO and LPO versions of its 800G modules (Zhongji Innolight, August 2026). LPO and LRO grow from USD 499.20 million in 2025 to USD 5.47 billion by 2035.
Co-Packaged Optics Switches Enter Production in May 2026
NVIDIA announced Quantum-X and Spectrum-X Photonics switches in March 2025 with 3.5 times the power efficiency of pluggable designs and 4 times fewer lasers, and said in May 2026 that Spectrum-X Ethernet Photonics was in production (NVIDIA, March 2025 and May 2026). DC Market Insights models CPO engines at 2.0% of 2025 value and 29.0% by 2035.
Market Challenges and Restraints: What Could Slow Spending on AI Cluster Optics?
Two restraints carry figures: a Chinese export rule on the metals inside lasers and photodetectors, and a supply base in which two Chinese makers carry about 59% of 2025 value.
Gallium and Germanium Export Ban Suspension Ends 27 November 2026
China’s Ministry of Commerce (MOFCOM) Announcement No. 46 of December 2024 denied licences for gallium, germanium and antimony exports to the United States, and Announcement No. 72 of November 2025 suspended that clause only until 27 November 2026 (MOFCOM, via the Hong Kong Trade and Industry Department). Coherent’s annual report names China’s 2024 germanium restrictions as a supply-chain disruption (Coherent Form 10-K, August 2026). Indium phosphide lasers and germanium photodetectors sit in most 800G and 1.6T single-mode modules.
Two Suppliers and One Tariff Ruling Hold the Cost Base
Zhongji Innolight’s 2025 module revenue of RMB 37.46 billion and Eoptolink’s revenue of RMB 24.84 billion equal about USD 8.68 billion at RMB 7.18 per USD, or 69.5% of the 2025 market. After the United States (US) Supreme Court struck down tariffs under the International Emergency Economic Powers Act (IEEPA) in February 2026, the Administration said it would replace them under other laws such as Section 301 (Fabrinet Form 10-K and Applied Optoelectronics Form 10-Q, August 2026), so landed module prices remain uncertain for 2027.
Market Opportunities: Where Will New Optics Revenue Come From?
Two pools add USD 15.29 billion of new annual value between 2025 and 2035.
Co-Packaged Optics Engines: USD 12.21 billion by 2035
Switch-mounted engines grow from USD 249.60 million in 2025 to USD 12.21 billion by 2035 as 102.4 terabit per second (Tbps) switches move optics onto the package. Marvell bought Celestial AI for its Photonic Fabric optical interconnect and expects a USD 1 billion annual run rate by the fourth quarter of fiscal 2029 (Marvell, February 2026).
Scale-Across Links Between AI Buildings: USD 4.21 billion by 2035
Campus and metro links that join AI halls grow from USD 873.60 million to USD 4.21 billion, at 17.03% a year. Meta runs 800G-ZR coherent optics between Prometheus buildings that sit 2 km to more than 100 km apart (Engineering at Meta, October 2026), and NVIDIA launched Spectrum-XGS Ethernet in August 2025 to tie distributed data centers into one cluster (NVIDIA, August 2025).
Pricing Analysis: How Much Do AI Data Center Optical Modules Cost?
A blended AI cluster module sold for about USD 520 in 2025, and optics cost about USD 1,560 per AI accelerator (DC Market Insights estimates).
| Year | Blended price per module | Modules per accelerator | Optics value per accelerator | Accelerators shipped |
|---|---|---|---|---|
| 2020 | USD 300 | 1.50 | USD 450 | 0.7 million |
| 2025 | USD 520 | 3.00 | USD 1,560 | 8.0 million |
| 2026 | USD 520 | 3.25 | USD 1,690 | 10.4 million |
| 2030 | USD 510 | 3.90 | USD 1,989 | 16.5 million |
| 2035 | USD 445 | 4.30 | USD 1,914 | 22.0 million |
Public Price Anchors
Zhongji Innolight’s 2025 module revenue of RMB 37.46 billion over 21.09 million modules sold gives about RMB 1,776 per module across all speeds, or about USD 247 (DC Market Insights calculation from the annual report). DC Market Insights prices an 800G module at USD 576 and a 1.6T module at USD 1,163 in 2025 in its Optical Transceiver Market model; the AI blend of USD 520 sits between 400G and 800G prices because 400G modules and AOC links pull it down.
Which Standards and Trade Rules Apply to AI Data Center Optics?
Four interface standards and three trade measures shape about USD 17.58 billion of 2026 purchases.
- IEEE 802.3df-2024: 400 Gb/s and 800 Gb/s Ethernet over 100G lanes, approved on 16 February 2024 (IEEE 802.3df Task Force).
- IEEE P802.3dj: 200G-per-lane Ethernet up to 1.6 Tb/s; the first sponsor recirculation closed 21 June 2026 and a project extension was requested in July 2026.
- OSFP Multi-Source Agreement (MSA): OSFP carries 1.6 Tb/s over 8x200G lanes; OSFP-XD with 16 lanes reaches 3.2 Tb/s (OSFP MSA, November 2025).
- LPO MSA: linear drive at 100G per lane, extending to 200G per lane.
- MOFCOM Announcements No. 46 (2024) and No. 72 (2025): gallium, germanium and antimony export ban to the US, suspended until 27 November 2026.
- US reciprocal tariff on Thailand: 19% under the October 2025 framework (Office of the United States Trade Representative), affected by the February 2026 IEEPA ruling.
- Section 301: the stated route for replacement duties (Applied Optoelectronics Form 10-Q, August 2026).
Market Segmentation: Which AI Optics Take the Most Spend?
800G modules, DSP-based pluggables, back-end fabrics and hyperscale buyers each lead their split in 2025, with 69.0%, 81.0%, 72.0% and 66.0% of value.
By Data Rate
800G modules hold USD 8.61 billion in 2025, but 1.6T takes the lead by 2028 and reaches USD 21.05 billion by 2035; 3.2T and above adds USD 15.58 billion once 400G-per-lane optics arrive.
| Data Rate | 2025 (USD million) | Share 2025 | 2035 (USD million) | CAGR 2025-2035 |
|---|---|---|---|---|
| 400G and Below | USD 1,872.00 million | 15.0% | USD 420.97 million | -13.86% |
| 800G | USD 8,611.20 million | 69.0% | USD 5,051.64 million | -5.19% |
| 1.6T | USD 1,996.80 million | 16.0% | USD 21,048.50 million | 26.56% |
| 3.2T and Above | USD 0.00 million | 0.0% | USD 15,575.89 million | new from 2028 |
By Optics Technology
DSP-based pluggables keep 50.0% of 2035 value, while CPO engines rise to USD 12.21 billion and LPO and LRO to USD 5.47 billion.
| Optics Technology | 2025 (USD million) | Share 2025 | 2035 (USD million) | CAGR 2025-2035 |
|---|---|---|---|---|
| DSP-Based Pluggable Transceivers | USD 10,108.80 million | 81.0% | USD 21,048.50 million | 7.61% |
| LPO and LRO Linear Optics | USD 499.20 million | 4.0% | USD 5,472.61 million | 27.06% |
| Active Optical Cables | USD 1,622.40 million | 13.0% | USD 3,367.76 million | 7.58% |
| Co-Packaged Optics Engines | USD 249.60 million | 2.0% | USD 12,208.13 million | 47.55% |
By Network Layer
Scale-up optical links, today almost all copper inside NVLink racks, grow at 48.05% a year to USD 6.31 billion by 2035 when rack-to-rack GPU domains need optics.
| Network Layer | 2025 (USD million) | Share 2025 | 2035 (USD million) | CAGR 2025-2035 |
|---|---|---|---|---|
| Scale-Out Back-End Fabric | USD 8,985.60 million | 72.0% | USD 25,258.20 million | 10.89% |
| Front-End and Storage Network | USD 2,496.00 million | 20.0% | USD 6,314.55 million | 9.73% |
| Scale-Up Optical Links | USD 124.80 million | 1.0% | USD 6,314.55 million | 48.05% |
| AI Campus and Scale-Across Interconnect | USD 873.60 million | 7.0% | USD 4,209.70 million | 17.03% |
By End User
Hyperscale cloud providers buy USD 8.24 billion in 2025; sovereign and research AI facilities grow fastest at 17.60% a year.
| End User | 2025 (USD million) | Share 2025 | 2035 (USD million) | CAGR 2025-2035 |
|---|---|---|---|---|
| Hyperscale Cloud Providers | USD 8,236.80 million | 66.0% | USD 24,416.26 million | 11.48% |
| GPU Cloud and Neocloud Providers | USD 2,496.00 million | 20.0% | USD 9,261.34 million | 14.01% |
| Colocation and Enterprise AI Deployments | USD 998.40 million | 8.0% | USD 4,630.67 million | 16.58% |
| Sovereign and Research AI Facilities | USD 748.80 million | 6.0% | USD 3,788.73 million | 17.60% |
DC Exclusive: AI Fabric Optics Bill of Materials, from 2.5 to 3.75 Modules per GPU
This DC Market Insights model counts the optical modules, power and 2025 value per GPU for four cluster designs, built on 6 inputs: a 64-port 800G switch, one 800G module at each GPU network port, twin-port 1.6T modules on switch ports, USD 576 per 800G and USD 1,163 per 1.6T module, 16 W per module (Arista and Lumentum data sheets) and the 3.5 times CPO efficiency stated by NVIDIA.
| Cluster design | Max GPUs | Modules per GPU | Optics power per GPU | Optics value per GPU, 2025 | Value per 100,000 GPUs |
|---|---|---|---|---|---|
| Two-tier 800G leaf-spine, 64-port switches | 2,048 | 2.50 | 40.0 W | USD 2,320 | USD 232.05 million |
| Three-tier 800G fat tree, 64-port switches | 65,536 | 3.50 | 56.0 W | USD 3,484 | USD 348.35 million |
| Three-tier fat tree, CPO switches on all tiers | 65,536 | 3.50 | 27.4 W | USD 3,484 | USD 348.35 million |
| Three-tier fat tree plus scale-across links between buildings | 65,536 | 3.75 | 60.0 W | USD 3,774 | USD 377.43 million |
A third switch tier adds one module per GPU and USD 1,163 of value; a cluster of 100,000 GPUs on a three-tier fabric carries about USD 348.35 million of optics. CPO keeps the port count (value shown as pluggable equivalent) but cuts optics power per GPU from 56.0 W to 27.4 W, which is why DC Market Insights shifts value from pluggables to engines after 2027 rather than removing it. The market model uses 3.0 modules per accelerator in 2025, below the three-tier design, because custom accelerator pods such as Google’s Ironwood join 64-chip cubes with optical circuit switches and copper (Google Cloud, November 2025).
Regional Insights: Where Are AI Data Center Optics Installed?
North America installs 59.4% of 2025 value, USD 7.41 billion, and the Middle East and Africa grows fastest at 16.69% a year to USD 2.86 billion by 2035.
North America
USD 7.41 billion in 2025, rising to USD 23.15 billion by 2035 at 12.06%. The IEA puts the United States at 45% of global data-centre electricity in 2024 and adds about 240 terawatt-hours (TWh) by 2030 (IEA Energy and AI, April 2025); Microsoft’s Fairwater site in Wisconsin runs hundreds of thousands of GB200 GPUs on an 800 Gbps fat tree (Microsoft, September 2025).
Asia Pacific
USD 3.07 billion in 2025 and USD 10.78 billion by 2035, at 13.38%. South Korea plans more than 250,000 NVIDIA GPUs across sovereign clouds and AI factories (NVIDIA, October 2025), and India grew its subsidised IndiaAI compute pool from a 10,000 target to 38,000 GPUs (Press Information Bureau, December 2025).
Europe
USD 1.15 billion in 2025, rising to USD 4.21 billion at 13.87%. The IEA expects European data-centre electricity use to rise by more than 45 TWh, or about 70%, by 2030 (IEA, April 2025).
Middle East and Africa
USD 611.52 million in 2025 and USD 2.86 billion by 2035, the fastest rate at 16.69%. The first 200 megawatt (MW) cluster of Stargate UAE goes live in 2026 inside a 5 gigawatt (GW) campus (G42, May 2025), and HUMAIN in Saudi Arabia starts with 18,000 GB300 GPUs on InfiniBand (NVIDIA, May 2025).
Latin America
USD 237.12 million in 2025, rising to USD 1.09 billion at 16.53%, as GPU cloud capacity in Brazil and Mexico moves from single racks to small 800G clusters (DC Market Insights estimate).
Which Countries Spend Most on AI Data Center Optics?
The United States leads with USD 6.84 billion in 2025, 54.8% of value, and India grows fastest among the top 12 at 20.34% a year.
| Rank | Country | Region | 2025 (USD million) | 2035 (USD million) | CAGR 2025-2035 |
|---|---|---|---|---|---|
| 1 | United States | North America | USD 6,839.04 million | USD 21,216.89 million | 11.99% |
| 2 | China | Asia Pacific | USD 1,385.28 million | USD 3,788.73 million | 10.58% |
| 3 | Canada | North America | USD 574.08 million | USD 1,936.46 million | 12.93% |
| 4 | Japan | Asia Pacific | USD 436.80 million | USD 1,431.30 million | 12.60% |
| 5 | South Korea | Asia Pacific | USD 287.04 million | USD 1,052.42 million | 13.87% |
| 6 | United Kingdom | Europe | USD 287.04 million | USD 968.23 million | 12.93% |
| 7 | India | Asia Pacific | USD 224.64 million | USD 1,431.30 million | 20.34% |
| 8 | Saudi Arabia | Middle East and Africa | USD 224.64 million | USD 1,094.52 million | 17.16% |
| 9 | Germany | Europe | USD 224.64 million | USD 799.84 million | 13.54% |
| 10 | United Arab Emirates | Middle East and Africa | USD 199.68 million | USD 968.23 million | 17.10% |
| 11 | Australia | Asia Pacific | USD 187.20 million | USD 673.55 million | 13.66% |
| 12 | France | Europe | USD 162.24 million | USD 631.45 million | 14.56% |
China ranks second but grows a slower 10.58% because export controls cap its high-end GPU imports; the Chinese government counted 780,000 petaflops of intelligent computing capacity in August 2025 (State Council of China, August 2025).
Forecast Scenarios: How Large Could the Market Be by 2035?
The 2035 value ranges from USD 31.15 billion to USD 52.20 billion, with a base case of USD 42.10 billion.
| Scenario | 2035 (USD million) | CAGR 2025-2035 | Assumption |
|---|---|---|---|
| Low | USD 31,151.78 million | 9.58% | Accelerator shipments flatten after 2028 and CPO takes switch value at lower prices |
| Base | USD 42,097.00 million | 12.93% | 22 million accelerators, 4.3 modules each, USD 445 per module |
| High | USD 52,200.28 million | 15.38% | Optical scale-up links reach most racks by 2032 and campus links double |
Who Are the Leading Optical Transceiver Suppliers for AI Data Centers?
Zhongji Innolight and Eoptolink hold about 59% of 2025 value together (DC Market Insights estimate, assuming 85% of their module revenue goes into AI clusters), and the next five suppliers share most of the rest.
- Zhongji Innolight
- Eoptolink Technology
- Coherent
- NVIDIA
- Lumentum
- Fabrinet
- Applied Optoelectronics
- Broadcom
- Marvell Technology
- Cisco Systems
- Accelink Technologies
- Source Photonics
- Hisense Broadband
- Arista Networks
Zhongji Innolight’s revenue rose 60.25% to RMB 38.24 billion in 2025 and 182.49% to RMB 41.78 billion in the first half of 2026 (Zhongji Innolight 2025 annual report, March 2026; half-year report, August 2026). Eoptolink’s 2025 revenue rose 187.29% to RMB 24.84 billion (Eoptolink, April 2026). Coherent’s Datacenter and Communications segment grew 40% to USD 5.28 billion in fiscal 2026, driven mainly by transceivers (Coherent Form 10-K, August 2026). Fabrinet, which assembles modules for several brands, earned USD 2.23 billion from data-center products in fiscal 2026, while NVIDIA’s share of its revenue fell from 35.1% to 16.3% in two years (Fabrinet Form 10-K, August 2026). Applied Optoelectronics’ data-center revenue rose 140.4% to USD 107.7 million in the second quarter of 2026 (Applied Optoelectronics Form 10-Q, August 2026).
What Has Changed Recently for AI Data Center Optics?
Six dated events since February 2026 moved prices, volumes or technology in this USD 17.58 billion market.
- In October 2026, Meta described Prometheus as a cluster of “millions of optics” with 800G-ZR links between buildings (Source: Engineering at Meta).
- In August 2026, Zhongji Innolight reported first-half revenue of RMB 41.78 billion, up 182.49% (Source: Zhongji Innolight half-year report).
- In August 2026, Coherent reported fiscal 2026 Datacenter and Communications revenue of USD 5.28 billion, up 40% (Source: Coherent Form 10-K).
- In May 2026, NVIDIA said Spectrum-X Ethernet Photonics switches with co-packaged optics were in production (Source: NVIDIA).
- In February 2026, Marvell completed the purchase of Celestial AI and its Photonic Fabric interconnect (Source: Marvell).
- In February 2026, the US Supreme Court struck down IEEPA tariffs, leaving duties on imported modules to other laws (Source: Fabrinet Form 10-K).
Key Takeaways
Four figures sum up the outlook for a market worth USD 17.58 billion in 2026.
- USD 17.58 billion in 2026, up 40.83%, because AI clusters add 9.8 million more modules than in 2025.
- USD 21.05 billion for 1.6T modules by 2035, because 200G-per-lane optics replace 800G in new fabrics from 2027.
- USD 12.21 billion for co-packaged optics engines by 2035, because they cut optics power per GPU by about half.
- USD 445 per module by 2035, down from USD 520, because CPO and LPO lower the cost per port.
Research Methodology: How Did DC Market Insights Size the AI Data Center Optics Market?
The model multiplies 8.0 million AI accelerators shipped in 2025 by 3.0 optical modules each and USD 520 per module, giving USD 12.48 billion.
Model Inputs
Accelerator shipments rise from 0.7 million in 2020 to 22 million in 2035; modules per accelerator from 1.5 to 4.3; blended price from USD 300 to USD 445 (USD 510 in 2030). Segment, regional and country shares are DC Market Insights estimates; regional shares follow AI accelerator installations, as in the AI Server BBU and AI Server Power Modules reports.
Bound Checks
- Ceiling 1: USD 12.48 billion is 52.1% of the USD 23.96 billion DC Market Insights Optical Transceiver Market in 2025.
- Ceiling 2: USD 12.48 billion is 3.2% of the USD 390.19 billion AI Data Center Market and 3.1% of the more than USD 400 billion of big technology capital spending in 2025 counted by the IEA.
- Floor: Zhongji Innolight module revenue and Eoptolink revenue of about USD 8.68 billion in 2025; at 85% AI exposure that is USD 7.38 billion, below the USD 12.48 billion total, leaving USD 5.10 billion for all other suppliers.
The full method is described on the DC Market Insights research methodology page.
Table of contents
- 01Introduction
- 1.1Report Description
- 1.2Key Market Statistics, 2025, 2026, 2030 and 2035
- 02Executive Summary
- 2.1Market Snapshot, 2025, 2026 and 2035
- 2.2Market Size Chart, 2020-2035
- 03Market Scope
- 3.1Included
- 3.2Excluded
- 3.3How the Segments Fit Together
- 04Why Market Estimates Differ
- 4.1Scope Table: In and Out of This Estimate
- 05Market Drivers
- 5.1NVIDIA Networking Revenue Up 142% to USD 31.38 Billion in Fiscal 2026
- 5.2Meta's Prometheus Cluster Runs on "Millions of Optics"
- 5.3Alphabet, Amazon and Meta Set USD 135-200 Billion Each for 2026 Capital Spending
- 06Market Trends
- 6.11.6T DR8 Modules Ship in Volume Before IEEE 802.3dj Is Final
- 6.2Linear Pluggable Optics Cut Module Power from 16 W to Under 9 W
- 6.3Co-Packaged Optics Switches Enter Production in May 2026
- 07Market Challenges and Restraints
- 7.1Gallium and Germanium Export Ban Suspension Ends 27 November 2026
- 7.2Two Suppliers and One Tariff Ruling Hold the Cost Base
- 08Market Opportunities
- 8.1Co-Packaged Optics Engines: USD 12.21 billion by 2035
- 8.2Scale-Across Links Between AI Buildings: USD 4.21 billion by 2035
- 09Pricing Analysis
- 9.1Public Price Anchors
- 9.2Price per Module and per Accelerator, 2020-2035
- 10Standards and Trade Rules
- 10.1IEEE 802.3df-2024
- 10.2IEEE P802.3dj
- 10.3OSFP Multi-Source Agreement
- 10.4LPO MSA
- 10.5MOFCOM Announcements No. 46 and No. 72
- 10.6US Reciprocal Tariff on Thailand
- 10.7Section 301
- 11Market Segmentation
- 11.1By Data Rate
- 11.2400G and Below
- 11.3800G
- 11.41.6T
- 11.53.2T and Above
- 11.6By Optics Technology
- 11.7DSP-Based Pluggable Transceivers
- 11.8LPO and LRO Linear Optics
- 11.9Active Optical Cables
- 11.10Co-Packaged Optics Engines
- 11.11By Network Layer
- 11.12Scale-Out Back-End Fabric
- 11.13Front-End and Storage Network
- 11.14Scale-Up Optical Links
- 11.15AI Campus and Scale-Across Interconnect
- 11.16By End User
- 11.17Hyperscale Cloud Providers
- 11.18GPU Cloud and Neocloud Providers
- 11.19Colocation and Enterprise AI Deployments
- 11.20Sovereign and Research AI Facilities
- 12DC Exclusive: AI Fabric Optics Bill of Materials
- 12.1Two-tier 800G leaf-spine, 64-port switches
- 12.2Three-tier 800G fat tree, 64-port switches
- 12.3Three-tier fat tree, CPO switches on all tiers
- 12.4Three-tier fat tree plus scale-across links between buildings
- 13Regional Insights
- 13.1North America
- 13.2Asia Pacific
- 13.3Europe
- 13.4Middle East and Africa
- 13.5Latin America
- 14Country Analysis
- 14.1United States
- 14.2China
- 14.3Canada
- 14.4Japan
- 14.5South Korea
- 14.6United Kingdom
- 14.7India
- 14.8Saudi Arabia
- 14.9Germany
- 14.10United Arab Emirates
- 14.11Australia
- 14.12France
- 15Forecast Scenarios, 2035
- 15.1Low Scenario
- 15.2Base Scenario
- 15.3High Scenario
- 16Competitive Insights
- 16.1Zhongji Innolight
- 16.2Eoptolink Technology
- 16.3Coherent
- 16.4NVIDIA
- 16.5Lumentum
- 16.6Fabrinet
- 16.7Applied Optoelectronics
- 16.8Broadcom
- 16.9Marvell Technology
- 16.10Cisco Systems
- 16.11Accelink Technologies
- 16.12Source Photonics
- 16.13Hisense Broadband
- 16.14Arista Networks
- 17Recent Developments
- 17.1Meta Prometheus Optics, October 2026
- 17.2Zhongji Innolight First-Half Revenue, August 2026
- 17.3Coherent Fiscal 2026 Results, August 2026
- 17.4NVIDIA Spectrum-X Photonics in Production, May 2026
- 17.5Marvell Completes Celestial AI Purchase, February 2026
- 17.6US Supreme Court IEEPA Tariff Ruling, February 2026
- 18Key Takeaways
- 18.12026 Market Size
- 18.21.6T Modules by 2035
- 18.3Co-Packaged Optics Engines by 2035
- 18.4Price per Module by 2035
- 19Research Methodology
- 19.1Model Inputs
- 19.2Bound Checks
- Fig. 1Optical Transceivers for AI Data Centers Market Size, 2020-2035 (USD million)
- Table 1Market Snapshot, 2025, 2026 and 2035
- Table 2Scope Table: In and Out of This Estimate
- Table 3Price per Module and per Accelerator, 2020-2035
- Table 4Market by Data Rate, 2025 and 2035
- Table 5Market by Optics Technology, 2025 and 2035
- Table 6Market by Network Layer, 2025 and 2035
- Table 7Market by End User, 2025 and 2035
- Table 8AI Fabric Optics Bill of Materials
- Table 9Top 12 Countries, 2025 and 2035
- Table 102035 Forecast Scenarios
About this report
Written by Amit Jain and reviewed by Deepti Agrawal, Senior Editor, Research. Figures are built top-down and bottom-up and reconciled before publication, with 2025 as the base year.
Read our methodologyHow we built this
- Historical period2020-2024
- Base year2025
- Forecast period2026-2035
- Sizing approachTop-down + bottom-up
Need more than the report?
Advisory on this market
Due diligence, site selection and market entry work, by the analysts who wrote this report.
See consulting servicesFrequently asked questions
USD 17.58 billion in 2026, up 40.83% from USD 12.48 billion in 2025, according to DC Market Insights estimates. The market is projected to reach USD 42.10 billion by 2035, a CAGR of 12.93% from 2025.
12.93% a year from 2025 to 2035, after 108.73% a year from 2020 to 2025, because modules per accelerator rise from 3.0 to 4.3 while the blended price falls from USD 520 to USD 445.
About 2.5 modules per GPU in a two-tier 800G fabric and 3.5 in a three-tier fat tree, worth USD 2,320 to USD 3,484 per GPU at 2025 prices (DC Market Insights model).
DC Market Insights prices an 800G module at USD 576 and a 1.6T module at USD 1,163 in 2025. The blended AI cluster price is about USD 520 per module, falling to USD 445 by 2035.
1.6T modules, at 26.56% a year to USD 21.05 billion by 2035; 800G leads in 2025 with USD 8.61 billion, and 3.2T and above reaches USD 15.58 billion from 2028.
Partly: CPO engines grow 47.55% a year to USD 12.21 billion by 2035, 29.0% of value, while DSP-based pluggables keep USD 21.05 billion. NVIDIA put CPO switches into production in May 2026.
An 800G DSP module draws up to 16 W and an 800G LPO module under 9 W. In a three-tier fabric optics use about 56 W per GPU, falling to 27 W with CPO switches (DC Market Insights model).
North America, with USD 7.41 billion or 59.4% of 2025 value. The Middle East and Africa grows fastest at 16.69% a year, and India is the fastest large country at 20.34%.
Zhongji Innolight and Eoptolink hold about 59% of 2025 value together (DC Market Insights estimate). Innolight’s revenue rose 60.25% to RMB 38.24 billion in 2025; Coherent, Lumentum and NVIDIA follow.
USD 17.58 billion in 2026 counts optics inside AI clusters only. Estimates that add non-AI cloud networks, telecom and long-haul optics or passive fibre come out larger; all optical transceivers total USD 23.96 billion in 2025.
Licences, delivery and payment
Which licence should I choose?
Single User is a view-only PDF for one person. Multi User adds a printable PDF and the Excel data for unlimited users at one location. Enterprise covers your whole company and includes 100 free analyst hours.
How and when will I receive the report?
By email, within 24–48 business hours of payment, in the formats of your licence.
How can I pay?
Securely through PayPal: with a PayPal account, a debit or credit card, or PayPal Pay Later where available. Prices are in US dollars.
Can I see a sample first?
Yes. Request a free sample and we will email it to you.
Can the report be tailored to my needs?
Yes. We can add countries, segments or data cuts. Talk to an analyst about the scope you need.
Can I get an invoice or pay against a purchase order?
Write to sales@dcmarketinsights.com and our team will help.