
Silicon Photonics Market Size, Share & Forecast to 2035
Market at a glance
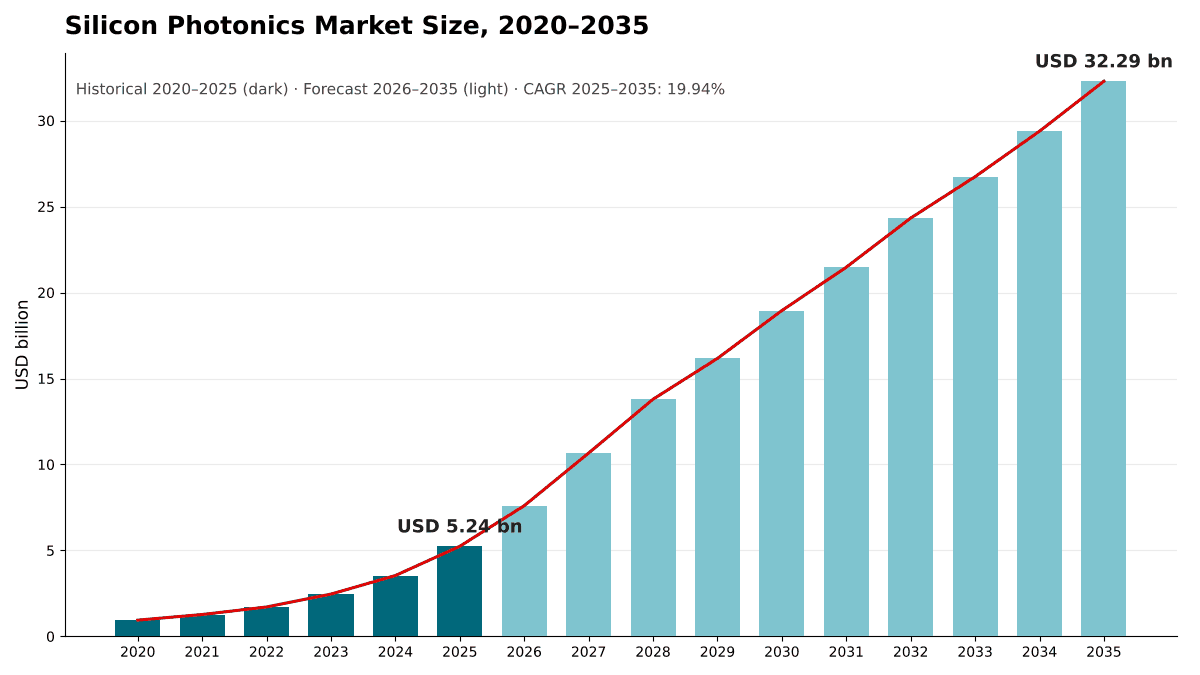
The Silicon Photonics market was worth USD 5,240.0 million in 2025 and is forecast to reach USD 32.29 billion by 2035, growing at a 19.94% CAGR. North America accounts for 49% of the market.
 By Amit Jain, Senior Consultant, ICT & Emerging Technologies
 Reviewed by Deepti Agrawal
Last updated 6 Oct 2026
Base year 2025 PDF + Excel
Reviewed by Deepti Agrawal
Last updated 6 Oct 2026
Base year 2025 PDF + Excel
Source: DC Market Insights analysis
Key findings
AI Back-End Networks Absorbed 4.63 Million 800G Silicon Photonics Transceivers in 2025
Co-Packaged Optics Moves from Sampling to Production
Transceiver Prices Fall About 10% a Year at 800G
Co-Packaged Optics and Optical I/O Add USD 15.94 Billion of New Revenue
What is inside the report
- 01Introduction
- 02Research Methodology
- 03Executive Summary
- 04Market Dynamics
- 05Pricing Analysis
- 06Standards and Regulation
- 07Supply Chain and Value Chain Analysis
- 08Global Silicon Photonics Market Size and Forecast
- 09Market by Product
- 10Market by Data Rate
- 21chapters
- 2020-2024Historical period
- 2026-2035Forecast period
- 15Companies profiled
Regional insights
- North America49%
- Asia Pacific32.4%
- Europe12.1%
- Middle East and Africa3.6%
- Latin America2.9%
Segmentation
Companies profiled
- Broadcom
- NVIDIA
- Coherent
- Lumentum
- Marvell Technology
- Zhongji InnoLight
- Eoptolink Technology
- TSMC
- GlobalFoundries
- Tower Semiconductor
- STMicroelectronics
- Ayar Labs
- Lightmatter
- Aeva
- PsiQuantum
Recent developments
NVIDIA announced its Spectrum-X Photonics and Quantum-X Photonics co-packaged optics switches, with Quantum-X expected later in 2025 and Spectrum-X in 2026 (Source: NVIDIA press release).
Broadcom began sampling Tomahawk 6 Davisson, a 102.4Tb/s switch with co-packaged optics, to early access customers and partners (Source: StorageNewsletter report).
GlobalFoundries acquired Advanced Micro Foundry, a silicon photonics company based in Singapore (Source: GlobalFoundries earnings release).
Marvell completed its acquisition of Celestial AI, adding Photonic Fabric optical interconnect technology for scale-up connectivity (Source: Marvell press release).
NVIDIA agreed to invest USD 2 billion each in Coherent and Lumentum, with multibillion-dollar purchase commitments for lasers and optical networking products (Source: Optica news report).
Tower Semiconductor announced a USD 3 billion expansion of silicon photonics and silicon germanium capacity in Japan, backed by roughly USD 1 billion in METI grants (Source: Tech Times report).
Full analysis
The Silicon Photonics Market covers optical devices whose light-guiding, modulating and detecting functions are built on silicon wafers with standard semiconductor processes: pluggable optical transceivers, active optical cables, co-packaged optics engines, optical input/output (I/O) chiplets, sensing and LiDAR chips and other silicon photonic devices, valued at first sale. DC Market Insights values the global Silicon Photonics Market at USD 5.24 billion in 2025 and forecasts USD 32.29 billion by 2035, a CAGR of 19.94%. The 2025 value is built from units and price: 15.55 million silicon photonics transceiver units at an average of about USD 302 per unit give USD 4.70 billion, and active optical cables, co-packaged optics, optical I/O chiplets, sensing chips and other devices add USD 542.20 million. Co-packaged optics is the fastest-growing segment at 63.51% a year because switch makers are moving the optics into the switch package to cut power, and the Middle East and Africa is the fastest-growing region at 22.37% a year as AI data center capacity in the Gulf is added from a small base.
Executive Summary
The Global Silicon Photonics Market size was valued at USD 945.90 million in 2020, reached USD 5.24 billion in 2025, and is anticipated to reach USD 32.29 billion by 2035, at a CAGR of 19.94% during the forecast period.
| Report attribute | Details |
|---|---|
| Historical Period | 2020-2024 |
| Base Year | 2025 |
| Forecast Period | 2026-2035 |
| Silicon Photonics Market Size 2025 | USD 5.24 Billion |
| Silicon Photonics Market, CAGR | 19.94% |
| Silicon Photonics Market Size 2035 | USD 32.29 Billion |
The market grew at 40.84% a year between 2020 and 2025, and 2025 alone added 48.0% over the USD 3.54 billion of 2024, which DC Market Insights attributes to 800G links for graphics processing unit (GPU) clusters moving onto silicon photonics. Foundry disclosures show the same step change: Tower Semiconductor reported that its silicon photonics (SiPho) revenue reached a USD 680 million annual run rate in the second quarter of 2026, up from USD 180 million a year earlier, and GlobalFoundries reported that it doubled its silicon photonics revenue in 2025 to more than USD 200 million. DC Market Insights forecasts USD 7.60 billion in 2026 and USD 18.95 billion in 2030.
Growth slows to 19.94% a year from 2025 to 2035 for two reasons. Prices per transceiver fall by 6% to 11% a year at each speed class, and from 2030 the volume of pluggable modules flattens as co-packaged optics and optical I/O chiplets take over the links closest to the switch and the accelerator. Those two newer formats account for 49.7% of the market by 2035, up from 2.2% in 2025.
Market Scope: What Does the Silicon Photonics Market Cover?
The Silicon Photonics Market covers finished devices and modules in which a silicon photonic integrated circuit (PIC) performs the main optical function, valued at first sale in current US dollars, with 2025 as the base year and forecasts to 2035. DC Market Insights sizes it at USD 5.24 billion in 2025.
Included. Pluggable optical transceivers built on silicon photonics at every data rate from 100G to 1.6T and above, including coherent modules for data center interconnect and telecom; silicon photonics active optical cables (AOC); co-packaged optics (CPO) engines and their external laser sources when sold as part of a CPO system; optical I/O chiplets that carry data off a processor package; silicon photonics LiDAR, biosensing and gas-sensing chips; and other silicon photonic devices such as photonic quantum computing chips and programmable photonic processors.
Excluded. Transceivers built on indium phosphide electro-absorption modulated lasers (EML) or vertical-cavity surface-emitting lasers (VCSEL) without a silicon PIC, standalone lasers sold separately to module makers, foundry wafer revenue (an input cost that is already inside device value), passive fiber cables and connectors, switch silicon and installation labor.
How the segments fit together. The product split covers the full USD 5.24 billion. The data-rate split covers only pluggable transceivers and active optical cables, worth USD 4.86 billion in 2025. The application split re-cuts the full market by end use, and the regional and country splits allocate it by the location where devices are deployed.
Market Drivers: What Drives the Silicon Photonics Market?
Three drivers explain most of the growth in the Silicon Photonics Market: AI back-end networks that need millions of 800G and 1.6T optical links a year, hyperscale capital spending plans above USD 700 billion for 2026, and foundry capacity that is being reserved years ahead of production.
AI Back-End Networks Absorbed 4.63 Million 800G Silicon Photonics Transceivers in 2025
GPUs in large training clusters connect to the back-end switch fabric through optical links, and at 800G and above, silicon photonics competes with indium phosphide designs. About 4.63 million 800G silicon photonics transceivers shipped in 2025 at about USD 517 each, a value of USD 2.39 billion and 45.7% of the whole market (DC Market Insights estimate). The next step is already visible: Tower Semiconductor described an extremely high adoption rate of SiPho for 1.6T transceivers when it announced additional capacity in February 2026. DC Market Insights forecasts 1.6T-and-above transceiver units to rise from about 0.25 million in 2025 to 12.0 million in 2030. The accelerator volumes behind these links are covered in the Data Center GPUs Market report.
Hyperscale Capital Spending Above USD 700 Billion Funds the Optics Build
The combined 2026 capital spending plans of the largest hyperscalers topped USD 700 billion, as reported in May 2026, and Meta alone raised its full-year 2026 guidance to USD 125 billion to USD 145 billion. DC Market Insights estimates that AI clusters carry several times more optical links per MW than conventional cloud halls. DC Market Insights estimates that data center and AI applications took 85.5% of the Silicon Photonics Market in 2025 and forecasts 92.8% by 2035.
Foundry Capacity Is Reserved Through 2028
Buyers now secure wafer capacity before they place module orders. Tower Semiconductor added USD 270 million of SiPho capital spending in February 2026, bringing its SiPho and silicon germanium plan to USD 920 million, targeting SiPho capacity of more than five times its fourth-quarter 2025 run rate, with more than 70% of that capacity reserved or in reservation through 2028 (Source: Converge Digest report). In May 2026 it reported contracts with USD 1.3 billion of silicon photonics revenue through 2027 from its largest customers, backed by USD 290 million of advances (Source: Jerusalem Post report). In its second-quarter 2026 results, Tower said it plans to cross a USD 1 billion SiPho annual run rate in the fourth quarter of 2026 (Source: Tower Semiconductor filing with the US Securities and Exchange Commission). GlobalFoundries targets a USD 1 billion silicon photonics run rate by the end of 2028.
Market Trends: How Is Silicon Photonics Technology Changing?
The Silicon Photonics Market is shifting from pluggable modules at the front panel toward optics inside the switch package and next to the processor, a move worth USD 15.94 billion of added annual revenue over the forecast period on DC Market Insights estimates.
Co-Packaged Optics Moves from Sampling to Production
Co-packaged optics place the optical engine on the same substrate as the switch chip, which removes the long electrical trace to the front panel. NVIDIA announced its Spectrum-X Photonics and Quantum-X Photonics switches in March 2025, claiming 3.5 times more power efficiency, with Spectrum-X configurations of 128 ports of 800Gb/s and 512 ports of 800Gb/s. Broadcom said in October 2025 that it was sampling Tomahawk 6 Davisson, which it described as the first switch with 102.4Tb/s of optically enabled switching capacity, with a 70% reduction in optical interconnect power. TSMC said in April 2026 that its Compact Universal Photonic Engine (COUPE) on substrate begins production in 2026 and achieves 2 times the power efficiency and 10 times lower latency than a pluggable version on the circuit board (Source: TSMC press release). Co-packaged optics were worth USD 86.70 million in 2025 and reach USD 11.84 billion by 2035 (DC Market Insights estimate).
Optical I/O Chiplets Target Scale-Up Links Inside the Rack
Optical I/O chiplets take the same idea into the processor package, replacing copper scale-up links between accelerators. Marvell completed its acquisition of Celestial AI in February 2026 and expects revenue from Celestial AI to reach a USD 500 million annualized run rate in the fourth quarter of fiscal 2028 and USD 1 billion by the fourth quarter of fiscal 2029. Ayar Labs raised USD 500 million at a USD 3.75 billion valuation in March 2026, and Lightmatter introduced its Passage M1000 with 114 Tbps of total optical bandwidth. Optical I/O chiplets were worth USD 31.20 million in 2025 and reach USD 4.22 billion by 2035 (DC Market Insights estimate).
Chipmakers Add Silicon Photonics Capacity
The supply base is widening beyond the established foundries. STMicroelectronics introduced its PIC100 silicon photonics technology in February 2025, developed with Amazon Web Services, on a 300 mm platform for 800G and 1.6T interconnects, to be manufactured in its fab in Crolles, France. GlobalFoundries acquired Advanced Micro Foundry (AMF), a dedicated silicon photonics company in Singapore, in November 2025.
Market Challenges: What Holds the Silicon Photonics Market Back?
Falling prices per unit and competition for laser and wafer capacity are the two constraints that DC Market Insights expects to shape the Silicon Photonics Market through 2028, while telecom demand grows only 2.02% a year.
Transceiver Prices Fall About 10% a Year at 800G
Each speed class follows a steep learning curve. DC Market Insights models the average price of an 800G silicon photonics transceiver falling from USD 517 in 2025 to USD 310 in 2030, a decline of 9.72% a year, and a 1.6T transceiver falling from USD 1,160 to USD 640, or 11.21% a year. 800G revenue therefore peaks in 2028 on DC Market Insights estimates.
Lasers and Wafer Capacity Are Reserved Years Ahead
A silicon photonics transceiver still needs an external laser, and the same suppliers serve pluggables and CPO. NVIDIA agreed in March 2026 to invest USD 2 billion each in Coherent and Lumentum, with multibillion-dollar purchase commitments and capacity access rights for advanced lasers and optical networking products. Lumentum’s chief executive cited increasing demand for ultra-high-power CPO lasers in its fiscal 2026 results. DC Market Insights expects smaller module makers without such agreements to face longer lead times.
Telecom Demand Grows Slowly
Telecom and 5G networks were worth USD 500.67 million of silicon photonics demand in 2025, 9.6% of the market, and grow only 2.02% a year to USD 611.70 million in 2035 (DC Market Insights estimate), as we expect operator spending to stay flat and coherent modules to move toward data center interconnect.
Market Opportunities: Where Are the New Revenue Pools?
The two largest new revenue pools in the Silicon Photonics Market are co-packaged optics and optical I/O chiplets, which together add USD 15.94 billion of annual revenue over the forecast period, and sensing and quantum devices, which together add USD 1.44 billion.
Co-Packaged Optics and Optical I/O Add USD 15.94 Billion of New Revenue
DC Market Insights forecasts co-packaged optics to grow at 63.51% a year and optical I/O chiplets at 63.33% a year. The cabling that connects these engines across the hall is covered in the Data Center Cables Market report.
Sensing, LiDAR and Quantum Devices Reach USD 1.71 Billion
Sensing and LiDAR chips were worth USD 118.60 million in 2025 and other silicon photonic devices, mainly quantum computing chips, USD 142.30 million. Aeva integrates all key LiDAR components onto a silicon photonics chip and announced plans in July 2025 to raise production capacity to up to 200,000 LiDAR units a year, while Daimler Truck North America provides additional non-recurring funding toward series production. PsiQuantum raised USD 1 billion at a USD 7 billion valuation in September 2025 and manufactures its Omega chipset at GlobalFoundries’ Fab 8 in Malta, New York. The two segments together reach USD 1.71 billion by 2035 (DC Market Insights estimate).
Pricing: How Much Does a Silicon Photonics Transceiver Cost?
A silicon photonics transceiver sold for a blended average of about USD 302 in 2025, from about USD 45 at 200G and below to about USD 1,447 for a coherent module. These are DC Market Insights estimates of the average first-sale price per unit.
| Average price per transceiver (USD) | 2025 | 2030 | 2035 |
|---|---|---|---|
| 200G and Below | 45 | 33 | 26 |
| 400G | 262 | 170 | 120 |
| 800G | 517 | 310 | 220 |
| 1.6T and Above | 1,160 | 640 | 428 |
| Coherent | 1,447 | 950 | 700 |
| Blended average | 302 | 412 | 374 |
The blended average rises to 2030 even though every class gets cheaper, because the mix moves from 400G toward 1.6T. After 2030 the blended price falls again as 1.6T-and-above modules follow their own price curve. Units rise from 15.55 million in 2025 to 30.75 million in 2030 and 37.42 million in 2035.
Standards and Regulation: Which Rules Shape Silicon Photonics?
Three sets of rules shape the Silicon Photonics Market: the Ethernet speed standards of the Institute of Electrical and Electronics Engineers (IEEE), public funding programs for photonic chip production, and the supply agreements that now govern access to capacity.
IEEE P802.3dj. The IEEE P802.3dj task force covers 200 Gb/s, 400 Gb/s, 800 Gb/s and 1.6 Tb/s Ethernet. DC Market Insights expects 1.6T modules, which align with this generation of Ethernet rates, to lead transceiver value by 2030.
European pilot line. PIXEurope is a EUR 380 million European pilot line for photonic integrated circuits coordinated by Spain’s Institute of Photonic Sciences with 20 research organizations in 11 countries, intended to give companies open access from design to packaging.
Japanese industrial support. Japan’s Ministry of Economy, Trade and Industry (METI) is backing Tower Semiconductor’s USD 3 billion expansion of silicon photonics and silicon germanium capacity in Japan with roughly USD 1 billion in grants, with production readiness at Arai targeted for the fourth quarter of 2027.
Market Segmentation: Which Segment Leads the Silicon Photonics Market?
Optical transceivers lead the Silicon Photonics Market with 89.7% of 2025 value, 800G leads the data-rate split with 50.2%, and data center and AI applications lead with 85.5%. Co-packaged optics is the fastest-growing segment at 63.51% a year, ahead of optical I/O chiplets at 63.33%, because switch and accelerator makers need to cut the power of every optical link as clusters grow.
By Product: Optical Transceivers Lead with 89.7%
| Product | 2025 (USD billion) | Share 2025 | 2035 (USD billion) | CAGR 2025-2035 |
|---|---|---|---|---|
| Optical Transceivers | 4.70 | 89.7% | 14.01 | 11.54% |
| Active Optical Cables | 0.16 | 3.1% | 0.53 | 12.42% |
| Co-Packaged Optics | 0.09 | 1.7% | 11.84 | 63.51% |
| Optical I/O Chiplets | 0.03 | 0.6% | 4.22 | 63.33% |
| Sensing and LiDAR | 0.12 | 2.3% | 0.81 | 21.21% |
| Other Silicon Photonic Devices | 0.14 | 2.7% | 0.89 | 20.16% |
Optical transceivers still grow at 11.54% a year but fall to 43.4% of the market by 2035, while co-packaged optics reach 36.7% and optical I/O chiplets 13.1%.
By Data Rate: 800G Leads with 50.2%
The data-rate split covers pluggable transceivers and active optical cables, worth USD 4.86 billion in 2025 and USD 14.53 billion by 2035. 1.6T and above grows at 44.56% a year and reaches 79.5% of this segment by 2035, while 200G-and-below and 400G links decline by about 14% a year.
| Data rate | 2025 (USD billion) | Share 2025 | 2035 (USD billion) | CAGR 2025-2035 |
|---|---|---|---|---|
| 200G and Below | 0.32 | 6.5% | 0.07 | -14.26% |
| 400G | 1.16 | 23.9% | 0.24 | -14.41% |
| 800G | 2.44 | 50.2% | 1.48 | -4.89% |
| 1.6T and Above | 0.29 | 6.0% | 11.55 | 44.56% |
| Coherent | 0.65 | 13.5% | 1.19 | 6.17% |
By Application: Data Center and AI Leads with 85.5%
| Application | 2025 (USD billion) | Share 2025 | 2035 (USD billion) | CAGR 2025-2035 |
|---|---|---|---|---|
| Data Center and AI | 4.48 | 85.5% | 29.98 | 20.94% |
| Telecom and 5G Networks | 0.50 | 9.6% | 0.61 | 2.02% |
| Automotive and Industrial Sensing | 0.08 | 1.5% | 0.54 | 20.85% |
| Healthcare and Life Sciences | 0.04 | 0.7% | 0.28 | 21.95% |
| Quantum Computing and Others | 0.14 | 2.7% | 0.89 | 20.16% |
Healthcare and life sciences grow fastest outside the data center at 21.95% a year on DC Market Insights estimates, while telecom grows slowest at 2.02%.
DC Exclusive: The Unit-Price Model and Product × Application Matrix
At USD 4.20 billion in 2025, data center transceivers are the single largest cell of the matrix and 80.1% of all silicon photonics spending. The matrix below cross-tabulates what is sold against where it is used. It is a DC Market Insights model, not a shipment count: it is built from 215 inputs: 100 unit and price points for 5 transceiver classes across 10 anchor years, 50 value points for 5 other product lines, 7 application mapping shares, 10 regional shares and 48 country weights.
| 2025, USD billion | Data Center and AI | Telecom and 5G | Automotive and Industrial | Healthcare | Quantum and Others | Total |
|---|---|---|---|---|---|---|
| Optical Transceivers | 4.20 | 0.50 | – | – | – | 4.70 |
| Active Optical Cables | 0.16 | – | – | – | – | 0.16 |
| Co-Packaged Optics | 0.09 | – | – | – | – | 0.09 |
| Optical I/O Chiplets | 0.03 | – | – | – | – | 0.03 |
| Sensing and LiDAR | – | – | 0.08 | 0.04 | – | 0.12 |
| Other Silicon Photonic Devices | – | – | – | – | 0.14 | 0.14 |
| Total | 4.48 | 0.50 | 0.08 | 0.04 | 0.14 | 5.24 |
One feature stands out: telecom buys only transceivers, mostly coherent modules, so suppliers without a coherent product have almost no telecom exposure.
The unit-price model behind these figures has two inputs per speed class that any reader can check: units shipped and average price. Multiplying them gives transceiver value; adding the value of active optical cables, co-packaged optics, optical I/O chiplets, sensing chips and other devices gives the market. The model and its assumptions are explained on our research methodology page.
Regional Insights: Which Region Leads the Silicon Photonics Market?
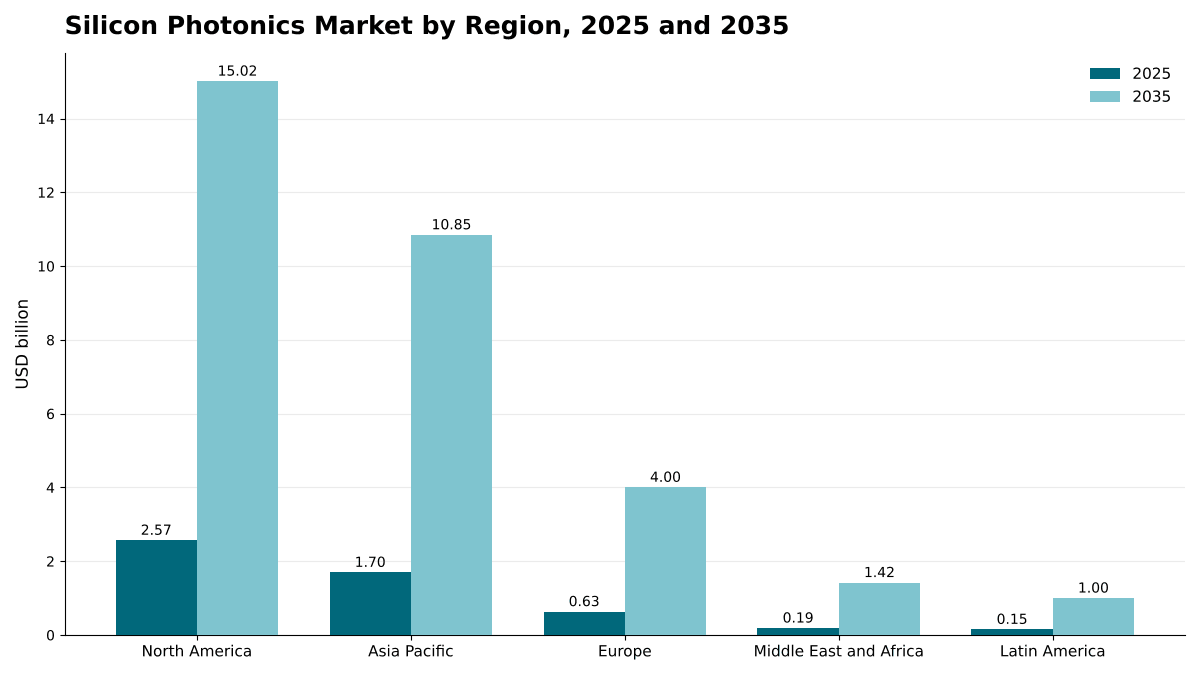
North America leads the Silicon Photonics Market with 49.0% of 2025 value, and the Middle East and Africa is the fastest-growing region at 22.37% a year because AI data center capacity in the Gulf is being added from a small installed base.
North America Leads with 49.0% Share
North America deployed USD 2.57 billion of silicon photonics devices in 2025 and is forecast to reach USD 15.02 billion by 2035, a CAGR of 19.31%. The United States accounts for 93.4% of the regional total. North America loses 2.5 points of share by 2035 as other regions add AI capacity, not because its volume slows.
Asia Pacific Holds 32.4% Share
Asia Pacific is worth USD 1.70 billion in 2025 and USD 10.85 billion by 2035, a CAGR of 20.38%. China is the largest market in the region, and Japan gains manufacturing weight through Tower Semiconductor’s USD 3 billion expansion. India grows fastest in the region at 24.89% a year.
Europe Holds 12.1% Share
Europe is worth USD 634.16 million in 2025 and USD 4.00 billion by 2035, a CAGR of 20.24%. Germany, the United Kingdom and France are the largest markets, and the EUR 380 million PIXEurope pilot line supports European photonic chip development.
Middle East and Africa Holds 3.6% Share
The Middle East and Africa is worth USD 188.68 million in 2025 and USD 1.42 billion by 2035, the fastest growth of any region at 22.37% a year, led by Saudi Arabia and the United Arab Emirates.
Latin America Holds 2.9% Share
Latin America is worth USD 151.99 million in 2025 and USD 1.00 billion by 2035, a CAGR of 20.74%, led by Brazil and Mexico.
Country Analysis: Which Countries Deploy the Most Silicon Photonics?
The United States is the largest country market for silicon photonics at USD 2.40 billion in 2025, 45.8% of global value, followed by China at USD 747.17 million (14.3%) and Japan at USD 212.26 million (4.0%). The 12 largest countries account for 84.3% of 2025 value.
| Rank | Country | Region | 2025 (USD billion) | Share 2025 | 2035 (USD billion) | CAGR 2025-2035 |
|---|---|---|---|---|---|---|
| 1 | United States | North America | 2.40 | 45.8% | 13.90 | 19.21% |
| 2 | China | Asia Pacific | 0.75 | 14.3% | 4.45 | 19.53% |
| 3 | Japan | Asia Pacific | 0.21 | 4.0% | 1.17 | 18.63% |
| 4 | Canada | North America | 0.17 | 3.2% | 1.11 | 20.69% |
| 5 | Germany | Europe | 0.14 | 2.7% | 0.84 | 19.68% |
| 6 | South Korea | Asia Pacific | 0.14 | 2.6% | 0.80 | 19.44% |
| 7 | United Kingdom | Europe | 0.12 | 2.4% | 0.74 | 19.67% |
| 8 | India | Asia Pacific | 0.12 | 2.3% | 1.13 | 24.89% |
| 9 | Taiwan | Asia Pacific | 0.10 | 2.0% | 0.61 | 19.35% |
| 10 | Australia | Asia Pacific | 0.10 | 1.8% | 0.66 | 21.31% |
| 11 | Singapore | Asia Pacific | 0.09 | 1.7% | 0.50 | 18.91% |
| 12 | France | Europe | 0.08 | 1.6% | 0.54 | 20.60% |
India is the fastest-growing large country market at 24.89% a year, ahead of Australia at 21.31%, as hyperscale and colocation operators add AI capacity outside the established hubs. The country figures are a DC Market Insights allocation of the regional totals, weighted by each country’s estimated share of installed and new AI data center capacity.
Forecast Scenarios: How Could the 2035 Forecast Change?
The Silicon Photonics Market reaches USD 32.29 billion by 2035 in the base case, with a range of USD 24.87 billion to USD 39.24 billion across the low and high scenarios.
| Scenario | Assumption from 2026 | 2035 (USD billion) | CAGR 2025-2035 |
|---|---|---|---|
| Low | AI capital spending pauses for two years; co-packaged optics adoption slips by about three years | 24.87 | 16.85% |
| Base | Transceiver units reach 37.42 million a year; co-packaged optics reach 36.7% of the market | 32.29 | 19.94% |
| High | Optical I/O replaces copper for most scale-up links by 2032; faster 3.2T adoption | 39.24 | 22.30% |
The low case reflects a slowdown in hyperscale capital spending, which would delay 1.6T and CPO volumes while pluggable prices keep falling. The high case assumes that optical I/O moves into the scale-up domain earlier than planned.
Competitive Insights: Who Leads the Silicon Photonics Market?
- Broadcom
- NVIDIA
- Coherent
- Lumentum
- Marvell Technology
- Zhongji InnoLight
- Eoptolink Technology
- TSMC
- GlobalFoundries
- Tower Semiconductor
- STMicroelectronics
- Ayar Labs
- Lightmatter
- Aeva
- PsiQuantum
DC Market Insights estimates that the five largest suppliers of silicon photonics transceivers, engines and switches held about 58% of the market in 2025, based on our allocation of 2025 transceiver units by supplier. Coherent reported Datacenter and Communications segment revenue of USD 5.27 billion in fiscal 2026 and Lumentum reported net revenue of USD 3.01 billion in fiscal 2026, up from USD 1.6 billion (Source: Lumentum filing with the US Securities and Exchange Commission); both figures cover each company’s full product range, not only silicon photonics. NVIDIA and Broadcom have both announced co-packaged optics switches, and NVIDIA named TSMC, Browave, Coherent, Corning, Fabrinet, Foxconn, Lumentum, SENKO, SPIL, Sumitomo Electric and TFC Communication as partners for its photonics switches. Among foundries, Tower Semiconductor and GlobalFoundries have reported silicon photonics revenue figures, while TSMC and STMicroelectronics are adding production. Marvell, Ayar Labs and Lightmatter are developing optical I/O, while Aeva and PsiQuantum represent the sensing and quantum segments.
Recent Developments
- In March 2025, NVIDIA announced its Spectrum-X Photonics and Quantum-X Photonics co-packaged optics switches, with Quantum-X expected later in 2025 and Spectrum-X in 2026 (Source: NVIDIA press release).
- In October 2025, Broadcom began sampling Tomahawk 6 Davisson, a 102.4Tb/s switch with co-packaged optics, to early access customers and partners (Source: StorageNewsletter report).
- In November 2025, GlobalFoundries acquired Advanced Micro Foundry, a silicon photonics company based in Singapore (Source: GlobalFoundries earnings release).
- In February 2026, Marvell completed its acquisition of Celestial AI, adding Photonic Fabric optical interconnect technology for scale-up connectivity (Source: Marvell press release).
- In March 2026, NVIDIA agreed to invest USD 2 billion each in Coherent and Lumentum, with multibillion-dollar purchase commitments for lasers and optical networking products (Source: Optica news report).
- In July 2026, Tower Semiconductor announced a USD 3 billion expansion of silicon photonics and silicon germanium capacity in Japan, backed by roughly USD 1 billion in METI grants (Source: Tech Times report).
We follow these deals, launches and capacity announcements as they happen in our data center industry updates.
Methodology: How We Built the Silicon Photonics Market Model
DC Market Insights built this market bottom-up from units and prices. For 5 transceiver speed classes, the model sets units shipped and average price at 10 anchor years between 2020 and 2035 and multiplies them; 5 other product lines (active optical cables, co-packaged optics, optical I/O chiplets, sensing and LiDAR, and other devices) are valued directly at the same anchor years. Years between anchors are interpolated on a smooth growth path. The total was split by 6 products, 5 data rates, 5 applications and 5 regions, and every split sums to its total. The result was checked top-down against foundry disclosures: Tower Semiconductor’s SiPho run rate of USD 180 million in the second quarter of 2025 and USD 680 million a year later, and GlobalFoundries’ silicon photonics revenue of more than USD 200 million in 2025. On our model, wafer content is roughly 8% to 14% of finished device value, so these disclosures are consistent with a USD 5.24 billion device market once in-house fabs and other foundries are added. Country values allocate each regional total by country weights for installed and new AI capacity. The analyst named on this page built the model, and the reviewer checked the arithmetic, the sources and the dates before publication.
Table of contents
- 01Introduction
- 1.1Market Definition and Scope
- 1.2Products, Applications and Regions Covered
- 1.3Currency, Base Year and Forecast Period
- 1.4Key Questions Answered
- 02Research Methodology
- 2.1Unit-Price Model by Transceiver Speed Class
- 2.2Value Model for Other Product Lines
- 2.3Top-Down Check Against Foundry Disclosures
- 2.4Assumptions and Limitations
- 03Executive Summary
- 3.1Market at a Glance, 2020-2035
- 3.2Key Findings
- 3.3Analyst Recommendations by Buyer Type
- 04Market Dynamics
- 4.1Drivers
- 4.2Challenges and Restraints
- 4.3Opportunities
- 4.4Trends
- 4.5Impact Analysis of Drivers and Challenges, 2025-2035
- 05Pricing Analysis
- 5.1Average Price per Transceiver by Data Rate, 2025, 2030 and 2035
- 5.2Blended Average Price and Mix Effect
- 5.3Price Outlook for Co-Packaged Optics and Optical I/O
- 06Standards and Regulation
- 6.1IEEE P802.3dj Ethernet Rates
- 6.2European Photonics Pilot Line (PIXEurope)
- 6.3Japanese Industrial Support for Photonics Capacity
- 07Supply Chain and Value Chain Analysis
- 7.1Silicon Photonics Foundries and Wafer Capacity
- 7.2Laser Sources and Capacity Agreements
- 7.3Module Assembly and Test
- 7.4Switch, Accelerator and System Integration
- 08Global Silicon Photonics Market Size and Forecast
- 8.1Market Size, 2020-2024
- 8.2Market Size, 2025
- 8.3Market Forecast, 2026-2035
- 8.4Transceiver Units, 2025, 2030 and 2035
- 09Market by Product
- 9.1Optical Transceivers
- 9.2Active Optical Cables
- 9.3Co-Packaged Optics
- 9.4Optical I/O Chiplets
- 9.5Sensing and LiDAR
- 9.6Other Silicon Photonic Devices
- 10Market by Data Rate
- 10.1200G and Below
- 10.2400G
- 10.3800G
- 10.41.6T and Above
- 10.5Coherent
- 11Market by Application
- 11.1Data Center and AI
- 11.2Telecom and 5G Networks
- 11.3Automotive and Industrial Sensing
- 11.4Healthcare and Life Sciences
- 11.5Quantum Computing and Others
- 12DC Exclusive: Product × Application Matrix
- 12.1Product × Application Matrix, 2025
- 12.2Unit-Price Model Inputs
- 12.3Implications for Suppliers
- 13Market by Region
- 13.1North America (United States, Canada)
- 13.2Asia Pacific (China, Japan, South Korea, India, Taiwan, Australia, Singapore, Malaysia, Rest of Asia Pacific)
- 13.3Europe (Germany, United Kingdom, France, Netherlands, Ireland, Nordics, Rest of Europe)
- 13.4Middle East and Africa (Saudi Arabia, United Arab Emirates, Rest of Middle East and Africa)
- 13.5Latin America (Brazil, Mexico, Rest of Latin America)
- 13.6Top 12 Countries, 2025 and 2035
- 14Regional Cross-Sections
- 14.1Region Shares, 2025 and 2035
- 14.2Country Growth Rates, 2025-2035
- 15Forecast Scenarios
- 15.1Base, Low and High Cases to 2035
- 15.2Sensitivity to AI Capital Spending
- 15.3Sensitivity to Co-Packaged Optics Adoption
- 16Competitive Landscape
- 16.1Concentration of Leading Suppliers, 2025
- 16.2Foundry Capacity and Customer Commitments
- 16.3Mergers, Acquisitions, Investments and Funding, 2025-2026
- 16.4Product Launches
- 17Company Profiles
- 17.1Broadcom
- 17.2NVIDIA
- 17.3Coherent
- 17.4Lumentum
- 17.5Marvell Technology
- 17.6Zhongji InnoLight
- 17.7Eoptolink Technology
- 17.8TSMC
- 17.9GlobalFoundries
- 17.10Tower Semiconductor
- 17.11STMicroelectronics
- 17.12Ayar Labs
- 17.13Lightmatter
- 17.14Aeva
- 17.15PsiQuantum
- 18Pluggable Optics Outlook
- 18.1800G Peak and Decline
- 18.21.6T and 3.2T Transition
- 18.3Coherent Data Center Interconnect
- 19Co-Packaged Optics and Optical I/O Outlook
- 19.1Switch Co-Packaged Optics
- 19.2Scale-Up Optical I/O
- 19.3External Laser Sources
- 20Non-Data Center Applications
- 20.1LiDAR and Industrial Sensing
- 20.2Biosensing
- 20.3Photonic Quantum Computing
- 21Analyst Recommendations
- 21.1For Module and Device Suppliers
- 21.2For Hyperscale and AI Cloud Operators
- 21.3For Investors
- Fig. 1Silicon Photonics Market Size, 2020-2035
- Fig. 2Market Share by Product, 2025 and 2035
- Fig. 3Market by Data Rate, 2025 and 2035
- Fig. 4Average Price per Transceiver by Data Rate, 2025-2035
- Fig. 5Product × Application Matrix, 2025
- Fig. 6Market by Region, 2025 and 2035
- Fig. 7Top 12 Countries, 2025
- Fig. 8Forecast Scenarios, 2025-2035
- Table 1Report Attributes
- Table 2Average Price per Transceiver, 2025, 2030 and 2035
- Table 3Market Size, 2020-2035
- Table 4Market by Product, 2025 and 2035
- Table 5Market by Data Rate, 2025 and 2035
- Table 6Market by Application, 2025 and 2035
- Table 7Product × Application Matrix, 2025
- Table 8Market by Region, 2025 and 2035
- Table 9Top 12 Countries, 2025 and 2035
- Table 10Forecast Scenarios, 2035
- Table 11Mergers, Acquisitions, Investments and Funding, 2025-2026
- Table 12Company Profiles: Products and Silicon Photonics Focus
About this report
Written by Amit Jain and reviewed by Deepti Agrawal, Senior Editor, Research. Figures are built top-down and bottom-up and reconciled before publication, with 2025 as the base year.
Read our methodologyHow we built this
- Historical period2020-2024
- Base year2025
- Forecast period2026-2035
- Sizing approachTop-down + bottom-up
Need more than the report?
Advisory on this market
Due diligence, site selection and market entry work, by the analysts who wrote this report.
See consulting servicesFrequently asked questions
USD 5.24 billion in 2025, rising to USD 32.29 billion by 2035. DC Market Insights estimates the market at USD 945.90 million in 2020.
19.94% a year from 2025 to 2035. Growth was faster, at 40.84% a year, between 2020 and 2025 as 800G links for GPU clusters moved onto silicon photonics, on DC Market Insights estimates.
Optical transceivers, with USD 4.70 billion or 89.7% of the market in 2025. Co-packaged optics is the fastest-growing segment at 63.51% a year.
About USD 302 on average in 2025, from about USD 45 at 200G and below to about USD 1,160 at 1.6T and USD 1,447 for a coherent module, according to DC Market Insights estimates.
North America, with USD 2.57 billion or 49.0% of 2025 value. The Middle East and Africa grows fastest at 22.37% a year.
About 58% of 2025 value is held by the five largest suppliers (DC Market Insights estimate). Broadcom, NVIDIA, Coherent, Lumentum, Marvell Technology, Zhongji InnoLight and Eoptolink Technology compete in devices, while TSMC, GlobalFoundries, Tower Semiconductor and STMicroelectronics produce silicon photonics chips.
USD 86.70 million in 2025, rising to USD 11.84 billion by 2035 at 63.51% a year, when co-packaged optics reach 36.7% of the Silicon Photonics Market (DC Market Insights estimate).
USD 2.40 billion in the United States, or 45.8% of 2025 value, followed by China at USD 747.17 million. India grows fastest among large country markets at 24.89% a year (DC Market Insights estimate).
Licences, delivery and payment
Which licence should I choose?
Single User is a view-only PDF for one person. Multi User adds a printable PDF and the Excel data for unlimited users at one location. Enterprise covers your whole company and includes 100 free analyst hours.
How and when will I receive the report?
By email, within 24–48 business hours of payment, in the formats of your licence.
How can I pay?
Securely through PayPal: with a PayPal account, a debit or credit card, or PayPal Pay Later where available. Prices are in US dollars.
Can I see a sample first?
Yes. Request a free sample and we will email it to you.
Can the report be tailored to my needs?
Yes. We can add countries, segments or data cuts. Talk to an analyst about the scope you need.
Can I get an invoice or pay against a purchase order?
Write to sales@dcmarketinsights.com and our team will help.