
Asia Pacific Data Center Infrastructure Market Size, Share & Forecast to 2035
Market at a glance
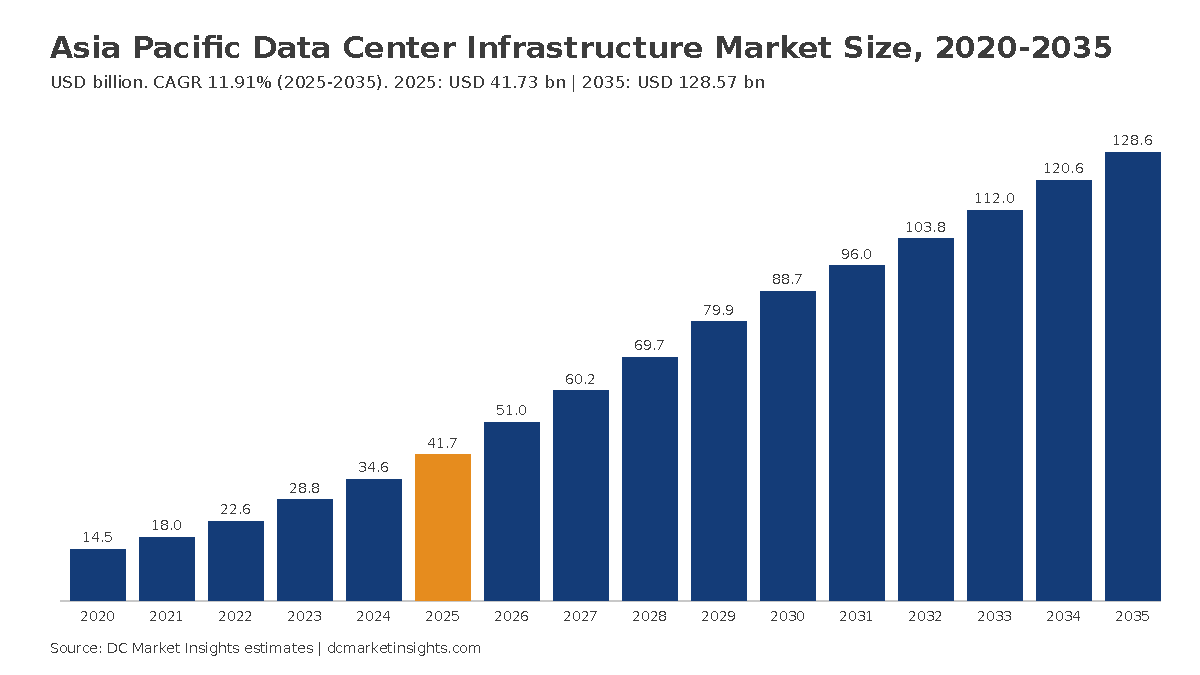
The Asia Pacific Data Center Infrastructure market was worth USD 41.73 billion in 2025 and is forecast to reach USD 128.57 billion by 2035, growing at a 11.91% CAGR.
 By Amit Jain, Senior Consultant, ICT & Emerging Technologies
 Reviewed by Deepti Agrawal
Last updated 18 Oct 2026
Base year 2025 PDF + Excel
What is inside the report
- 01Introduction
- 02Research Methodology
- 03Executive Summary
- 04Market Dynamics
- 05Pricing
- 06Standards and Regulation
- 07Market Segmentation by Infrastructure Type
- 08Market Segmentation by Data Center Type
- 09Market Segmentation by Build Type
- 10Market Segmentation by Tier Standard
- 16chapters
- 2020-2024Historical period
- 2026-2035Forecast period
- —Companies profiled
Segmentation
Full analysis
The Asia Pacific Data Center Infrastructure Market is valued at USD 51.02 billion in 2026 and is projected to reach USD 128.57 billion by 2035, up from USD 41.73 billion in 2025, a CAGR of 11.91% from 2025 to 2035 (DC Market Insights estimate). The money in this market follows the grid connection rather than the server order: a hall in Johor, Hyderabad or western Sydney cannot be fitted out until its utility energises a substation, and Tenaga Nasional Berhad (TNB) alone had signed 18 data center electricity supply agreements for about 1.7 gigawatts (GW) by the end of 2025 (Source: TNB analyst briefing, February 2026). Each of those megawatts (MW) carries about USD 4.81 million of electrical gear, USD 2.14 million of cooling plant and USD 3.75 million of civil, structural and architectural work in 2025, in DC Market Insights estimates. Asia Pacific Data Center Infrastructure covers that facility layer: power trains, cooling plant and the building shell and white space that house the IT, but not the servers, storage and network switches themselves. The 2025 build receipt is about 3.9 GW of IT capacity in build × USD 10.7 million per MW = USD 41.73 billion. Prefabricated and Modular builds are the fastest-growing segment at 17.77% a year, and South Asia is the fastest-growing region at 17.07% a year, because India’s capacity roughly triples between 2025 and 2030.
Key Market Statistics: How Big Is the Asia Pacific Data Center Infrastructure Market in 2026?
DC Market Insights values the Asia Pacific Data Center Infrastructure Market at USD 51.02 billion in 2026, 22.26% above the USD 41.73 billion of 2025, as the regional build cohort rises from about 3.9 GW to 4.5 GW of IT capacity and facility cost per MW climbs from USD 10.7 million to USD 11.3 million.
- Market size 2025: USD 41.73 billion
- Market size 2026: USD 51.02 billion
- Market size 2030: USD 88.71 billion
- Market size 2035: USD 128.57 billion
- CAGR 2025-2035: 11.91% (low case 9.79%, high case 13.29%)
- Largest infrastructure type: Electrical Infrastructure, 45.00% of 2025 spend (USD 18.78 billion)
- Fastest segment: Prefabricated and Modular builds, 17.77% a year to USD 38.57 billion by 2035
- Leading region: Greater China, 47.20% of 2025 spend; fastest-growing region: South Asia, 17.07%
- Largest country: China, USD 18.08 billion in 2025
- Market leader: Vertiv, about 4.9% of 2025 spend on its Asia Pacific net sales (DC Market Insights estimate)
How Much Does Asia Pacific Spend on Data Center Power, Cooling and Building Infrastructure?
Asia Pacific spent USD 41.73 billion on data center facility infrastructure in 2025. The Asia Pacific Data Center Infrastructure Market size was valued at USD 14.51 billion in 2020, reached USD 41.73 billion in 2025, and is anticipated to reach USD 128.57 billion by 2035, at a CAGR of 11.91% during the forecast period. Between 2020 and 2025 the market grew 23.52% a year, because the regional build cohort doubled from about 1.9 GW to 3.9 GW while facility cost per MW rose 39% from USD 7.7 million to USD 10.7 million.
| Report Attribute | Details |
|---|---|
| Historical Period | 2020-2024 |
| Base Year | 2025 |
| Forecast Period | 2026-2035 |
| Asia Pacific Data Center Infrastructure Market Size 2025 | USD 41.73 billion |
| Asia Pacific Data Center Infrastructure Market Size 2026 | USD 51.02 billion |
| Asia Pacific Data Center Infrastructure Market CAGR (2025-2035) | 11.91% |
| Asia Pacific Data Center Infrastructure Market Size 2035 | USD 128.57 billion |
DC Market Insights estimates that the Asia Pacific build cohort grows from 3.9 GW in 2025 to about 7.0 GW in 2030 and 8.7 GW by 2035, as the region’s share of global new capacity edges from 30.0% to 32.0%. Growth slows from 2031 (USD 96.05 billion) because new capacity additions flatten at 23-27 GW a year worldwide, so later gains come mostly from cost per MW, which rises about 3% a year to USD 14.74 million in 2035. Facility infrastructure is 24.4% of the Asia Pacific Data Center Market in 2025; the other 75.6% is servers, storage and networking.
Key takeaways:
- USD 41.73 billion in 2025 rises to USD 128.57 billion by 2035, an 11.91% CAGR, because the build cohort doubles.
- Electrical Infrastructure holds 45.00% of spend because AI halls need more transformers, switchgear and uninterruptible power supply (UPS) units per MW.
- Cooling grows fastest of the three types, 13.97% a year, because liquid loops add USD 1.40 million per MW.
- South Asia rises from 10.0% to 15.7% of spend because India’s hyperscale pledges exceed USD 32 billion.
- Prefabricated and Modular builds reach 30.0% of spend by 2035 because factory-built skids suit grid-limited schedules.
What Does Asia Pacific Data Center Infrastructure Include, and What Is Left Out?
Asia Pacific Data Center Infrastructure covers USD 41.73 billion of 2025 spend on the physical facility that powers, cools and houses IT equipment across 12 named countries and the rest of Southeast and South Asia.
Included
- Electrical Infrastructure (USD 18.78 billion): grid connection and medium-voltage substations, transformers, switchgear, UPS systems and batteries, power distribution units (PDUs), busway, standby generators and their fuel systems.
- Mechanical and Cooling Infrastructure (USD 8.35 billion): chillers, cooling towers and dry coolers, computer room air handlers, fan walls, containment, coolant distribution units, liquid loops and the piping and controls that run them.
- Civil, Structural and Architectural (USD 14.61 billion): site preparation, foundations and superstructure, building envelope, raised floors, racks and white-space fit-out, structured cabling pathways, fire protection and physical security systems.
Excluded
Servers, storage arrays, network switches and their refresh cycles are excluded; they make up the IT Infrastructure line of the Asia Pacific Data Center Market. Land, electricity bills, on-site power plants sold under power purchase agreements, colocation rent and software are excluded too. Data center infrastructure management (DCIM) software is covered separately in the Asia Pacific Data Center Infrastructure Management (DCIM) Market: that report sizes the monitoring software layer, this one the physical plant it monitors.
How the segments fit together
Every USD of the market is classified four ways: by infrastructure type (three items), by data center type (four), by build type (three) and by tier standard (three). Each dimension sums to the USD 41.73 billion total in 2025 and to the total in every forecast year, and the five sub-regions and their countries sum the same way.
Why Do Asia Pacific Data Center Infrastructure Market Estimates Differ?
Estimates differ mainly because of scope: DC Market Insights counts USD 51.02 billion of facility infrastructure in 2026, while definitions that add IT hardware reach several times that figure.
The earlier edition of this page included IT and network infrastructure in the same total, which put 2025 at USD 42.97 billion with a 13.20% CAGR on a narrower capacity base. Broader definitions add servers, storage and networking, which on DC Market Insights figures would add USD 129.28 billion in 2025 and push the total close to USD 171 billion. Some figures also include land, power plants built for data centers, DCIM and building management software, or colocation revenue. This page keeps to the facility layer so that it can be added to the IT layer without double counting. Buyers in scope include hyperscale cloud operators, colocation developers, enterprises and government agencies building their own halls, and small and medium-sized enterprises (SMEs) whose edge rooms are counted in the Edge segment.
| Element | In this report | Why |
|---|---|---|
| Power, cooling, shell and white space | Yes, USD 41.73 billion (2025) | Physical facility layer |
| Servers, storage, network switches | No (USD 129.28 billion in 2025) | IT layer, sized in the Asia Pacific Data Center Market |
| DCIM software | No | Sized in the Asia Pacific DCIM report |
| Land, electricity, on-site power plants | No | Not equipment or construction |
| Colocation rent | No | Revenue, not infrastructure spend |
What Drives Asia Pacific Data Center Infrastructure Spending?
Three dated, Asia Pacific-specific forces drive the 11.91% CAGR: utility power contracts in Malaysia, hyperscale pledges worth about USD 156 billion, and efficiency rules that raise cooling content per MW.
Johor’s 1.7 GW of signed supply agreements turn into electrical orders
Malaysia’s utility TNB had signed 18 data center Energy Supply Agreements totalling about 1.7 GW in its 2025 financial year, with 850 MW of actual data center load in December 2025 (Source: TNB). At USD 4.81 million of electrical infrastructure per MW, the unbuilt 850 MW alone represents about USD 4.09 billion of switchgear, transformers, UPS and generators, most of it ordered in 2026-2028. Malaysia’s facility spend therefore grows 16.28% a year, from USD 1.56 billion in 2025 to USD 7.06 billion by 2035, the third-fastest of the 12 countries.
Nine hyperscale pledges worth about USD 156 billion
Between February 2025 and May 2026, nine announcements committed about USD 156.3 billion to Asia Pacific data center and cloud capacity: Alibaba Group’s RMB 380 billion (USD 53 billion) over three years, Microsoft’s A$25 billion (USD 18 billion) in Australia and USD 17.5 billion in India, Amazon’s AU$20 billion in Australia and more than USD 5 billion in Taiwan, Google’s USD 15 billion Visakhapatnam AI hub, AirTrunk’s 27 billion Malaysian ringgit (MYR) in Malaysia, Airtel’s USD 1 billion in Nxtra and Thailand’s THB 913 billion of Board of Investment (BOI) approvals (Sources: company releases; Thailand BOI). In DC Market Insights estimates about 24.4% of such pledges reaches the facility layer, or about USD 38.1 billion, close to one full year of 2025 market value.
Power Usage Effectiveness rules in China, Japan and Singapore raise cooling content
China’s special action plan requires new and expanded large data centers to reach a Power Usage Effectiveness (PUE) of 1.25 or below by the end of 2025 (Source: State Council policy library, July 2024); Japan will require PUE 1.3 or below for data centers built from fiscal year 2029 (Source: Agency for Natural Resources and Energy, May 2026); and Singapore targets PUE 1.3 for all data centers. Meeting those levels in hot, humid climates pushes buyers to liquid cooling and free-cooling plant, lifting mechanical content from USD 2.14 million per MW in 2025 to USD 3.54 million by 2035, and the cooling share of spend from 20.0% to 24.0%.
Which Trends Are Changing How Asia Pacific Data Centers Are Built?
Two trends reshape Asia Pacific data center infrastructure spending, moving about USD 30 billion of 2035 spend: factory-built modules and the shift from air to liquid cooling.
Factory-built power and cooling modules take 30% of spend by 2035
Prefabricated and Modular builds grow from USD 7.51 billion in 2025 to USD 38.57 billion by 2035 (17.77% a year), in DC Market Insights estimates. Grid-limited sites such as Johor and western Sydney favour skid-mounted switchgear, prefabricated electrical rooms and modular chiller plants because they can be tested in the factory while the utility completes the substation, saving months of on-site work.
Watt-bit siting moves capacity toward renewable-rich regions in Japan
Japan’s Ministry of Internal Affairs and Communications selected all seven proposals for its fiscal 2026 watt-bit collaboration demonstrations in July 2026, testing distributed data centers and workload shifting between power-rich and demand regions (Source: Ministry of Internal Affairs and Communications). Japan’s facility spend still grows 9.71% a year, from USD 5.56 billion in 2025 to USD 14.06 billion by 2035, but more of it lands in Hokkaido and Kyushu, where substations have spare capacity.
Higher-tier AI halls
Tier IV designs grow from 18.0% to 30.0% of spend (USD 38.57 billion by 2035) because AI training halls with 100 kilowatt racks carry redundant power trains and cooling loops; Tier I and II rooms fall from 14.0% to 8.0%.
What Holds Back Asia Pacific Data Center Infrastructure Spending?
Grid capacity and construction cost are the two restraints that keep the low case at USD 106.16 billion by 2035, USD 22.41 billion below the base case.
Grid supply limits in Australia, Japan and Singapore
The Australian Energy Market Operator (AEMO) expects data center consumption in the National Electricity Market to rise from about 5 terawatt hours (TWh) in 2025-26 to 34 TWh by 2035-36, from about 3% to 13% of grid supply (Source: AEMO 2026 Electricity Statement of Opportunities). Japan’s grid operator OCCTO forecasts fiscal 2026 demand of 318,124 million kilowatt hours, citing new data centers and chip plants (Source: OCCTO, January 2026), and Singapore allocates new capacity only through competitive calls for application (Source: Ministry of Digital Development and Information, March 2026). If connection queues hold the regional cohort at 24 GW worldwide and a 30% Asia Pacific share in 2035, the market reaches USD 106.16 billion rather than USD 128.57 billion.
Cost per MW rises faster than budgets
Facility cost per MW rises from USD 10.7 million in 2025 to USD 14.74 million by 2035 in DC Market Insights estimates, a 37.8% increase, because transformers, switchgear and chillers stay on long lead times. Tokyo and Singapore halls cost about 35% above the regional average, which delays enterprise builds; the Enterprise segment grows only 3.51% a year, from USD 5.01 billion in 2025 to USD 7.07 billion by 2035.
Where Are the Biggest Asia Pacific Data Center Infrastructure Opportunities?
India and liquid cooling together add about USD 37 billion of annual spend between 2025 and 2035.
India’s facility build-out: USD 14.60 billion of added annual spend
India’s facility spend grows from USD 3.48 billion in 2025 to USD 18.08 billion by 2035 (17.92% a year), the fastest of the 12 countries. Microsoft’s USD 17.5 billion for 2026-2029 and Google’s USD 15 billion Visakhapatnam campus for 2026-2030 alone imply about USD 7.9 billion of facility content at the 24.4% facility ratio (Sources: Microsoft; Google). Airtel’s Nxtra, at about 300 MW and aiming for 1 GW, needs roughly USD 7.5 billion of facility work at USD 10.7 million per MW (Source: Airtel).
Cooling plant for AI halls: USD 22.51 billion of added annual spend
Mechanical and Cooling Infrastructure grows from USD 8.35 billion in 2025 to USD 30.86 billion by 2035, adding USD 22.51 billion a year, because direct-to-chip and rear-door liquid systems add coolant distribution units, secondary loops and larger heat rejection to every AI MW.
What Does Data Center Infrastructure Cost per MW in Asia Pacific?
Asia Pacific data center infrastructure costs about USD 10.7 million per MW of IT capacity in 2025 in DC Market Insights estimates, rising to USD 14.74 million by 2035.
| Year | Electrical (USD million/MW) | Mechanical and Cooling (USD million/MW) | Civil, Structural and Architectural (USD million/MW) | Total (USD million/MW) |
|---|---|---|---|---|
| 2020 | 3.46 | 1.39 | 2.85 | 7.70 |
| 2025 | 4.81 | 2.14 | 3.75 | 10.70 |
| 2030 | 5.72 | 2.80 | 4.20 | 12.72 |
| 2035 | 6.63 | 3.54 | 4.57 | 14.74 |
Public anchors bracket the regional average: AirTrunk’s MYR 27 billion (USD 6.8 billion) for more than 700 MW in Malaysia implies under USD 9.7 million per MW including land and power works (Source: AirTrunk, April 2026), while Japan and Singapore sit at the top of the regional range at about USD 14-15 million per MW. India and Malaysia sit at the low end, about USD 7-9 million per MW, because of lower labour and land-preparation costs.
Which Rules and Standards Shape Data Center Infrastructure in Asia Pacific?
Five sets of rules decide what Asia Pacific data center infrastructure must deliver in 2026, and three of them set PUE targets between 1.25 and 1.3.
- China: the Special Action Plan for Green, Low-Carbon Data Center Development (July 2024) sets PUE 1.25 for new large data centers; the eight “East Data, West Computing” hubs had drawn over RMB 43.5 billion of direct investment by June 2024 (Source: Government of China).
- Japan: the Energy Conservation Act benchmark of PUE 1.4 by fiscal 2030 and PUE 1.3 for halls built from fiscal 2029 (Source: Agency for Natural Resources and Energy).
- Singapore: the Green Data Centre Roadmap targets PUE 1.3 and at least 300 MW of new capacity (Source: Infocomm Media Development Authority); the Jurong Island park can supply up to 700 MW (Source: JTC Corporation).
- India: the Digital Personal Data Protection Rules, 2025 phase in over 18 months, keeping regulated data in Indian halls (Source: Press Information Bureau).
- Australia: the Hosting Certification Framework applies to government data hosting contracts from 30 June 2022 (Source: Digital Transformation Agency).
Design standards used across the region include the Uptime tier classification, ANSI/TIA-942 and EN 50600, which set the redundancy that separates the Tier III and Tier IV segments.
Which Asia Pacific Data Center Infrastructure Segment Carries the Most Value?
Electrical Infrastructure carries the most value at USD 18.78 billion, or 45.00% of 2025 spend, while Prefabricated and Modular builds grow fastest at 17.77% a year.
By infrastructure type
| Infrastructure Type | 2025 (USD million) | Share 2025 | 2035 (USD million) | CAGR 2025-2035 |
|---|---|---|---|---|
| Electrical Infrastructure | 18,778.50 | 45.0% | 57,854.67 | 11.91% |
| Mechanical and Cooling Infrastructure | 8,346.00 | 20.0% | 30,855.83 | 13.97% |
| Civil, Structural and Architectural | 14,605.50 | 35.0% | 39,855.44 | 10.56% |
By end user, banking, financial services and insurance (BFSI) firms account for about 13% of 2025 spend, or USD 5.42 billion, mostly in enterprise and colocation halls (DC Market Insights estimate). Within Electrical Infrastructure, DC Market Insights estimates that UPS systems and batteries and switchgear with PDUs each take about 30%, grid connection and transformers about 22%, and standby generators about 18%.
By data center type
| Data Center Type | 2025 (USD million) | Share 2025 | 2035 (USD million) | CAGR 2025-2035 |
|---|---|---|---|---|
| Hyperscale and Cloud | 22,951.50 | 55.0% | 82,282.20 | 13.62% |
| Colocation | 12,519.00 | 30.0% | 35,998.46 | 11.14% |
| Enterprise | 5,007.60 | 12.0% | 7,071.13 | 3.51% |
| Edge | 1,251.90 | 3.0% | 3,214.15 | 9.89% |
By build type
| Build Type | 2025 (USD million) | Share 2025 | 2035 (USD million) | CAGR 2025-2035 |
|---|---|---|---|---|
| Greenfield Stick-Built | 25,872.60 | 62.0% | 66,854.29 | 9.96% |
| Prefabricated and Modular | 7,511.40 | 18.0% | 38,569.78 | 17.77% |
| Expansion and Retrofit | 8,346.00 | 20.0% | 23,141.87 | 10.74% |
By tier standard
| Tier Standard | 2025 (USD million) | Share 2025 | 2035 (USD million) | CAGR 2025-2035 |
|---|---|---|---|---|
| Tier I and II | 5,842.20 | 14.0% | 10,285.28 | 5.82% |
| Tier III | 28,376.40 | 68.0% | 79,710.88 | 10.88% |
| Tier IV | 7,511.40 | 18.0% | 38,569.78 | 17.77% |
DC Exclusive: Asia Pacific Hyperscale Commitment Tracker (9 Pledges, USD 156.3 Billion)
DC Market Insights modelled the facility content of nine dated Asia Pacific pledges worth USD 156.3 billion at about USD 38.1 billion, using 24 inputs (nine pledge values, the 24.4% facility ratio, three cost-per-MW lines, five sub-region shares and six country checks); the figures are DC Market Insights estimates, not company disclosures of facility spend.
| Pledge (date) | Country | Value (USD billion) | Estimated facility content (USD billion) |
|---|---|---|---|
| Alibaba Group AI and cloud, 3 years (Feb 2025) | China | 53.0 | 12.9 |
| Thailand BOI approvals: TikTok, Skyline, Bridge (May 2026) | Thailand | 27.0 | 6.6 |
| Microsoft, by end-2029 (Apr 2026) | Australia | 18.0 | 4.4 |
| Microsoft, 2026-2029 (Dec 2025) | India | 17.5 | 4.3 |
| Google Visakhapatnam AI hub, 2026-2030 (Oct 2025) | India | 15.0 | 3.7 |
| Amazon AU$20 billion, 2025-2029 (Jun 2025) | Australia | 13.0 | 3.2 |
| AirTrunk two Johor campuses (Apr 2026) | Malaysia | 6.8 | 1.7 |
| Amazon Taiwan region (Jun 2025) | Taiwan | 5.0 | 1.2 |
| Airtel investment in Nxtra (Mar 2026) | India | 1.0 | 0.2 |
| Total (rows rounded) | 156.3 | 38.1 |
The second table is the sub-region × infrastructure type spend matrix for 2025 (USD million), built from the same model.
| Sub-region | Electrical | Mechanical and Cooling | Civil, Structural and Architectural | Total |
|---|---|---|---|---|
| Greater China | 8,863.45 | 3,939.31 | 6,893.80 | 19,696.56 |
| Japan and South Korea | 3,661.81 | 1,627.47 | 2,848.07 | 8,137.35 |
| Southeast Asia | 3,004.56 | 1,335.36 | 2,336.88 | 6,676.80 |
| South Asia | 1,877.85 | 834.60 | 1,460.55 | 4,173.00 |
| Oceania | 1,370.83 | 609.26 | 1,066.20 | 3,046.29 |
Which Asia Pacific Sub-Region Leads Data Center Infrastructure Spending?
Greater China leads with USD 19.70 billion, 47.20% of 2025 spend. South Asia is the fastest-growing sub-region at 17.07% a year, from USD 4.17 billion to USD 20.18 billion by 2035, because India’s hyperscale pledges and data protection rules pull capacity into Mumbai, Chennai and Hyderabad.
| Sub-region | 2025 (USD million) | Share 2025 | 2035 (USD million) | CAGR 2025-2035 |
|---|---|---|---|---|
| Greater China | 19,696.56 | 47.2% | 53,869.13 | 10.58% |
| Japan and South Korea | 8,137.35 | 19.5% | 21,599.08 | 10.25% |
| Southeast Asia | 6,676.80 | 16.0% | 24,170.40 | 13.73% |
| South Asia | 4,173.00 | 10.0% | 20,184.85 | 17.07% |
| Oceania | 3,046.29 | 7.3% | 8,742.48 | 11.12% |
Greater China
Spend in Greater China grows 10.58% a year to USD 53.87 billion by 2035; the national hubs that host most new capacity must meet PUE 1.25, which keeps cooling content high even as Chinese suppliers hold electrical prices down.
Japan and South Korea
Spend in Japan and South Korea grows 10.25% a year to USD 21.60 billion; NTT DATA’s 30 MW Keihanna data center in the Kansai region, opened in April 2026, shows the shift of Japanese capacity away from Tokyo (Source: NTT DATA).
Southeast Asia
Spend in Southeast Asia grows 13.73% a year to USD 24.17 billion; Malaysia (USD 1.56 billion in 2025) and Thailand (USD 0.63 billion) grow above 16% a year on Johor power agreements and the May 2026 BOI approvals (Sources: TNB; Thailand BOI).
South Asia
India accounts for almost all of the South Asian figure, taking USD 3.48 billion of the USD 4.17 billion in 2025; the rest of the sub-region, led by Bangladesh and Sri Lanka, takes about USD 0.70 billion.
Oceania
Spend in Oceania grows 11.12% a year to USD 8.74 billion; NEXTDC’s contracted utilisation rose 137% to 416.6 MW in the half to December 2025 (Source: NEXTDC ASX release), but AEMO’s grid outlook limits how fast new Sydney and Melbourne halls can be energised.
Which Asia Pacific Countries Spend the Most on Data Center Infrastructure?
China spends the most on Asia Pacific data center infrastructure, USD 18.08 billion in 2025, and India is the fastest-growing large country at 17.92% a year.
| Rank | Country | 2025 (USD million) | 2035 (USD million) | CAGR 2025-2035 | Sub-region |
|---|---|---|---|---|---|
| 1 | China | 18,083.00 | 50,221.07 | 10.75% | Greater China |
| 2 | Japan | 5,564.00 | 14,061.90 | 9.71% | Japan and South Korea |
| 3 | India | 3,477.50 | 18,079.58 | 17.92% | South Asia |
| 4 | Australia | 2,782.00 | 8,035.37 | 11.19% | Oceania |
| 5 | South Korea | 2,562.19 | 7,553.79 | 11.42% | Japan and South Korea |
| 6 | Singapore | 2,086.50 | 4,821.22 | 8.74% | Southeast Asia |
| 7 | Malaysia | 1,561.71 | 7,059.60 | 16.28% | Southeast Asia |
| 8 | Hong Kong | 1,098.08 | 2,268.59 | 7.53% | Greater China |
| 9 | Indonesia | 732.05 | 3,596.77 | 17.26% | Southeast Asia |
| 10 | Thailand | 634.45 | 3,248.99 | 17.74% | Southeast Asia |
| 11 | Taiwan | 513.97 | 1,384.09 | 10.41% | Greater China |
| 12 | New Zealand | 268.42 | 693.58 | 9.96% | Oceania |
Country shares match the Asia Pacific AI Data Center Market and Asia Pacific Data Center Market models, so facility and IT figures for each country can be added together.
How Could the 2035 Asia Pacific Data Center Infrastructure Forecast Change?
The 2035 value of the Asia Pacific Data Center Infrastructure Market ranges from USD 106.16 billion to USD 145.37 billion around the USD 128.57 billion base case.
| Scenario | 2035 (USD million) | CAGR 2025-2035 | Assumption |
|---|---|---|---|
| Low | 106,155.36 | 9.79% | Grid queues hold global new capacity at 24 GW and the Asia Pacific share at 30% |
| Base | 128,565.94 | 11.91% | 27.25 GW cohort, 32% Asia Pacific share, USD 14.74 million per MW |
| High | 145,373.87 | 13.29% | 29 GW cohort and a 34% share as India and Malaysia exceed plan |
Who Are the Leading Asia Pacific Data Center Infrastructure Companies?
Vertiv leads Asia Pacific data center infrastructure with about 4.9% of 2025 spend, and DC Market Insights estimates the five largest equipment suppliers take about 21% of the market, because civil and structural work (35.0%) is split among hundreds of local contractors.
- Vertiv
- Schneider Electric
- ABB
- Eaton
- Huawei Digital Power
- Delta Electronics
- Siemens
- Hitachi Energy
- Mitsubishi Electric
- Fuji Electric
- Legrand
- Daikin
- Johnson Controls
- Trane Technologies
- Cummins
- Caterpillar
- Rehlko
Vertiv reported net sales of USD 10.23 billion for 2025, about 20% of it in Asia Pacific, or about USD 2.05 billion (Source: Vertiv Form 10-K for 2025); against USD 41.73 billion of market value that is about 4.9%, a ceiling since part of those sales goes to telecom and industrial buyers. Huawei Digital Power and Delta Electronics lead in Chinese and Taiwanese UPS and power modules, Japanese suppliers Mitsubishi Electric and Fuji Electric hold most of Japan’s UPS base, and Daikin, Trane Technologies and Johnson Controls compete on chiller plant. On the developer side, AirTrunk’s committed Malaysian investment of MYR 27 billion across more than 700 MW makes it one of the largest single buyers of facility infrastructure in Southeast Asia (Source: AirTrunk).
What Changed in Asia Pacific Data Center Infrastructure in 2025 and 2026?
For Asia Pacific data center infrastructure, six dated events since October 2025 added at least 1.7 GW of contracted power and USD 84.3 billion of new pledges in the region (Sources: TNB; company releases; Thailand BOI).
- In October 2025, Google announced about USD 15 billion for 2026-2030 for its AI hub in Visakhapatnam, India (Source: Google).
- In December 2025, Microsoft announced USD 17.5 billion for India over 2026-2029 (Source: Microsoft).
- In February 2026, TNB reported 18 signed data center supply agreements for about 1.7 GW (Source: TNB).
- In April 2026, Microsoft committed A$25 billion (USD 18 billion) to Australian digital infrastructure by the end of 2029, and AirTrunk announced two new Johor campuses (Sources: Microsoft; AirTrunk).
- In May 2026, Thailand’s BOI approved three data center projects worth THB 913 billion (Source: Thailand Board of Investment).
- In August 2026, AEMO forecast data center use rising to 34 TWh by 2035-36 in the National Electricity Market (Source: AEMO).
How Did DC Market Insights Build the Asia Pacific Data Center Infrastructure Model? (Methodology)
The model multiplies the Asia Pacific build cohort by facility cost per MW: 13.0 GW of global new IT capacity in build in 2025 × 30.0% Asia Pacific share = 3.9 GW, × USD 10.7 million per MW = USD 41.73 billion. The global cohort is 6.5 GW (2020), 13.0 GW (2025), 22.5 GW (2030) and 27.25 GW (2035); the Asia Pacific share rises 0.2 points a year from 29.0% in 2020 to 32.0% in 2035; cost per MW is USD 7.7 million (2020), USD 11.3 million (2026) and then rises 3% a year. Infrastructure type shares (45% electrical; cooling 20% rising to 24%) match the facility lines of the Data Center Market model, sub-region and country shares match the Asia Pacific Data Center Market, and all four segment dimensions sum to the total in every year from 2020 to 2035.
Three bound checks:
- Ceiling 1: the 2025 value of USD 41.73 billion is 24.4% of the USD 171.01 billion Asia Pacific Data Center Market, within the 20-30% facility share of a typical hall budget.
- Ceiling 2: the 2026 value of USD 51.02 billion is below the roughly USD 54 billion implied by the about 4.8 GW that DC Market Insights counts under construction in mid-2026, at USD 11.3 million per MW.
- Floor: Vertiv’s Asia Pacific net sales of about USD 2.05 billion equal 4.9% of the 2025 value, consistent with a leader’s share in a market where no supplier sells across all three infrastructure types.
Full approach: DC Market Insights research methodology. Global context: Data Center Market.
Table of contents
- 01Introduction
- 1.1Market Definition and Scope
- 1.2Included and Excluded Elements
- 1.3How the Segments Fit Together
- 1.4Why Asia Pacific Data Center Infrastructure Market Estimates Differ
- 02Research Methodology
- 2.1Bottom-Up Model: Build Cohort GW × Facility Cost per MW
- 2.2Bound Checks
- 2.3Source Ledger
- 03Executive Summary
- 3.1Market Snapshot, 2025, 2026 and 2035
- 3.2Key Market Statistics
- 3.3Key Takeaways
- 04Market Dynamics
- 4.1Driver: Johor's 1.7 GW of Signed Supply Agreements
- 4.2Driver: Nine Hyperscale Pledges Worth USD 156.3 Billion
- 4.3Driver: PUE Rules in China, Japan and Singapore
- 4.4Trend: Factory-Built Power and Cooling Modules
- 4.5Trend: Watt-Bit Siting in Japan
- 4.6Trend: Higher-Tier AI Halls
- 4.7Restraint: Grid Supply Limits in Australia, Japan and Singapore
- 4.8Restraint: Cost per MW Rising Faster Than Budgets
- 4.9Opportunity: India's Facility Build-Out
- 4.10Opportunity: Cooling Plant for AI Halls
- 05Pricing
- 5.1Facility Cost per MW by Infrastructure Type, 2020-2035
- 5.2Public Price Anchors
- 06Standards and Regulation
- 6.1China: Green Low-Carbon Data Center Action Plan
- 6.2Japan: Energy Conservation Act PUE Benchmarks
- 6.3Singapore: Green Data Centre Roadmap
- 6.4India: Digital Personal Data Protection Rules, 2025
- 6.5Australia: Hosting Certification Framework
- 07Market Segmentation by Infrastructure Type
- 7.1Electrical Infrastructure
- 7.2Mechanical and Cooling Infrastructure
- 7.3Civil, Structural and Architectural
- 08Market Segmentation by Data Center Type
- 8.1Hyperscale and Cloud
- 8.2Colocation
- 8.3Enterprise
- 8.4Edge
- 09Market Segmentation by Build Type
- 9.1Greenfield Stick-Built
- 9.2Prefabricated and Modular
- 9.3Expansion and Retrofit
- 10Market Segmentation by Tier Standard
- 10.1Tier I and II
- 10.2Tier III
- 10.3Tier IV
- 11DC Exclusive: Asia Pacific Hyperscale Commitment Tracker
- 11.1Nine-Pledge Tracker (USD 156.3 Billion)
- 11.2Sub-Region × Infrastructure Type Spend Matrix, 2025
- 12Regional Analysis
- 12.1Greater China
- 12.2Japan and South Korea
- 12.3Southeast Asia
- 12.4South Asia
- 12.5Oceania
- 13Country Analysis
- 13.1China
- 13.2Japan
- 13.3India
- 13.4Australia
- 13.5South Korea
- 13.6Singapore
- 13.7Malaysia
- 13.8Hong Kong
- 13.9Indonesia
- 13.10Thailand
- 13.11Taiwan
- 13.12New Zealand
- 14Forecast Scenarios
- 14.1Low Case
- 14.2Base Case
- 14.3High Case
- 15Competitive Insights
- 15.1Vertiv
- 15.2Schneider Electric
- 15.3ABB
- 15.4Eaton
- 15.5Huawei Digital Power
- 15.6Delta Electronics
- 15.7Siemens
- 15.8Hitachi Energy
- 15.9Mitsubishi Electric
- 15.10Fuji Electric
- 15.11Legrand
- 15.12Daikin
- 15.13Johnson Controls
- 15.14Trane Technologies
- 15.15Cummins
- 15.16Caterpillar
- 15.17Rehlko
- 16Recent Developments
- 16.1Dated Events, October 2025 to August 2026
- Fig. 1Asia Pacific Data Center Infrastructure Market Size, 2020-2035 (USD Billion)
- Table 1Report Attributes
- Table 2Scope Comparison: Elements In and Out of Scope
- Table 3Facility Cost per MW by Infrastructure Type, 2020-2035
- Table 4Market by Infrastructure Type, 2025 and 2035
- Table 5Market by Data Center Type, 2025 and 2035
- Table 6Market by Build Type, 2025 and 2035
- Table 7Market by Tier Standard, 2025 and 2035
- Table 8Asia Pacific Hyperscale Commitment Tracker
- Table 9Sub-Region × Infrastructure Type Spend Matrix, 2025
- Table 10Market by Sub-Region, 2025 and 2035
- Table 11Top 12 Countries, 2025 and 2035
- Table 12Forecast Scenarios, 2035
About this report
Written by Amit Jain and reviewed by Deepti Agrawal, Senior Editor, Research. Figures are built top-down and bottom-up and reconciled before publication, with 2025 as the base year.
Read our methodologyHow we built this
- Historical period2020-2024
- Base year2025
- Forecast period2026-2035
- Sizing approachTop-down + bottom-up
Need more than the report?
Advisory on this market
Due diligence, site selection and market entry work, by the analysts who wrote this report.
See consulting servicesFrequently asked questions
USD 51.02 billion in 2026, up 22.26% from USD 41.73 billion in 2025, according to DC Market Insights estimates. The market is projected to reach USD 128.57 billion by 2035, a CAGR of 11.91% from 2025, as utilities energise new data center substations across the region.
USD 41.73 billion of 2025 spend on the physical facility of Asia Pacific data centers: electrical gear, cooling plant, and the civil, structural and architectural work of the shell and white space. Servers, storage, network switches, land, electricity and DCIM software are excluded.
11.91% a year from 2025 to 2035, from USD 41.73 billion to USD 128.57 billion, after 23.52% a year in 2020-2025, because the regional build cohort more than doubles to about 8.7 GW while facility cost per MW rises to USD 14.74 million.
Prefabricated and Modular builds, at 17.77% a year, from USD 7.51 billion in 2025 to USD 38.57 billion by 2035, because factory-built power skids and cooling plant shorten schedules on grid-limited sites such as Johor and western Sydney.
About USD 10.7 million per MW of IT capacity in 2025, in DC Market Insights estimates: USD 4.81 million electrical, USD 2.14 million mechanical and cooling, and USD 3.75 million civil and structural. The total rises to USD 14.74 million per MW by 2035.
South Asia, at 17.07% a year, from USD 4.17 billion in 2025 to USD 20.18 billion by 2035, because India’s capacity triples on hyperscale pledges above USD 32 billion. Greater China leads in 2025 with 47.20% of spend.
China, with USD 18.08 billion in 2025, 43.3% of the regional total, followed by Japan at USD 5.56 billion and India at USD 3.48 billion. India grows fastest among large countries, at 17.92% a year to USD 18.08 billion by 2035.
Vertiv leads with about 4.9% of 2025 spend, based on about USD 2.05 billion of Asia Pacific net sales; the five largest equipment suppliers hold about 21% (DC Market Insights estimate). Schneider Electric, ABB, Eaton, Huawei Digital Power and Delta Electronics also compete.
Scope: DC Market Insights counts USD 51.02 billion of 2026 facility infrastructure only. Broader figures add servers, storage and networking (USD 129.28 billion in 2025), land, on-site power plants or DCIM software, which are excluded here.
Infrastructure is the USD 41.73 billion physical plant of 2025: power trains, cooling and the building. Data center infrastructure management (DCIM) is the software that monitors that plant and is sized in a separate DC Market Insights report.
Get this report
How do I get the full report?
Request a quote; we reply by email within one business day.
How and when will I receive the report?
By email, within 24-48 business hours of payment.
How can I pay?
Once you accept the quote, we email you a secure payment link.
Can I see a sample first?
Yes. Request a free sample and we will email it to you.
Can the report be tailored to my needs?
Yes. We can add countries, segments or data cuts. Talk to an analyst about the scope you need.
Can I get an invoice or pay against a purchase order?
Write to sales@dcmarketinsights.com and our team will help.