
Data Center Containment Market Size, Share & Forecast to 2035
Market at a glance
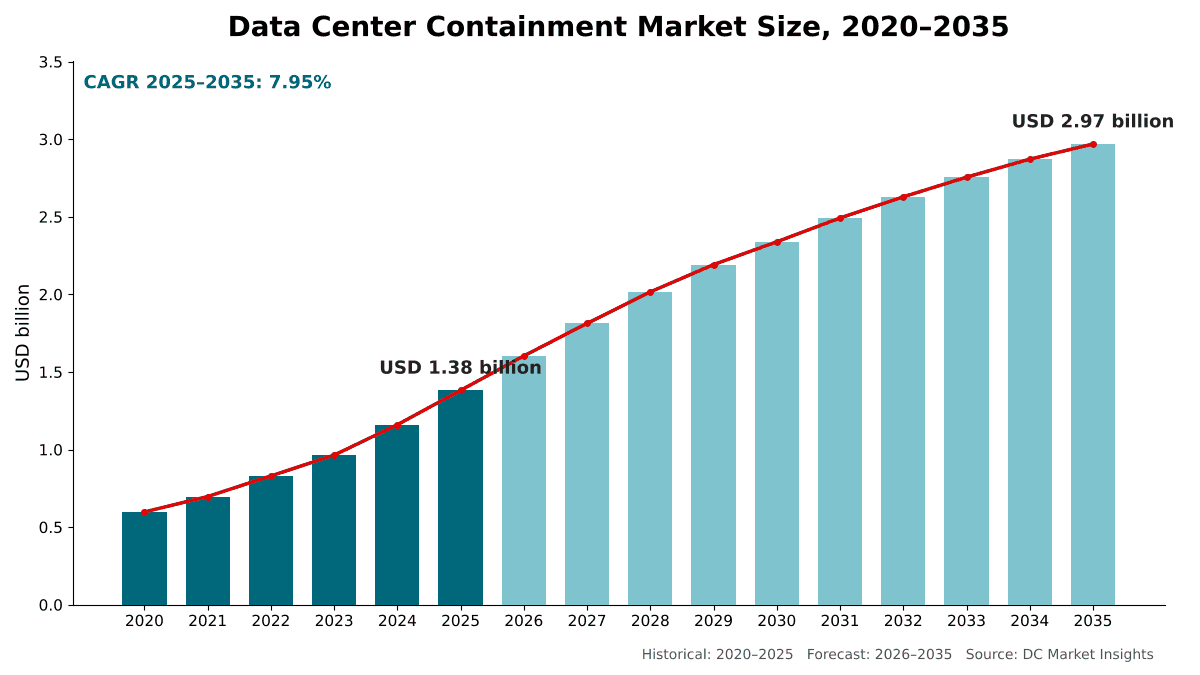
The Data Center Containment market was worth USD 1,380.0 million in 2025 and is forecast to reach USD 2,970.0 million by 2035, growing at a 7.95% CAGR. North America accounts for 41.8% of the market.
 By Satyabrat Rajawat, Senior Research Analyst, Strategic Advisory
 Reviewed by Deepti Agrawal
Last updated 7 Oct 2026
Base year 2025 PDF + Excel
Source: DC Market Insights analysis
Key findings
New Builds Account for USD 1.07 Billion, or 77.2% of 2025 Spending
Hot Aisle Containment Rises from 52.4% to 61.8% of Spending
Liquid Cooling Shrinks the Air Load per MW
GPU and Neocloud Operators Quadruple Their Containment Spend by 2035
What is inside the report
- 01Introduction
- 02Research Methodology
- 03Executive Summary
- 04Market Dynamics
- 05Pricing and Cost Analysis
- 06Standards and Regulation
- 07Supply Chain and Value Chain Analysis
- 08Global Data Center Containment Market Size and Forecast
- 09Market by Containment Type
- 10Market by Component
- 20chapters
- 2020-2024Historical period
- 2026-2035Forecast period
- 12Companies profiled
Regional insights
- North America41.8%
- Asia Pacific26.4%
- Europe21.6%
- Latin America5.3%
- Middle East and Africa4.9%
Segmentation
Companies profiled
- Schneider Electric
- Vertiv
- Legrand
- Eaton
- Rittal
- Chatsworth Products
- Panduit
- nVent
- Upsite Technologies
- Subzero Engineering
- Armstrong World Industries
- Emcor Enclosures
Recent developments
Schneider Electric launched new NetShelter Aisle Containment with up to 20% more cooling capacity (Source: Capacity Media news report).
the Worthington Armstrong Venture, owned by Armstrong World Industries and Worthington Enterprises, acquired the assets of Data Center Resources, a maker of modular aisle containment (Source: Worthington Armstrong Venture press release).
Legrand acquired Computer Room Solutions, a Sydney-based maker of data center ceilings and airflow containment with annual revenue of about EUR 30 million (Source: Data Center Dynamics news report).
Schneider Electric launched a Prefabricated Modular EcoStruxure Pod Data Center that supports hot aisle containment for pods up to 1 MW and beyond (Source: Schneider Electric press release).
Vertiv announced the acquisition of Great Lakes Data Racks & Cabinets, a Pennsylvania maker of racks and enclosures, for USD 200 million (Source: Data Center Dynamics news report).
Legrand reported 2025 datacenter sales of EUR 2.4 billion and listed new T-Series and Pro-Series cabinets and containment solutions among its launches (Source: Legrand annual results release).
Full analysis
The Data Center Containment Market covers the hot aisle, cold aisle and rack-level chimney systems that separate supply air from exhaust air in data center white space, together with their doors, roof and ceiling panels, frames, curtains, blanking panels and airflow accessories. DC Market Insights values the global Data Center Containment Market at USD 1.38 billion in 2025 and forecasts USD 2.97 billion by 2035, a CAGR of 7.95%. The 2025 value is built from the build itself: about 12.0 GW of new IT capacity, of which 82% of conventional halls and 95% of AI halls are contained, at roughly USD 120 thousand of containment per MW in conventional halls and USD 75 thousand per MW in AI halls, gives USD 1.07 billion of new-build spend, and retrofit and replacement work on an installed base of about 117 GW adds USD 314.71 million. Racks above 60 kW are the fastest-growing segment at 19.96% a year because every liquid-cooled AI pod still needs a contained hot aisle for its residual air load, and the Middle East and Africa is the fastest-growing region at 9.60% a year as new campuses start from a small installed base.
Executive Summary
The Global Data Center Containment Market size was valued at USD 597.67 million in 2020, reached USD 1.38 billion in 2025, and is anticipated to reach USD 2.97 billion by 2035, at a CAGR of 7.95% during the forecast period.
| Report attribute | Details |
|---|---|
| Historical Period | 2020-2024 |
| Base Year | 2025 |
| Forecast Period | 2026-2035 |
| Data Center Containment Market Size 2025 | USD 1.38 Billion |
| Data Center Containment Market, CAGR | 7.95% |
| Data Center Containment Market Size 2035 | USD 2.97 Billion |
The market grew at 18.24% a year between 2020 and 2025, and 2025 alone added 19.1% over 2024 as annual capacity additions rose from 9.8 GW to 12.0 GW and containment became standard practice in new halls rather than an energy-saving retrofit. Growth slows to 7.95% a year from 2025 to 2035 for a structural reason: AI halls run fewer, denser racks per MW and remove most of their heat through liquid loops, so containment spend per MW falls in AI halls even as the capacity built each year more than doubles to 27.0 GW by 2035.
Market Scope: What Does the Data Center Containment Market Cover?
The Data Center Containment Market covers every physical airflow separation system sold for data center white space, valued at first sale in current US dollars, with 2025 as the base year and forecasts to 2035. DC Market Insights sizes it at USD 1.38 billion in 2025.
Included. Hot aisle containment (HAC) and cold aisle containment (CAC) systems, both cabinet-supported and frame-supported; rack-level chimney containment and vertical exhaust ducts that carry exhaust air from a cabinet to a return plenum; sliding and swing doors; roof, ceiling and drop-out panels; frames, ceiling grids and support structures; curtain and strip (soft) containment; blanking panels, brush and floor grommets, cabinet-to-floor seals and other airflow accessories; and containment built into prefabricated pods.
Excluded. Racks and cabinets themselves, cooling units (computer room air handlers, in-row coolers, rear-door heat exchangers and coolant distribution units), liquid cooling loops, fire detection and suppression equipment, raised floor tiles, monitoring software and installation labor.
How the segments fit together. The containment-type, component, rack-density, data-center-type and deployment splits each re-cut the same USD 1.38 billion, so every split sums to the market total. New-build spend covers containment bought with a new hall; retrofit and replacement covers containment added to existing halls plus the blanking panels and seals that operators replace every year.
Market Drivers: What Drives the Data Center Containment Market?
Three drivers explain most of the growth in the Data Center Containment Market: capacity additions that rise from 12.0 GW to 27.0 GW a year by 2035, energy rules that turn airflow separation into a compliance tool, and rack densities that make uncontained rooms unworkable.
New Builds Account for USD 1.07 Billion, or 77.2% of 2025 Spending
The Data Center Containment Market is a build market first. BloombergNEF counted 23.1 GW of data center capacity under construction globally at the end of September 2025, across 831 sites, with 15.9 GW of it in the United States, and more than 3.8 GW of new IT capacity entered construction in the third quarter of 2025 alone (Source: BloombergNEF). DC Market Insights models annual completions rising from 12.0 GW in 2025 to 22.0 GW in 2030 and 27.0 GW in 2035, which lifts the installed base from about 117 GW to about 311 GW. New-build containment spend rises from USD 1.07 billion in 2025 to USD 2.16 billion in 2035.
Containment Cuts Cooling Energy Costs by as Much as 30%
DC Market Insights regards containment as one of the lowest-cost ways to lower a facility’s power usage effectiveness (PUE). The Energy Star program states that cold aisle containment can reduce cooling-related energy costs by as much as 30%, and cites an analysis finding that hot aisle containment can save 40% more than cold aisle containment (Source: Energy Star). Energy Star reports typical paybacks of less than two years for containment retrofits in the PG&E program, and Upsite Technologies puts the return on its modular AisleLok containment kit at 13.5 months for a 5,280 square foot room. Power demand behind those savings keeps rising: the International Energy Agency (IEA) estimates that data centers used 415 TWh of electricity in 2024, about 1.5% of world consumption, and expects around 945 TWh by 2030.
Rack Densities Above 30 kW Make Containment Mandatory
Uptime Institute’s 2026 global survey reports a growing number of operators with peak rack densities of 30 kW or higher, and Vertiv, citing Uptime survey data, notes that about one in eight data centers now run racks at 30 to 59 kW. DC Market Insights estimates that racks of 30 kW and above accounted for 24.3% of containment spend in 2025 and will account for 52.3% by 2035.
Market Trends: How Is Data Center Containment Changing?
The Data Center Containment Market is shifting from cold aisle retrofits toward hot aisle systems, from stand-alone panels toward pod-integrated structures, and from passive barriers toward actively controlled airflow.
Hot Aisle Containment Rises from 52.4% to 61.8% of Spending
Hot aisle containment returns exhaust air directly to the cooling units, which suits high return-air temperatures. DC Market Insights forecasts hot aisle containment to grow at 9.75% a year, from USD 723.90 million in 2025 to USD 1.83 billion in 2035, while cold aisle containment grows at 5.21% a year.
Containment Moves Into Prefabricated White-Space Pods
Vendors now sell containment as part of an engineered pod that also carries power busway, cabling trays and liquid cooling pipework. In June 2025, Schneider Electric launched a Prefabricated Modular EcoStruxure Pod Data Center that supports liquid cooling, power busway, complex cabling and hot aisle containment, for pods up to 1 MW and beyond (Source: Schneider Electric press release). Vertiv describes its SmartAisle as a containment solution that integrates racks, cooling, power and monitoring. Pods shift value toward frames and support structures, which DC Market Insights forecasts to grow at 9.19% a year, the fastest component group.
Active Airflow Control Replaces Passive Barriers
Containment is becoming a controlled system rather than a sheet-metal partition. Schneider Electric states that its NetShelter Aisle Containment provides up to 20% more cooling capacity, and that its airflow controller reduces fan energy use by up to 40% compared with traditional passive systems. Sensors and controllers add electronics content to each aisle, which supports price per aisle even as AI halls need fewer aisles per MW.
Market Challenges: What Holds the Data Center Containment Market Back?
Liquid cooling and fire-code complexity are the two constraints that DC Market Insights expects to slow the Data Center Containment Market, cutting spend per MW in AI halls from USD 75 thousand in 2025 to USD 60 thousand in 2035.
Liquid Cooling Shrinks the Air Load per MW
Direct-to-chip and immersion cooling remove most AI rack heat before it reaches the room air, leaving containment to handle the residual load. An AI hall also holds far fewer racks per MW: DC Market Insights assumes about 25 racks per MW at 40 kW each in 2025, against about 125 racks per MW at 8 kW in a conventional hall. Spend per rack is higher in AI halls, at about USD 3,000 against USD 960, but spend per MW is lower. The cooling side of that shift is covered in the Data Center Liquid Cooling Market report.
Fire Codes Add Cost and Design Time
Containment barriers sit between sprinklers and the racks they protect. The National Fire Protection Association (NFPA) standard NFPA 13 sets explicit rules for sprinklers around obstructions, and NFPA 72 smoke detector spacing covers rooms only up to 60 air changes per hour, a limit designers must check in contained aisles. Plastic drop-out ceiling panels that melt at around 135°F are designed around standard-response sprinklers, while data centers usually install quick-response heads, which is why fire engineers recommend quick-response sprinklers inside the contained aisle. DC Market Insights estimates that fire-rated panels, drop-out panels and added sprinkler heads raise the cost of each aisle and lengthen design reviews.
Market Opportunities: Where Are the New Revenue Pools?
The two largest new revenue pools in the Data Center Containment Market are graphics processing unit (GPU) and neocloud operators, growing at 15.51% a year, and retrofit and replacement work on an installed base that grows to about 311 GW by 2035.
GPU and Neocloud Operators Quadruple Their Containment Spend by 2035
Specialist GPU cloud operators spent USD 87.03 million on containment in 2025, and DC Market Insights expects their spend to reach USD 368.14 million in 2035, more than four times the 2025 level. They need hot aisle structures that carry rear-door heat exchangers, busway and manifolds, which favors suppliers of pre-engineered pod kits.
Retrofit and Replacement Spending Reaches USD 813.01 Million
About 35% of the installed base was still uncontained in 2025, according to DC Market Insights estimates, and operators keep replacing blanking panels, brush grommets and floor seals as racks are moved and refreshed. DC Market Insights models retrofit and replacement spending at USD 314.71 million in 2025 and USD 813.01 million in 2035, growing at 9.96% a year, faster than new builds at 7.29%, because the installed base grows faster than annual additions.
Pricing: How Much Do Data Centers Spend on Containment per MW?
A conventional data center hall spends about USD 120 thousand on containment per MW of IT load in 2025, and an AI hall spends about USD 75 thousand per MW. These are DC Market Insights estimates covering containment hardware at first sale, excluding labor, racks and cooling units.
| Containment spend per MW (USD thousand) | 2020 | 2025 | 2030 | 2035 |
|---|---|---|---|---|
| Conventional hall | 110 | 120 | 128 | 135 |
| AI hall | 90 | 75 | 66 | 60 |
| Share of conventional halls contained | 72% | 82% | 87% | 92% |
| AI share of new capacity | 3% | 35% | 60% | 66% |
Public list prices show the range of what buyers pay. An Eaton RapidPod aisle containment panel kit for a 16-foot aisle, including mounting hardware, seals and brackets, is listed by an online reseller at a regular price of USD 7,679.00 and a sale price of USD 4,895.99. Upsite Technologies compares an installed cost of USD 36,180 for its modular AisleLok containment kit with USD 70,993 for a legacy system in the same 5,280 square foot room, and annual energy savings of USD 32,172 against USD 35,520 at USD 0.10 per kWh. Conventional spend per MW rises about 1.2% a year; AI spend per MW falls about 2.2% a year as liquid cooling takes more of the heat load.
Standards and Regulation: Which Rules Shape Data Center Containment?
Four sets of rules decide how much containment a data center buys: thermal guidelines from the American Society of Heating, Refrigerating and Air-Conditioning Engineers (ASHRAE), European energy reporting, German PUE limits and fire codes.
ASHRAE thermal guidelines. The fifth edition of the ASHRAE Thermal Guidelines for Data Processing Environments recommends an inlet dry-bulb range of 18 to 27°C for equipment classes A1 to A4, and 18 to 22°C for the high-density class H1.
EU Delegated Regulation 2024/1364. Data centers with installed IT power demand of at least 500 kW must report their energy and sustainability indicators by 15 May each year; the first report was due by 15 September 2024 for calendar year 2023 (Source: Government of Ireland).
German Energy Efficiency Act (EnEfG). Data centers with a non-redundant nominal power connection of 300 kW or more must reach a sustained annual average PUE of 1.5 or lower from 1 July 2027 and 1.3 or lower from 1 July 2030, and new data centers operating from 1 July 2026 must reach 1.2 or lower. A draft amendment published on 9 April 2026 would raise the new-build target to 1.3 and ease the existing-site targets to 1.6 and 1.4, values still to be confirmed; it was still at ministerial draft stage (Source: Orrick legal analysis).
Fire codes. NFPA 13 governs sprinkler placement around containment barriers and NFPA 72 governs smoke detection, which together determine whether a design uses drop-out panels or sprinklers inside the aisle.
Market Segmentation: Which Segment Leads the Data Center Containment Market?
Hot aisle containment leads the Data Center Containment Market with 52.4% of 2025 value, hyperscale data centers lead buyers with 38.5%, and racks of 10 to 30 kW lead rack densities with 38.1%. Racks above 60 kW are the fastest-growing segment at 19.96% a year, from USD 117.43 million in 2025 to USD 724.41 million in 2035, because every liquid-cooled AI pod still needs a contained hot aisle for its residual air load.
By Containment Type: Hot Aisle Containment Leads with 52.4%
| Containment type | 2025 (USD billion) | Share 2025 | 2035 (USD billion) | CAGR 2025-2035 |
|---|---|---|---|---|
| Hot Aisle Containment | 0.72 | 52.4% | 1.83 | 9.75% |
| Cold Aisle Containment | 0.46 | 33.1% | 0.76 | 5.21% |
| Rack-Level Chimney Containment | 0.20 | 14.5% | 0.37 | 6.45% |
Hot aisle containment gains 9.4 points of share by 2035 because AI pods, hyperscale halls and slab-floor colocation designs all favor returning exhaust air through a ceiling plenum. Rack-level chimney containment, worth USD 200.31 million, suits small rooms and edge sites.
By Component: Blanking Panels and Airflow Accessories Lead with 25.9%
| Component | 2025 (USD billion) | Share 2025 | 2035 (USD billion) | CAGR 2025-2035 |
|---|---|---|---|---|
| Doors | 0.30 | 21.4% | 0.61 | 7.54% |
| Roof and Ceiling Panels | 0.34 | 24.8% | 0.77 | 8.42% |
| Frames and Support Structures | 0.25 | 18.2% | 0.61 | 9.19% |
| Curtains and Soft Containment | 0.13 | 9.7% | 0.22 | 4.93% |
| Blanking Panels and Airflow Accessories | 0.36 | 25.9% | 0.77 | 7.91% |
Blanking panels, grommets and seals are worth USD 357.80 million in 2025 because they are bought both with new systems and as recurring replacements. Curtains and soft containment, worth USD 134.00 million, grow slowest at 4.93% a year as fire codes and higher densities push buyers toward rigid panels.
By Rack Density: Racks of 10 to 30 kW Lead with 38.1%
| Rack density | 2025 (USD billion) | Share 2025 | 2035 (USD billion) | CAGR 2025-2035 |
|---|---|---|---|---|
| Below 10 kW | 0.52 | 37.6% | 0.48 | -0.77% |
| 10 to 30 kW | 0.53 | 38.1% | 0.94 | 5.92% |
| 30 to 60 kW | 0.22 | 15.8% | 0.83 | 14.27% |
| Above 60 kW | 0.12 | 8.5% | 0.72 | 19.96% |
By Data Center Type: Hyperscale Data Centers Lead with 38.5%
| Data center type | 2025 (USD billion) | Share 2025 | 2035 (USD billion) | CAGR 2025-2035 |
|---|---|---|---|---|
| Hyperscale Data Centers | 0.53 | 38.5% | 1.25 | 8.89% |
| Colocation Data Centers | 0.42 | 30.2% | 0.84 | 7.29% |
| Enterprise Data Centers | 0.31 | 22.1% | 0.41 | 3.06% |
| GPU and Neocloud Providers | 0.09 | 6.3% | 0.37 | 15.51% |
| Edge Data Centers | 0.04 | 2.9% | 0.10 | 9.35% |
Hyperscale operators spent USD 531.87 million in 2025 and colocation providers USD 417.21 million. Enterprise data centers grow slowest at 3.06% a year as workloads move to cloud and colocation, and edge data centers, worth USD 40.06 million, rely most on rack-level chimney systems.
By Deployment: Retrofit and Replacement Grows Faster at 9.96%
New-build containment is worth USD 1.07 billion (77.2%) in 2025 and USD 2.16 billion (72.6%) in 2035, growing at 7.29% a year. Retrofit and replacement work is worth USD 314.71 million (22.8%) in 2025 and grows at 9.96% a year to USD 813.01 million, as the installed base nearly triples and energy reporting pushes operators to contain older rooms.
DC Exclusive: The Containment Spend per MW Model and Type × Buyer Matrix
At USD 350.94 million in 2025, hyperscale hot aisle containment is the single largest cell of the matrix and 25.4% of all data center containment spending. The matrix cross-tabulates containment type by buyer. It is a DC Market Insights model, not a shipment count: it is built from 74 inputs: 32 capacity cohorts (16 years of conventional and AI halls), 2 spend-per-MW curves, 2 adoption curves, 4 installed-base rates (accessory spend, retrofit rate, uncontained share and retirement), 3 type splits, 5 component splits, 5 buyer splits, 4 rack-density splits, 5 regional splits and 12 country weights.
| 2025, USD million | Hot Aisle | Cold Aisle | Rack-Level Chimney | Total |
|---|---|---|---|---|
| Hyperscale Data Centers | 350.94 | 134.76 | 46.17 | 531.87 |
| Colocation Data Centers | 184.80 | 173.91 | 58.50 | 417.21 |
| Enterprise Data Centers | 109.80 | 120.47 | 75.04 | 305.31 |
| GPU and Neocloud Providers | 65.67 | 15.94 | 5.42 | 87.03 |
| Edge Data Centers | 12.69 | 12.19 | 15.18 | 40.06 |
| Total | 723.90 | 457.27 | 200.31 | USD 1.38 billion |
Hyperscale buyers spend 66.0% of their containment budget on hot aisle systems, and GPU and neocloud providers 75.5%, while enterprise data centers spend 39.5% on cold aisle systems and 24.6% on rack-level chimneys; a vendor strong only in cold aisle retrofit kits is selling into the slowest-growing buyer. Colocation spend is split almost evenly between hot aisle (44.3%) and cold aisle (41.7%) systems, so colocation is where suppliers that offer both win. Edge data centers spend 37.9% on rack-level chimney containment, the highest share of any buyer.
The containment spend per MW model behind these figures has two inputs that any reader can check: new capacity delivered each year (12.0 GW in 2025) and the share of it built for AI (35% in 2025). Multiplying each by its containment adoption rate and its spend per MW gives new-build spend; adding retrofit and replacement spend on the installed base gives the market. The model and its assumptions are explained on our research methodology page.
Regional Insights: Which Region Leads the Data Center Containment Market?
North America leads the Data Center Containment Market with 41.8% of 2025 value, and the Middle East and Africa is the fastest-growing region at 9.60% a year, because new campuses are adding capacity from a small installed base.
North America Leads with 41.8% Share
North American operators spent USD 577.46 million on containment in 2025, and the region is forecast to reach USD 1.15 billion in 2035, a CAGR of 7.18%. BloombergNEF counted 15.9 GW of the 23.1 GW under construction worldwide in the United States at the end of September 2025. North America loses 2.9 points of share by 2035 because more of its new halls are liquid-cooled AI campuses with lower containment spend per MW.
Asia Pacific Holds 26.4% Share
Asia Pacific is worth USD 364.71 million in 2025 and USD 899.58 million by 2035, a CAGR of 9.45%. DC Market Insights assumes a larger share of air-cooled colocation capacity in the region’s new builds, with higher containment content per MW, which is why Asia Pacific gains 3.9 points of share, the largest gain of any region.
Europe Holds 21.6% Share
Europe is worth USD 298.40 million in 2025 and USD 570.03 million by 2035, a CAGR of 6.69%. DC Market Insights models slower new-build growth in Europe than elsewhere, but EU energy reporting and German PUE limits make Europe the strongest retrofit market.
Latin America Holds 5.3% Share
Latin America is worth USD 73.22 million in 2025 and USD 175.17 million by 2035, a CAGR of 9.11%, led by Brazil, which accounts for 45.2% of the region in the DC Market Insights allocation.
Middle East and Africa Holds 4.9% Share
The Middle East and Africa is worth USD 67.69 million in 2025 and USD 169.23 million by 2035, growing fastest at 9.60% a year. DC Market Insights assumes higher containment content per MW in the region because hot climates reward tighter airflow separation and longer economizer hours.
Country Analysis: Which Countries Buy the Most Data Center Containment?
The United States is the largest country market for data center containment at USD 504.70 million in 2025, 36.5% of global value, followed by China at USD 135.67 million (9.8%) and Canada at USD 72.76 million (5.3%). The 12 largest countries account for 77.7% of 2025 spending.
| Rank | Country | Region | 2025 (USD billion) | Share 2025 | 2035 (USD billion) | CAGR 2025-2035 |
|---|---|---|---|---|---|---|
| 1 | United States | North America | 0.50 | 36.5% | 1.00 | 7.03% |
| 2 | China | Asia Pacific | 0.14 | 9.8% | 0.29 | 7.75% |
| 3 | Canada | North America | 0.07 | 5.3% | 0.16 | 8.16% |
| 4 | United Kingdom | Europe | 0.06 | 4.3% | 0.10 | 5.85% |
| 5 | Germany | Europe | 0.06 | 4.0% | 0.10 | 6.28% |
| 6 | Japan | Asia Pacific | 0.05 | 3.7% | 0.11 | 7.71% |
| 7 | India | Asia Pacific | 0.04 | 3.1% | 0.15 | 13.58% |
| 8 | Australia | Asia Pacific | 0.03 | 2.5% | 0.09 | 10.02% |
| 9 | France | Europe | 0.03 | 2.4% | 0.07 | 7.06% |
| 10 | Brazil | Latin America | 0.03 | 2.4% | 0.08 | 9.33% |
| 11 | Netherlands | Europe | 0.03 | 2.0% | 0.05 | 5.98% |
| 12 | Singapore | Asia Pacific | 0.02 | 1.6% | 0.05 | 8.22% |
India is the fastest-growing large country market at 13.58% a year, ahead of Australia at 10.02%, as hyperscale and colocation operators add air-cooled and hybrid capacity outside the established Asian hubs. The country figures are a DC Market Insights allocation of the regional totals, weighted by each country’s estimated share of installed and new data center capacity.
Forecast Scenarios: How Could the 2035 Forecast Change?
The Data Center Containment Market reaches USD 2.97 billion by 2035 in the base case, with a range of USD 2.78 billion to USD 3.25 billion across the low and high scenarios.
| Scenario | Assumption from 2026 | 2035 (USD billion) | CAGR 2025-2035 |
|---|---|---|---|
| Low | Capacity additions 15% below base; AI share of new capacity capped at 52% | 2.78 | 7.24% |
| Base | Additions rise to 27.0 GW a year; AI share reaches 66% | 2.97 | 7.95% |
| High | Additions 15% above base; AI share 6 points higher each year | 3.25 | 8.93% |
The range is narrow because the swing factors offset each other: fewer AI halls mean less capacity, but each conventional MW carries more containment, so the low case falls only 6.4% below the base. The high case assumes grid connections keep pace with announced hyperscale plans. The main technical swing factor is how much rack heat liquid cooling captures.
Competitive Insights: Who Leads the Data Center Containment Market?
- Schneider Electric
- Vertiv
- Legrand
- Eaton
- Rittal
- Chatsworth Products
- Panduit
- nVent
- Upsite Technologies
- Subzero Engineering
- Armstrong World Industries
- Emcor Enclosures
Schneider Electric leads the Data Center Containment Market with about 13% of 2025 value, and the three largest suppliers, Schneider Electric, Vertiv and Legrand, together hold about 32% (DC Market Insights estimate, based on the breadth of each supplier’s hot aisle, cold aisle and pod-integrated portfolio and its disclosed white-space activity; no supplier reports containment sales separately). Vertiv sells SmartAisle and bought rack maker Great Lakes Data Racks & Cabinets for USD 200 million in 2025. Legrand reported datacenter sales of EUR 2.4 billion in 2025, 26% of group sales, and added airflow containment capacity through the purchase of Computer Room Solutions in Australia. Eaton (RapidPod), Rittal, Chatsworth Products, Panduit (Net-Contain) and nVent compete on containment sold with their own cabinets, while Upsite Technologies (AisleLok) and Subzero Engineering specialize in containment. Armstrong World Industries and Worthington Enterprises expanded through their joint venture’s purchase of Data Center Resources, a maker of modular aisle containment.
Recent Developments
- In June 2024, Schneider Electric launched new NetShelter Aisle Containment with up to 20% more cooling capacity (Source: Capacity Media news report).
- In August 2024, the Worthington Armstrong Venture, owned by Armstrong World Industries and Worthington Enterprises, acquired the assets of Data Center Resources, a maker of modular aisle containment (Source: Worthington Armstrong Venture press release).
- In April 2025, Legrand acquired Computer Room Solutions, a Sydney-based maker of data center ceilings and airflow containment with annual revenue of about EUR 30 million (Source: Data Center Dynamics news report).
- In June 2025, Schneider Electric launched a Prefabricated Modular EcoStruxure Pod Data Center that supports hot aisle containment for pods up to 1 MW and beyond (Source: Schneider Electric press release).
- In July 2025, Vertiv announced the acquisition of Great Lakes Data Racks & Cabinets, a Pennsylvania maker of racks and enclosures, for USD 200 million (Source: Data Center Dynamics news report).
- In February 2026, Legrand reported 2025 datacenter sales of EUR 2.4 billion and listed new T-Series and Pro-Series cabinets and containment solutions among its launches (Source: Legrand annual results release).
We follow these deals, launches and capacity announcements as they happen in our data center industry updates.
Methodology: How We Built the Data Center Containment Market Model
DC Market Insights built this market bottom-up from 16 annual capacity cohorts (2020 to 2035), each split into conventional and AI halls, multiplied by a containment adoption rate (72% of conventional halls in 2020, 82% in 2025 and 92% in 2035; 95% of AI halls) and a containment spend per MW. Retrofit and replacement spending was added on the installed base: accessory replacement at USD 1,800 per installed MW a year in 2025, plus conversion of 3% of the uncontained base each year at retrofit cost. Because no company discloses containment sales, the result is a DC Market Insights model with bound checks rather than a single top-down check. Floor: aisle containment panel kits alone for the 2025 contained conventional capacity, at the Eaton RapidPod sale price of USD 4,895.99 per 16-foot kit, assuming 125 racks per MW and 16 racks per kit, come to USD 244.65 million, below the modeled USD 1.07 billion of new-build spend. Ceiling one: new-build containment equals 1.6% of the USD 65.60 billion that DC Market Insights estimates for the Data Center Construction Market in 2025, below the 2% ceiling DC Market Insights sets for white-space airflow hardware. Ceiling two: the implied containment revenue of Legrand, one of the three leaders at about 9% share, is about 5% of its EUR 2.4 billion of 2025 datacenter sales even before currency conversion, consistent with containment being a small line in a broad white-space portfolio. Every split (3 containment types, 5 components, 4 rack-density classes, 5 data center types, 2 deployment types, 5 regions) sums to the market total. The analyst named on this page built the model, and the reviewer checked the arithmetic, the sources and the dates before publication.
Table of contents
- 01Introduction
- 1.1Market Definition and Scope
- 1.2Containment Types, Components, Buyers and Regions Covered
- 1.3Currency, Base Year and Forecast Period
- 1.4Key Questions Answered
- 02Research Methodology
- 2.1Containment Spend per MW Model
- 2.2Capacity Cohorts: Conventional and AI Halls
- 2.3Retrofit and Replacement Spending Model
- 2.4Bound Checks: Price Floor and Construction Ceiling
- 2.5Assumptions and Limitations
- 03Executive Summary
- 3.1Market at a Glance, 2020-2035
- 3.2Key Findings
- 3.3Analyst Recommendations by Buyer Type
- 04Market Dynamics
- 4.1Drivers
- 4.2Challenges and Restraints
- 4.3Opportunities
- 4.4Trends
- 4.5Impact Analysis of Drivers and Challenges, 2025-2035
- 05Pricing and Cost Analysis
- 5.1Containment Spend per MW: Conventional vs AI Halls, 2020-2035
- 5.2Containment Spend per Rack: Conventional vs AI Halls
- 5.3Public List Prices for Containment Kits
- 5.4Payback and Energy Savings
- 06Standards and Regulation
- 6.1ASHRAE Thermal Guidelines
- 6.2EU Delegated Regulation 2024/1364
- 6.3German Energy Efficiency Act (EnEfG)
- 6.4Fire Codes: NFPA 13 and NFPA 72
- 07Supply Chain and Value Chain Analysis
- 7.1Sheet Metal, Polycarbonate and Frame Suppliers
- 7.2Containment Manufacturers and Rack Vendors
- 7.3Distribution, Integrators and Installers
- 7.4Pod Integration and Prefabrication
- 08Global Data Center Containment Market Size and Forecast
- 8.1Market Size, 2020-2024
- 8.2Market Size, 2025
- 8.3Market Forecast, 2026-2035
- 8.4New-Build vs Retrofit and Replacement Spending
- 09Market by Containment Type
- 9.1Hot Aisle Containment
- 9.2Cold Aisle Containment
- 9.3Rack-Level Chimney Containment
- 10Market by Component
- 10.1Doors
- 10.2Roof and Ceiling Panels
- 10.3Frames and Support Structures
- 10.4Curtains and Soft Containment
- 10.5Blanking Panels and Airflow Accessories
- 11Market by Rack Density
- 11.1Below 10 kW
- 11.210 to 30 kW
- 11.330 to 60 kW
- 11.4Above 60 kW
- 12Market by Data Center Type
- 12.1Hyperscale Data Centers
- 12.2Colocation Data Centers
- 12.3Enterprise Data Centers
- 12.4GPU and Neocloud Providers
- 12.5Edge Data Centers
- 13Market by Deployment
- 13.1New Build
- 13.2Retrofit and Replacement
- 14DC Exclusive: Containment Type × Buyer Matrix
- 14.1Containment Type × Data Center Type Matrix, 2025
- 14.2Containment Spend per MW Model
- 14.3Implications for Suppliers
- 15Market by Region
- 15.1North America (United States, Canada)
- 15.2Europe (United Kingdom, Germany, France, Netherlands, Rest of Europe)
- 15.3Asia Pacific (China, Japan, India, Australia, Singapore, Rest of Asia Pacific)
- 15.4Latin America (Brazil, Rest of Latin America)
- 15.5Middle East and Africa
- 15.6Top 12 Countries, 2025 and 2035
- 16Regional Cross-Sections
- 16.1Regional Shares, 2025 and 2035
- 16.2Regional Growth Comparison, 2025-2035
- 17Forecast Scenarios
- 17.1Base, Low and High Cases to 2035
- 17.2Sensitivity to AI Share of New Capacity
- 17.3Sensitivity to Capacity Additions
- 18Competitive Landscape
- 18.1Estimated Market Share of Leading Suppliers, 2025
- 18.2Top-Three Concentration
- 18.3Acquisitions, 2024-2026
- 18.4Product Launches
- 19Company Profiles
- 19.1Schneider Electric
- 19.2Vertiv
- 19.3Legrand
- 19.4Eaton
- 19.5Rittal
- 19.6Chatsworth Products
- 19.7Panduit
- 19.8nVent
- 19.9Upsite Technologies
- 19.10Subzero Engineering
- 19.11Armstrong World Industries
- 19.12Emcor Enclosures
- 20Analyst Recommendations
- 20.1For Containment and Rack Suppliers
- 20.2For Hyperscale and Colocation Operators
- 20.3For Investors
- Fig. 1Data Center Containment Market Size, 2020-2035
- Fig. 2New Data Center Capacity Added per Year, Conventional vs AI, 2020-2035
- Fig. 3Containment Spend per MW, Conventional vs AI Halls, 2020-2035
- Fig. 4New-Build vs Retrofit and Replacement Spending, 2020-2035
- Fig. 5Market Share by Containment Type, 2025 and 2035
- Fig. 6Market Share by Rack Density, 2025 and 2035
- Fig. 7Containment Type × Data Center Type Matrix, 2025
- Fig. 8Market by Region, 2025 and 2035
- Fig. 9Top 12 Countries, 2025
- Fig. 10Forecast Scenarios, 2025-2035
- Table 1Report Attributes
- Table 2Containment Spend per MW, 2020-2035
- Table 3Market by Containment Type, 2025 and 2035
- Table 4Market by Component, 2025 and 2035
- Table 5Market by Rack Density, 2025 and 2035
- Table 6Market by Data Center Type, 2025 and 2035
- Table 7Market by Deployment, 2025 and 2035
- Table 8Containment Type × Data Center Type Matrix, 2025
- Table 9Market by Region, 2025 and 2035
- Table 10Top 12 Countries, 2025 and 2035
- Table 11Forecast Scenarios, 2035
- Table 12Acquisitions and Product Launches, 2024-2026
- Table 13Company Profiles: Products and Data Center Focus
About this report
Written by Satyabrat Rajawat and reviewed by Deepti Agrawal, Senior Editor, Research. Figures are built top-down and bottom-up and reconciled before publication, with 2025 as the base year.
Read our methodologyHow we built this
- Historical period2020-2024
- Base year2025
- Forecast period2026-2035
- Sizing approachTop-down + bottom-up
Need more than the report?
Advisory on this market
Due diligence, site selection and market entry work, by the analysts who wrote this report.
See consulting servicesFrequently asked questions
USD 1.38 billion in 2025, rising to USD 2.97 billion by 2035. DC Market Insights estimates the market at USD 597.67 million in 2020.
7.95% a year from 2025 to 2035. Growth was faster, at 18.24% a year, between 2020 and 2025 as containment became standard in new halls.
Hot aisle containment, with USD 723.90 million or 52.4% of the market in 2025. It is also the fastest-growing type at 9.75% a year.
About USD 120 thousand per MW for a conventional hall and USD 75 thousand per MW for an AI hall in 2025, according to DC Market Insights estimates of containment hardware excluding labor.
North America, with USD 577.46 million or 41.8% of 2025 value. The Middle East and Africa grows fastest at 9.60% a year.
Schneider Electric leads with about 13% of the market, and Schneider Electric, Vertiv and Legrand together hold about 32% (DC Market Insights estimate). Eaton, Rittal, Chatsworth Products, Panduit, nVent, Upsite Technologies and Subzero Engineering also compete.
Hyperscale data centers, with USD 531.87 million or 38.5% of 2025 demand. GPU and neocloud providers grow fastest at 15.51% a year.
USD 504.70 million in the United States, or 36.5% of 2025 spending, followed by China at USD 135.67 million. India grows fastest among large country markets at 13.58% a year (DC Market Insights estimate).
Licences, delivery and payment
Which licence should I choose?
Single User is a view-only PDF for one person. Multi User adds a printable PDF and the Excel data for unlimited users at one location. Enterprise covers your whole company and includes 100 free analyst hours.
How and when will I receive the report?
By email, within 24–48 business hours of payment, in the formats of your licence.
How can I pay?
Securely through PayPal: with a PayPal account, a debit or credit card, or PayPal Pay Later where available. Prices are in US dollars.
Can I see a sample first?
Yes. Request a free sample and we will email it to you.
Can the report be tailored to my needs?
Yes. We can add countries, segments or data cuts. Talk to an analyst about the scope you need.
Can I get an invoice or pay against a purchase order?
Write to sales@dcmarketinsights.com and our team will help.