
Data Center Facility Management O&M Services Market Size, Share & Forecast to 2035
Market at a glance
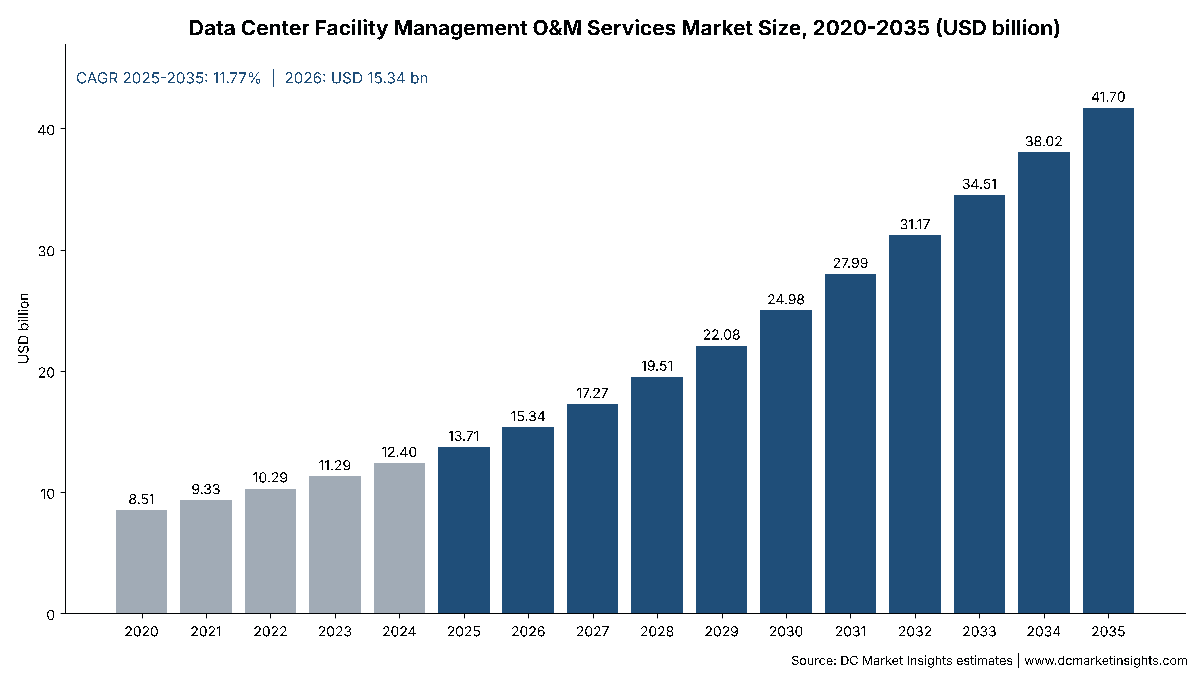
The Data Center Facility Management O&M Services market was worth USD 13.71 billion in 2025 and is forecast to reach USD 41.70 billion by 2035, growing at a 11.77% CAGR.
 By Amit Jain, Senior Consultant, ICT & Emerging Technologies
 Reviewed by Deepti Agrawal
Last updated 18 Oct 2026
Base year 2025 PDF + Excel
Reviewed by Deepti Agrawal
Last updated 18 Oct 2026
Base year 2025 PDF + Excel
Key findings
Not Enough Shift Engineers for 311 GW
What is inside the report
- 01Introduction
- 02Research Methodology
- 03Executive Summary
- 04What Is Data Center Facility Management and O&M?
- 05Why Do Data Center Facility Management O&M Services Market Estimates Differ?
- 06Market Drivers
- 07Market Trends
- 08Market Challenges
- 09Market Opportunities
- 10Pricing Analysis: O&M Cost per MW
- 21chapters
- 2020-2024Historical period
- 2026-2035Forecast period
- —Companies profiled
Segmentation
Recent developments
Vertiv agreed to acquire King Environmental Services, a Europe-based fluid management provider (Source: Vertiv).
Mitie reported fiscal 2026 revenue of GBP 5,619 million, up 10.5%, citing data centre engineering projects as a growth driver (Source: Mitie results).
ABM Industries reported first-quarter fiscal 2026 Technical Solutions revenue of USD 229.7 million, up 13.6%, on mission-critical and data center demand (Source: ABM Industries).
EMCOR Group reported 2025 revenue of USD 16.99 billion, up 16.6% (Source: EMCOR Group filing).
Vertiv launched Vertiv Next Predict, an AI-powered predictive maintenance managed service for data centers (Source: Vertiv).
Vertiv completed its approximately USD 1.0 billion acquisition of PurgeRite (Source: Vertiv).
Full analysis
The Data Center Facility Management O&M Services Market is valued at USD 15.34 billion in 2026 and is projected to reach USD 41.70 billion by 2035, up from USD 13.71 billion in 2025, a CAGR of 11.77% from 2025 to 2035 (DC Market Insights estimate). Unlike construction-linked markets, this spending follows the installed base: every operating megawatt (MW) of information technology (IT) load pays for engineers, maintenance visits and fluid checks every year, and DC Market Insights puts that bill at about USD 118,200 per MW in 2025 across 116 gigawatts (GW) of installed capacity. The mix is changing because, by DC Market Insights estimates, artificial intelligence (AI) halls cost about USD 145,000 per MW a year to run against USD 115,000 for a conventional hall, mostly because direct-to-chip liquid cooling loops need flushing, filtration and coolant chemistry work that air-cooled rooms never needed; Vertiv paid about USD 1.0 billion for the flushing specialist PurgeRite in December 2025 to own that work. Labour is the other lever: according to the United States Bureau of Labor Statistics (BLS), the median electrician wage was USD 63,190 in May 2025, and wages for the trades that staff data center shifts set the floor under every contract price. Mechanical and cooling maintenance is the fastest-growing service at 13.36% a year, and the Middle East and Africa is the fastest-growing region at 15.38% a year as gigawatt AI campuses in Saudi Arabia and the United Arab Emirates (UAE) move from construction into 24/7 operation.
Key Market Statistics: How Big Is the Data Center Facility Management O&M Services Market in 2026?
DC Market Insights values the Data Center Facility Management O&M Services Market at USD 15.34 billion in 2026, 11.9% above the USD 13.71 billion of 2025.
- Market size 2025: USD 13.71 billion
- Market size 2026: USD 15.34 billion
- Market size 2030: USD 24.98 billion
- Market size 2035: USD 41.70 billion
- CAGR 2025-2035: 11.77% in the base case, 10.02% in the low case and 13.17% in the high case
- Largest service type: critical facility operations, 30.8% of 2025 value (USD 4.23 billion)
- Fastest-growing service type: mechanical and cooling maintenance, 13.36% a year to USD 12.21 billion in 2035
- Largest contract model: bundled critical O&M contracts, 44.0% of 2025 value
- Leading region: North America, 42.0% of 2025 value (USD 5.76 billion)
- Fastest-growing region: Middle East and Africa, 15.38% a year
- Largest country: the United States, USD 5.29 billion in 2025 (38.6% of global value)
- Market leaders: Vertiv, Schneider Electric, Johnson Controls, CBRE Group (CBRE) and Jones Lang LaSalle (JLL) among the largest providers, with ABM Industries (ABM) and EMCOR Group (EMCOR) growing their mission-critical work (DC Market Insights assessment)
Executive Summary
The Global Data Center Facility Management O&M Services Market size was valued at USD 8.51 billion in 2020, reached USD 13.71 billion in 2025, and is anticipated to reach USD 41.70 billion by 2035, at a CAGR of 11.77% during the forecast period.
| Report attribute | Details |
|---|---|
| Historical Period | 2020-2024 |
| Base Year | 2025 |
| Forecast Period | 2026-2035 |
| Data Center Facility Management O&M Services Market Size 2025 | USD 13.71 Billion |
| Data Center Facility Management O&M Services Market Size 2026 | USD 15.34 Billion |
| Data Center Facility Management O&M Services Market, CAGR | 11.77% |
| Data Center Facility Management O&M Services Market Size 2035 | USD 41.70 Billion |
Spending grew 10.02% a year between 2020 and 2025 as installed IT capacity rose from 80 GW to 116 GW, and it speeds up to 11.77% a year to 2035 for two reasons. First, the installed base almost triples to 311 GW, because annual completions climb from 12.0 GW in 2025 to 27.0 GW in 2035 and data centers stay in service for decades. Second, AI halls rise from 12.35 GW, or 10.6% of installed capacity in 2025, to 136.98 GW, or 44.0%, in 2035, and each of those MW costs about 26% more to operate and maintain than a conventional MW. The blended outsourced O&M bill rises from USD 106,300 per MW in 2020 to USD 134,100 per MW in 2035.
What Is Data Center Facility Management and O&M, and What Does This Market Include?
Data center facility management and operations and maintenance (O&M) is the outsourced work that keeps the power, cooling and building systems of an operating data center running, worth USD 13.71 billion in 2025 by DC Market Insights estimates.
Included: on-site critical facility operations (shift engineers, critical environment managers, control-room staff and change management); planned, predictive and corrective maintenance of switchgear, uninterruptible power supply (UPS) systems, batteries, generators, transfer switches and busways; maintenance of chillers, computer room air handlers, cooling towers and pumps; liquid cooling services such as coolant distribution unit (CDU) maintenance, loop flushing, filtration and fluid testing; and building and soft services inside the secure perimeter, including critical cleaning, grounds, waste and pest control. Integrated facility management (IFM) contracts are counted for their data center share.
Excluded: commissioning and third-party certification (covered in the Data Center Testing Inspection Certification Market), renovation and retrofit projects (the Data Center Renovation Market), IT hardware support and managed hosting, security guarding, energy bills, spare-parts sales without labour, and work done by an operator’s own employees.
How the segments fit together: every dollar is counted once by service type, once by contract model and once by data center type; each dimension sums to the market total in every year, and the regional and country tables use the same totals.
Why Do Data Center Facility Management O&M Services Market Estimates Differ?
Estimates differ because “facility management” can mean anything from a cleaning contract to a full outsourced operations team; DC Market Insights counts USD 15.34 billion of outsourced data center facility O&M in 2026.
Broader definitions add IT hardware maintenance, managed hosting and remote infrastructure management, which the Managed Data Center Services Market covers, or they add colocation rent, as in the Data Center Outsourcing Market. Some also add the wages of an operator’s in-house engineers, commissioning fees and data center infrastructure management (DCIM) software licences. Narrower definitions count only soft services such as cleaning, or only one equipment maker’s service contracts. DC Market Insights keeps the outsourced facility view and checks it against the facility management and critical infrastructure maintenance lines of the DC Market Insights (DCMI) managed-services model; the bottom-up figure sits 2.3% below them.
| Element | In this report | Why |
|---|---|---|
| Critical facility operations staffing | Yes (USD 4.23 billion in 2025) | Outsourced engineers who run the site 24/7 |
| Electrical, mechanical and liquid cooling maintenance | Yes (USD 7.63 billion) | Planned and corrective work on facility systems |
| Building and soft services | Yes (USD 1.86 billion) | Critical cleaning and site services inside the perimeter |
| IT hardware support and managed hosting | No | IT services, not the facility |
| Commissioning and certification | No | One-off verification, counted in a separate DCMI report |
| In-house operator staff | No | Not a purchased service |
Out of scope in prose as well: IT hardware maintenance, managed hosting, commissioning, security guarding, energy supply and in-house staff costs. In-scope buyers include hyperscale cloud providers, colocation operators, enterprises, governments and small and medium-sized enterprises (SMEs) whose server rooms sit in outsourced corporate facilities.
What Is Driving Demand for Data Center Facility Management and O&M Services?
Liquid cooling, trade wages and hyperscale outsourcing drive demand, and DC Market Insights expects them to lift outsourced O&M per installed MW from USD 118,200 in 2025 to USD 134,100 in 2035.
Liquid Cooling Loops Create a New Fluid-Service Line
Direct-to-chip loops must be flushed, filtered and tested before and after IT is installed, and their coolant chemistry is checked for the life of the hall. Vertiv completed its approximately USD 1.0 billion acquisition of PurgeRite, a provider of mechanical flushing, purging and filtration services for data centers, in December 2025, and in September 2026 agreed to buy King Environmental Services, a fluid management provider in Europe. DC Market Insights prices liquid cooling service at USD 20,000 per AI MW a year in 2025, which puts the 2025 fluid-service line at USD 247.00 million.
Trade Wages Set the Price of Every Shift
About 31% of outsourced O&M value is staffing, so wages pass straight into contract prices. The BLS reports a median electrician wage of USD 63,190 in May 2025 and projects electrician employment to grow 9% from 2025 to 2035, while heating, air conditioning and refrigeration (HVACR) mechanics earned a median USD 61,010 with 11% projected job growth. Data center operators compete for the same trades as construction contractors, which is why DC Market Insights raises conventional O&M spend from USD 105,000 per MW in 2020 to USD 120,000 per MW in 2035.
Hyperscale and Colocation Operators Outsource More of the Site
Large operators keep design and standards in-house and buy the daily operation of each campus from service firms. ABM Industries said in March 2026 that its Technical Solutions revenue rose 13.6% to USD 229.7 million in the first quarter of fiscal 2026 on strong demand for mission-critical and data center services, and EMCOR Group linked growth in its Network and Communications sector to continued investment in data center infrastructure. Bundled critical O&M contracts, which cover power, cooling and operations under one provider, rise from 44.0% of value in 2025 to 48.0% in 2035.
How Is Data Center O&M Work Changing?
Maintenance is shifting from fixed calendars to data-driven visits, and DC Market Insights expects mechanical and cooling maintenance to overtake electrical maintenance by 2035, at USD 12.21 billion against USD 11.84 billion.
Predictive Maintenance Sold as a Managed Service
Vertiv launched Vertiv Next Predict in January 2026, an AI-powered managed service that predicts failures in power and cooling equipment and schedules work before an alarm. Predictive programmes cut visits to healthy equipment and add analysis hours, which keeps electrical maintenance growth at 11.07% a year, below the 11.77% of the whole market.
Mechanical Contractors Move into Long-Term Service
Comfort Systems USA reported USD 9.10 billion of 2025 revenue, with technology customers at about 45% of the total, and Johnson Controls reported a USD 14.9 billion Systems and Services backlog, up 13% organically, while citing its position in data center cooling. Firms that install cooling plants increasingly keep the maintenance contract for the life of the asset, which supports mechanical and cooling maintenance growth of 13.36% a year.
Integrated Facility Management Wins Enterprise and Edge Sites
Integrated facility management providers bundle data center rooms into wider building contracts; Mitie reported fiscal 2026 revenue of GBP 5,619 million, up 10.5%, and named data centre engineering projects as a significant growth driver. IFM grows fastest of the three contract models at 13.20% a year, from USD 3.02 billion in 2025 to USD 10.43 billion in 2035.
Market Restraints: What Holds Back Data Center Facility Management and O&M Services?
Staff shortages and the higher cost of AI halls are the main constraints, and DC Market Insights estimates that critical facility operations alone need about USD 36,400 of staffing per installed MW in 2025.
Not Enough Shift Engineers for 311 GW
At USD 36,400 per MW and a loaded cost near USD 100,000 per technician, the 2025 operations line implies about 0.36 outsourced staff per MW, or roughly 42,000 people worldwide. Holding that ratio while capacity grows to 311 GW would need well over 100,000, while BLS projects only 9% to 11% job growth for electricians and HVACR mechanics over the same decade. Staffing value still grows 11.61% a year, faster than the 10.37% yearly rise in installed MW, because wages climb; providers use remote monitoring and predictive maintenance to keep headcount growth below that rate.
Fixed-Price Contracts Meet Rising Per-MW Costs
An AI hall costs USD 145,000 per MW a year to maintain in 2025 against USD 115,000 for a conventional hall, and multi-year contracts signed on conventional rates squeeze provider margins when tenants densify. Liquid cooling failures can also take whole rows offline, so insurers and operators ask for tighter response times, which raises the price of every service level.
Where Are the Growth Opportunities in Data Center O&M?
Liquid cooling service and the Middle East and Africa offer the fastest-growing revenue pools, together adding about USD 4.79 billion between 2025 and 2035 (DC Market Insights estimate).
Liquid Cooling Service: USD 3.29 Billion by 2035
DC Market Insights values liquid cooling service at USD 3.29 billion in 2035, as AI capacity grows elevenfold, from 12.35 GW to 136.98 GW. Fluid testing, filter changes, CDU overhauls and leak response repeat every year, and few providers have trained crews today, so early entrants can price on scarcity.
Middle East and Africa: The Fastest-Growing Region at 15.38%
The stc and HUMAIN joint venture plans data centers hosting up to 1 GW of AI workloads in Saudi Arabia, and the first 200 MW of the Stargate UAE cluster is expected to go live in 2026. O&M spending in the Middle East and Africa rises from USD 548.42 million in 2025 to USD 2.29 billion in 2035, growing 15.38% a year, because most new operators there buy their operations teams from international providers.
How Much Does Data Center Facility Management Cost per MW?
DC Market Insights estimates outsourced facility O&M at USD 115,000 per MW a year for a conventional hall and USD 145,000 per MW for an AI hall in 2025, a blended USD 118,200 per installed MW.
| Year | Conventional hall (USD per MW a year) | AI hall (USD per MW a year) | Blended (USD per installed MW a year) | Installed IT capacity (GW) |
|---|---|---|---|---|
| 2020 | 105,000 | 140,000 | 106,300 | 80 |
| 2025 | 115,000 | 145,000 | 118,200 | 116 |
| 2030 | 118,000 | 150,000 | 127,400 | 196 |
| 2035 | 120,000 | 152,000 | 134,100 | 311 |
Public price anchors: wages for the trades on site, from BLS (USD 63,190 for electricians and USD 61,010 for HVACR mechanics in May 2025), and the size of large provider service books, such as Vertiv’s USD 1.84 billion of 2025 services sales. The blended rate equals about 1.1% a year of the USD 10.7 million per MW cost of building a facility, inside the 1% to 3% a year that facility owners commonly budget for maintenance of mechanical and electrical plant.
Which Standards and Rules Shape Data Center O&M?
Six rule sets shape the work, and DC Market Insights links USD 4.15 billion of 2025 electrical maintenance spending most directly to them.
- NFPA 70B (2023 edition): the National Fire Protection Association (NFPA) Standard for Electrical Equipment Maintenance, which requires a documented electrical maintenance program.
- Delegated Regulation (EU) 2024/1364: annual energy and water reporting for data centres with at least 500 kW of installed IT power, which needs metered data kept by the operations team.
- Germany’s Energy Efficiency Act (Energieeffizienzgesetz, EnEfG): power usage effectiveness (PUE) of 1.5 or lower for existing sites from 1 July 2027.
- China’s 2024 data center green action plan: PUE within 1.25 for new and renovated large sites by the end of 2025.
- Japan’s Ministry of Economy, Trade and Industry (METI) benchmark of PUE 1.4 or lower by fiscal year 2030, and Singapore’s Infocomm Media Development Authority (IMDA) Green Data Centre Roadmap.
- ISO 41001 facility management systems and EN 50600 operational processes, used by owners to specify and audit O&M contracts.
Each efficiency target turns into operations work: tuning cooling set points, logging PUE and keeping plant in its design range are tasks for the site team, not the builder.
Which Segment Leads the Data Center Facility Management O&M Services Market?
Critical facility operations leads with USD 4.23 billion, or 30.8% of 2025 value, while mechanical and cooling maintenance grows fastest at 13.36% a year.
By Service Type: Critical Facility Operations Leads with 30.8%
Operations staffing narrowly leads electrical and power systems maintenance at USD 4.15 billion; mechanical and cooling maintenance, which includes liquid cooling service, grows to USD 12.21 billion by 2035.
| Service type | 2025 (USD million) | Share 2025 | 2035 (USD million) | CAGR 2025-2035 |
|---|---|---|---|---|
| Critical Facility Operations | 4,225.40 | 30.8% | 12,676.92 | 11.61% |
| Electrical and Power Systems Maintenance | 4,146.45 | 30.2% | 11,843.86 | 11.07% |
| Mechanical and Cooling Maintenance | 3,482.65 | 25.4% | 12,206.58 | 13.36% |
| Building and Soft Services | 1,856.00 | 13.5% | 4,976.00 | 10.36% |
By Contract Model: Bundled Critical O&M Leads with 44.0%
Bundled contracts take USD 6.03 billion in 2025; single-service contracts, often sold by equipment makers for their own UPS or chiller fleets, grow slowest at 9.22% a year.
| Contract model | 2025 (USD million) | Share 2025 | 2035 (USD million) | CAGR 2025-2035 |
|---|---|---|---|---|
| Bundled Critical O&M Contracts | 6,032.62 | 44.0% | 20,017.61 | 12.74% |
| Single-Service Maintenance Contracts | 4,661.57 | 34.0% | 11,259.91 | 9.22% |
| Integrated Facility Management | 3,016.31 | 22.0% | 10,425.84 | 13.20% |
By Data Center Type: Hyperscale and AI Data Centers Lead with 38.0%
Hyperscale and AI data centers spend USD 5.21 billion in 2025 and grow fastest at 15.33% a year; enterprise sites grow only 5.57% a year as workloads move to cloud and colocation.
| Data center type | 2025 (USD million) | Share 2025 | 2035 (USD million) | CAGR 2025-2035 |
|---|---|---|---|---|
| Hyperscale and AI Data Centers | 5,209.99 | 38.0% | 21,685.75 | 15.33% |
| Colocation Data Centers | 4,661.57 | 34.0% | 12,511.01 | 10.38% |
| Enterprise Data Centers | 3,153.41 | 23.0% | 5,421.44 | 5.57% |
| Edge Data Centers | 685.52 | 5.0% | 2,085.17 | 11.77% |
DC Exclusive: AI Hall O&M Cost Teardown, USD 145,000 per MW a Year
The DC Market Insights O&M cost teardown is a modelled estimate built from 15 inputs (five service lines for conventional and AI halls, the installed base and its AI share); it shows an AI hall costing USD 30,000 more per MW a year to operate than a conventional hall in 2025.
| Service line (USD thousand per MW a year) | Conventional hall 2025 | AI hall 2025 | Conventional hall 2035 | AI hall 2035 |
|---|---|---|---|---|
| Electrical and power systems maintenance | 35 | 42 | 35 | 42 |
| Mechanical and air-side cooling maintenance | 28 | 27 | 30 | 27 |
| Liquid cooling loop and fluid service | 0 | 20 | 0 | 24 |
| Critical facility operations staffing | 36 | 40 | 39 | 43 |
| Building and soft services | 16 | 16 | 16 | 16 |
| Total | 115 | 145 | 120 | 152 |
Two-thirds of the AI premium comes from cooling: liquid loops add USD 20,000 per MW, while air-side work falls slightly because fewer air handlers serve each MW. Electrical maintenance adds USD 7,000 per MW because higher fault currents, more UPS modules and busways per hall raise test and service points. Applied to 103.65 GW of conventional halls and 12.35 GW of AI halls, the teardown gives USD 11.92 billion and USD 1.79 billion of 2025 spending; by 2035 the two cohorts are nearly equal at USD 20.88 billion and USD 20.82 billion.
Which Region Spends the Most on Data Center Facility Management and O&M?
North America leads with USD 5.76 billion, or 42.0% of 2025 value, and the Middle East and Africa is the fastest-growing region at 15.38% a year to USD 2.29 billion by 2035.
| Region | 2025 (USD million) | Share 2025 | 2035 (USD million) | CAGR 2025-2035 |
|---|---|---|---|---|
| North America | 5,758.41 | 42.0% | 16,264.31 | 10.94% |
| Europe | 3,427.62 | 25.0% | 9,174.74 | 10.35% |
| Asia Pacific | 3,427.62 | 25.0% | 12,093.97 | 13.44% |
| Latin America | 548.42 | 4.0% | 1,876.65 | 13.09% |
| Middle East and Africa | 548.42 | 4.0% | 2,293.68 | 15.38% |
North America Leads with 42.0% Share
North America spends USD 5.76 billion in 2025, rising to USD 16.26 billion by 2035 at 10.94% a year. United States data centers used about 4.4% of national electricity in 2023 (Department of Energy, December 2024), the deepest pool of outsourced O&M providers is here, and Canada has about 239 data centers (Canada Energy Regulator, October 2024).
Europe Holds 25.0% Share
Europe spends USD 3.43 billion in 2025 and USD 9.17 billion in 2035, growing 10.35% a year. EU energy reporting and Germany’s PUE limits put efficiency tasks on site teams, data centres used 23% of Ireland’s metered electricity in 2025 (Central Statistics Office, July 2026), and the United Kingdom designated data centres as Critical National Infrastructure in September 2024.
Asia Pacific Holds 25.0% Share
Asia Pacific spends USD 3.43 billion in 2025, rising to USD 12.09 billion by 2035 at 13.44% a year. India’s installed capacity reached 1.57 GW in August 2026 (Press Information Bureau), China requires PUE within 1.25 for new large sites, and Australia’s market operator expects data centers to use about 12 terawatt-hours (TWh) by 2030.
Latin America Holds 4.0% Share
Latin America spends USD 548.42 million in 2025 and grows 13.09% a year to USD 1.88 billion. Brazil’s REDATA programme (Provisional Measure 1.318, September 2025) suspends federal taxes on IT equipment for sites that are installed or modernised, which adds halls that need operations teams.
Middle East and Africa Holds 4.0% Share
The Middle East and Africa spends USD 548.42 million in 2025 and is the fastest-growing region at 15.38% a year. Saudi Arabia’s 1 GW stc and HUMAIN plan and the 200 MW first phase of Stargate UAE rely on international operations providers because local pools of critical-facility engineers are small.
Which Countries Spend the Most on Data Center O&M Services?
The United States is the largest country market with USD 5.29 billion in 2025, or 38.6% of global value, and India is the fastest-growing large country at 18.20% a year.
| Rank | Country | Region | 2025 (USD million) | Share 2025 | 2035 (USD million) | CAGR 2025-2035 |
|---|---|---|---|---|---|---|
| 1 | United States | North America | 5,292.25 | 38.6% | 14,929.80 | 10.93% |
| 2 | China | Asia Pacific | 1,233.94 | 9.0% | 4,337.15 | 13.39% |
| 3 | Germany | Europe | 630.68 | 4.6% | 1,584.73 | 9.65% |
| 4 | United Kingdom | Europe | 616.97 | 4.5% | 1,543.02 | 9.60% |
| 5 | Japan | Asia Pacific | 575.84 | 4.2% | 1,626.43 | 10.94% |
| 6 | Canada | North America | 466.16 | 3.4% | 1,334.51 | 11.09% |
| 7 | France | Europe | 356.47 | 2.6% | 1,000.88 | 10.88% |
| 8 | Australia | Asia Pacific | 342.76 | 2.5% | 1,209.40 | 13.44% |
| 9 | India | Asia Pacific | 329.05 | 2.4% | 1,751.54 | 18.20% |
| 10 | Netherlands | Europe | 315.34 | 2.3% | 834.07 | 10.22% |
| 11 | Ireland | Europe | 301.63 | 2.2% | 750.66 | 9.55% |
| 12 | Singapore | Asia Pacific | 274.21 | 2.0% | 875.77 | 12.31% |
India moves from ninth place in 2025 to third by 2035, passing Germany, the United Kingdom, Japan, Canada, France and Australia, because its operating base grows from 1.57 GW and most new campuses outsource daily operations. The 12 countries account for 78.3% of 2025 value.
How Could the 2035 Forecast Change?
DC Market Insights puts the 2035 market between USD 35.64 billion and USD 47.24 billion, with USD 41.70 billion as the base case.
| Scenario | Assumptions | 2035 (USD million) | CAGR 2025-2035 |
|---|---|---|---|
| Low | Installed base about 274 GW in 2035, per-MW rates 3% below base as remote operations replace site visits | 35,639.61 | 10.02% |
| Base | 311 GW installed, 44% AI halls, USD 134,100 blended per MW a year | 41,703.36 | 11.77% |
| High | Installed base about 342 GW, per-MW rates 3% above base on tighter labour markets | 47,236.10 | 13.17% |
Capacity is the larger swing factor: a 37 GW change in the 2035 installed base moves value by about USD 5 billion, more than a 3% change in rates.
Who Are the Leading Data Center Facility Management and O&M Companies?
The market is fragmented: DC Market Insights estimates that the five largest providers hold about 24% of 2025 value, based on Vertiv’s USD 1.84 billion of 2025 services sales and the disclosed data center service lines of the other leaders.
- Vertiv
- Schneider Electric
- Johnson Controls
- CBRE
- JLL
- Eaton
- ABM Industries
- EMCOR Group
- Comfort Systems USA
- Cushman & Wakefield
- Sodexo
- ISS A/S
- Mitie
- Siemens
- Bureau Veritas
- Salute Mission Critical
- BGIS
Equipment makers hold the largest single-service books. Vertiv reported 2025 net sales of USD 10.23 billion, of which services were USD 1.84 billion, and has added liquid cooling fluid services through PurgeRite and King Environmental Services. Schneider Electric says its field services capture demand across the lifecycle, from commissioning to modernisation and maintenance, and Eaton reported record 2025 sales of USD 27.4 billion with Electrical Americas orders up 16% on data center momentum. Johnson Controls reported fiscal 2025 sales of USD 23.6 billion and a USD 14.9 billion Systems and Services backlog.
Facility service firms run whole sites. CBRE, JLL and Cushman & Wakefield operate critical environment teams for hyperscale and colocation clients; ABM Industries reported record fiscal 2025 revenue of USD 8.7 billion and lists mission critical among its markets; EMCOR Group reported 2025 revenue of USD 16.99 billion, up 16.6%; and Comfort Systems USA reported USD 9.10 billion. Sodexo, ISS A/S and Mitie win data center rooms inside integrated facility management contracts, while Salute Mission Critical and BGIS specialise in staffing data center operations.
Recent Developments
- In September 2026, Vertiv agreed to acquire King Environmental Services, a Europe-based fluid management provider (Source: Vertiv).
- In June 2026, Mitie reported fiscal 2026 revenue of GBP 5,619 million, up 10.5%, citing data centre engineering projects as a growth driver (Source: Mitie results).
- In March 2026, ABM Industries reported first-quarter fiscal 2026 Technical Solutions revenue of USD 229.7 million, up 13.6%, on mission-critical and data center demand (Source: ABM Industries).
- In February 2026, EMCOR Group reported 2025 revenue of USD 16.99 billion, up 16.6% (Source: EMCOR Group filing).
- In January 2026, Vertiv launched Vertiv Next Predict, an AI-powered predictive maintenance managed service for data centers (Source: Vertiv).
- In December 2025, Vertiv completed its approximately USD 1.0 billion acquisition of PurgeRite (Source: Vertiv).
Methodology: How the Model Sizes the Data Center Facility Management O&M Services Market
DC Market Insights built the Data Center Facility Management O&M Services Market bottom-up from installed capacity and outsourced O&M spend per MW, giving USD 13.71 billion in 2025 and USD 41.70 billion in 2035.
The model in numbers. Installed IT capacity of 80 GW in 2020, 116 GW in 2025, 196 GW in 2030 and 311 GW in 2035 is split into conventional and AI halls, with AI halls at 3.0 GW in 2020, 12.35 GW in 2025, 57.85 GW in 2030 and 136.98 GW in 2035 (AI taking 35% of new capacity in 2025, 60% in 2030 and 66% in 2035). Each cohort multiplies five service-line rates: USD 105,000, 115,000, 118,000 and 120,000 per conventional MW a year and USD 140,000, 145,000, 150,000 and 152,000 per AI MW for 2020, 2025, 2030 and 2035, linear between anchor years. Contract model, data center type, regional and country splits are DC Market Insights allocations that sum to the total every year; the capacity base matches the DC Market Insights research methodology used across all DCMI reports.
Bound checks. (1) Ceiling: the 2025 blended rate of USD 118,200 per MW equals about 1.1% a year of a USD 10.7 million per MW facility cost, at the low end of the 1% to 3% that owners budget for plant maintenance, so the model does not overstate spend. (2) Ceiling and cross-check: the facility management and critical infrastructure maintenance lines of the DCMI managed-services model total USD 14.02 billion for 2025, 2.3% above this figure, and Vertiv’s USD 1.84 billion of services sales, which also include non-data-center and commissioning work, would equal 13.4% of the market, consistent with a fragmented field. (3) Floor: Vertiv services plus ABM Technical Solutions at an annual run rate of about USD 0.92 billion give about USD 2.76 billion from two providers, and the staffing line implies about 0.36 outsourced staff per MW at BLS-level wages, a plausible ratio for 24/7 sites, so the market cannot be far below USD 13.71 billion.
Table of contents
- 01Introduction
- 1.1Market Definition
- 1.2Historical Period, Base Year and Forecast Period
- 1.3Report Attributes
- 02Research Methodology
- 2.1The Installed-Base O&M Model in Numbers
- 2.2Bound Checks: Plant Maintenance Ceiling, DCMI Managed-Services Cross-Check and Provider Floor
- 03Executive Summary
- 3.1Market Snapshot, 2025, 2026 and 2035
- 3.2Key Market Statistics
- 04What Is Data Center Facility Management and O&M?
- 4.1Included: Operations, Electrical, Mechanical, Liquid Cooling and Soft Services
- 4.2Excluded: IT Hardware Support, Commissioning, Renovation and In-House Staff
- 4.3How the Segments Fit Together
- 05Why Do Data Center Facility Management O&M Services Market Estimates Differ?
- 5.1Broader and Narrower Definitions
- 5.2Scope Comparison: What Is In and Out
- 5.3Buyers Inside the Scope
- 06Market Drivers
- 6.1Liquid Cooling Loops Create a New Fluid-Service Line
- 6.2Trade Wages Set the Price of Every Shift
- 6.3Hyperscale and Colocation Operators Outsource More of the Site
- 07Market Trends
- 7.1Predictive Maintenance Sold as a Managed Service
- 7.2Mechanical Contractors Move into Long-Term Service
- 7.3Integrated Facility Management Wins Enterprise and Edge Sites
- 08Market Challenges
- 8.1Not Enough Shift Engineers for 311 GW
- 8.2Fixed-Price Contracts Meet Rising Per-MW Costs
- 09Market Opportunities
- 9.1Liquid Cooling Service: USD 3.29 Billion by 2035
- 9.2Middle East and Africa: The Fastest-Growing Region at 15.38%
- 10Pricing Analysis: O&M Cost per MW
- 10.1Conventional Hall Rate, 2020-2035
- 10.2AI Hall Rate, 2020-2035
- 10.3Blended Rate per Installed MW and Public Price Anchors
- 11Standards and Regulation
- 11.1NFPA 70B (2023 Edition)
- 11.2Delegated Regulation (EU) 2024/1364
- 11.3Germany EnEfG
- 11.4China Green Action Plan
- 11.5Japan METI PUE Benchmark and Singapore IMDA Green Data Centre Roadmap
- 11.6ISO 41001 and EN 50600
- 12Data Center Facility Management O&M Services Market, By Service Type
- 12.1Critical Facility Operations
- 12.2Electrical and Power Systems Maintenance
- 12.3Mechanical and Cooling Maintenance
- 12.4Building and Soft Services
- 13Data Center Facility Management O&M Services Market, By Contract Model
- 13.1Bundled Critical O&M Contracts
- 13.2Single-Service Maintenance Contracts
- 13.3Integrated Facility Management
- 14Data Center Facility Management O&M Services Market, By Data Center Type
- 14.1Hyperscale and AI Data Centers
- 14.2Colocation Data Centers
- 14.3Enterprise Data Centers
- 14.4Edge Data Centers
- 15DC Exclusive: AI Hall O&M Cost Teardown
- 15.1Service-Line Rates per MW, Conventional vs AI Halls, 2025 and 2035
- 15.2Spending by Hall Cohort, 2025 and 2035
- 16Data Center Facility Management O&M Services Market, By Region
- 16.1North America (United States, Canada)
- 16.2Europe (Germany, United Kingdom, France, Netherlands, Ireland)
- 16.3Asia Pacific (China, Japan, Australia, India, Singapore)
- 16.4Latin America (Brazil)
- 16.5Middle East and Africa (Saudi Arabia, United Arab Emirates)
- 17Country Analysis
- 17.1United States
- 17.2China
- 17.3Germany
- 17.4United Kingdom
- 17.5Japan
- 17.6Canada
- 17.7France
- 17.8Australia
- 17.9India
- 17.10Netherlands
- 17.11Ireland
- 17.12Singapore
- 18Forecast Scenarios
- 18.1Low Scenario
- 18.2Base Scenario
- 18.3High Scenario
- 19Competitive Landscape
- 19.1Market Concentration: Top Five Hold About 24%
- 19.2Equipment Makers' Service Businesses
- 19.3Facility Service and Integrated Facility Management Firms
- 20Recent Developments
- 20.1Acquisitions
- 20.2Service Launches
- 20.3Company Results
- 21Company Profiles
- 21.1Vertiv
- 21.2Schneider Electric
- 21.3Johnson Controls
- 21.4CBRE
- 21.5JLL
- 21.6Eaton
- 21.7ABM Industries
- 21.8EMCOR Group
- 21.9Comfort Systems USA
- 21.10Cushman & Wakefield
- 21.11Sodexo
- 21.12ISS A/S
- 21.13Mitie
- 21.14Siemens
- 21.15Bureau Veritas
- 21.16Salute Mission Critical
- 21.17BGIS
- Fig. 1Data Center Facility Management O&M Services Market Size, 2020-2035
- Table 1Report Attributes
- Table 2Scope Comparison
- Table 3O&M Cost per MW, 2020-2035
- Table 4Market by Service Type
- Table 5Market by Contract Model
- Table 6Market by Data Center Type
- Table 7AI Hall O&M Cost Teardown, 2025 and 2035
- Table 8Market by Region
- Table 9Top 12 Countries
- Table 10Forecast Scenarios
About this report
Written by Amit Jain and reviewed by Deepti Agrawal, Senior Editor, Research. Figures are built top-down and bottom-up and reconciled before publication, with 2025 as the base year.
Read our methodologyHow we built this
- Historical period2020-2024
- Base year2025
- Forecast period2026-2035
- Sizing approachTop-down + bottom-up
Need more than the report?
Advisory on this market
Due diligence, site selection and market entry work, by the analysts who wrote this report.
See consulting servicesFrequently asked questions
USD 15.34 billion in 2026, up 11.9% from USD 13.71 billion in 2025, according to DC Market Insights estimates. The market is projected to reach USD 41.70 billion by 2035, a CAGR of 11.77% from 2025.
USD 41.70 billion by 2035, up from USD 13.71 billion in 2025 and USD 8.51 billion in 2020 (DC Market Insights estimate), as installed IT capacity grows from 116 GW to 311 GW.
USD 13.71 billion of 2025 spending on outsourced work that runs and maintains data center facilities: shift operations teams, electrical and power maintenance, cooling and liquid cooling maintenance, and building and soft services. IT hardware support, commissioning and in-house staff are excluded.
11.77% a year from 2025 to 2035, after 10.02% a year between 2020 and 2025, because the installed base almost triples and AI halls cost about 26% more per MW to operate.
About USD 118,200 per installed MW a year in 2025: USD 115,000 for a conventional hall and USD 145,000 for an AI hall with liquid cooling, according to DC Market Insights estimates.
30.8% of 2025 value, or USD 4.23 billion, goes to critical facility operations staffing. Mechanical and cooling maintenance grows fastest at 13.36% a year to USD 12.21 billion in 2035.
42.0% of 2025 value, or USD 5.76 billion, is spent in North America. The Middle East and Africa grows fastest at 15.38% a year, led by AI campuses in Saudi Arabia and the UAE.
About 24% of 2025 value is held by the five largest providers, led by Vertiv, Schneider Electric, Johnson Controls, CBRE and JLL (DC Market Insights estimate). Eaton, ABM Industries, EMCOR Group, Comfort Systems USA, Cushman & Wakefield, Sodexo, ISS A/S and Mitie also compete.
Scope: DC Market Insights counts USD 15.34 billion of outsourced facility O&M in 2026 and leaves out IT hardware support, managed hosting, commissioning, colocation rent and in-house staff, which broader definitions add.
USD 30,000 more per MW a year in 2025, of which USD 20,000 is liquid cooling loop and fluid service. DC Market Insights values liquid cooling service at USD 3.29 billion in 2035.
Licences, delivery and payment
Which licence should I choose?
Single User is a view-only PDF for one person. Multi User adds a printable PDF and the Excel data for unlimited users at one location. Enterprise covers your whole company and includes 100 free analyst hours.
How and when will I receive the report?
By email, within 24–48 business hours of payment, in the formats of your licence.
How can I pay?
Securely through PayPal: with a PayPal account, a debit or credit card, or PayPal Pay Later where available. Prices are in US dollars.
Can I see a sample first?
Yes. Request a free sample and we will email it to you.
Can the report be tailored to my needs?
Yes. We can add countries, segments or data cuts. Talk to an analyst about the scope you need.
Can I get an invoice or pay against a purchase order?
Write to sales@dcmarketinsights.com and our team will help.