
Telecom Data Center Market Size, Share & Forecast to 2035
Market at a glance
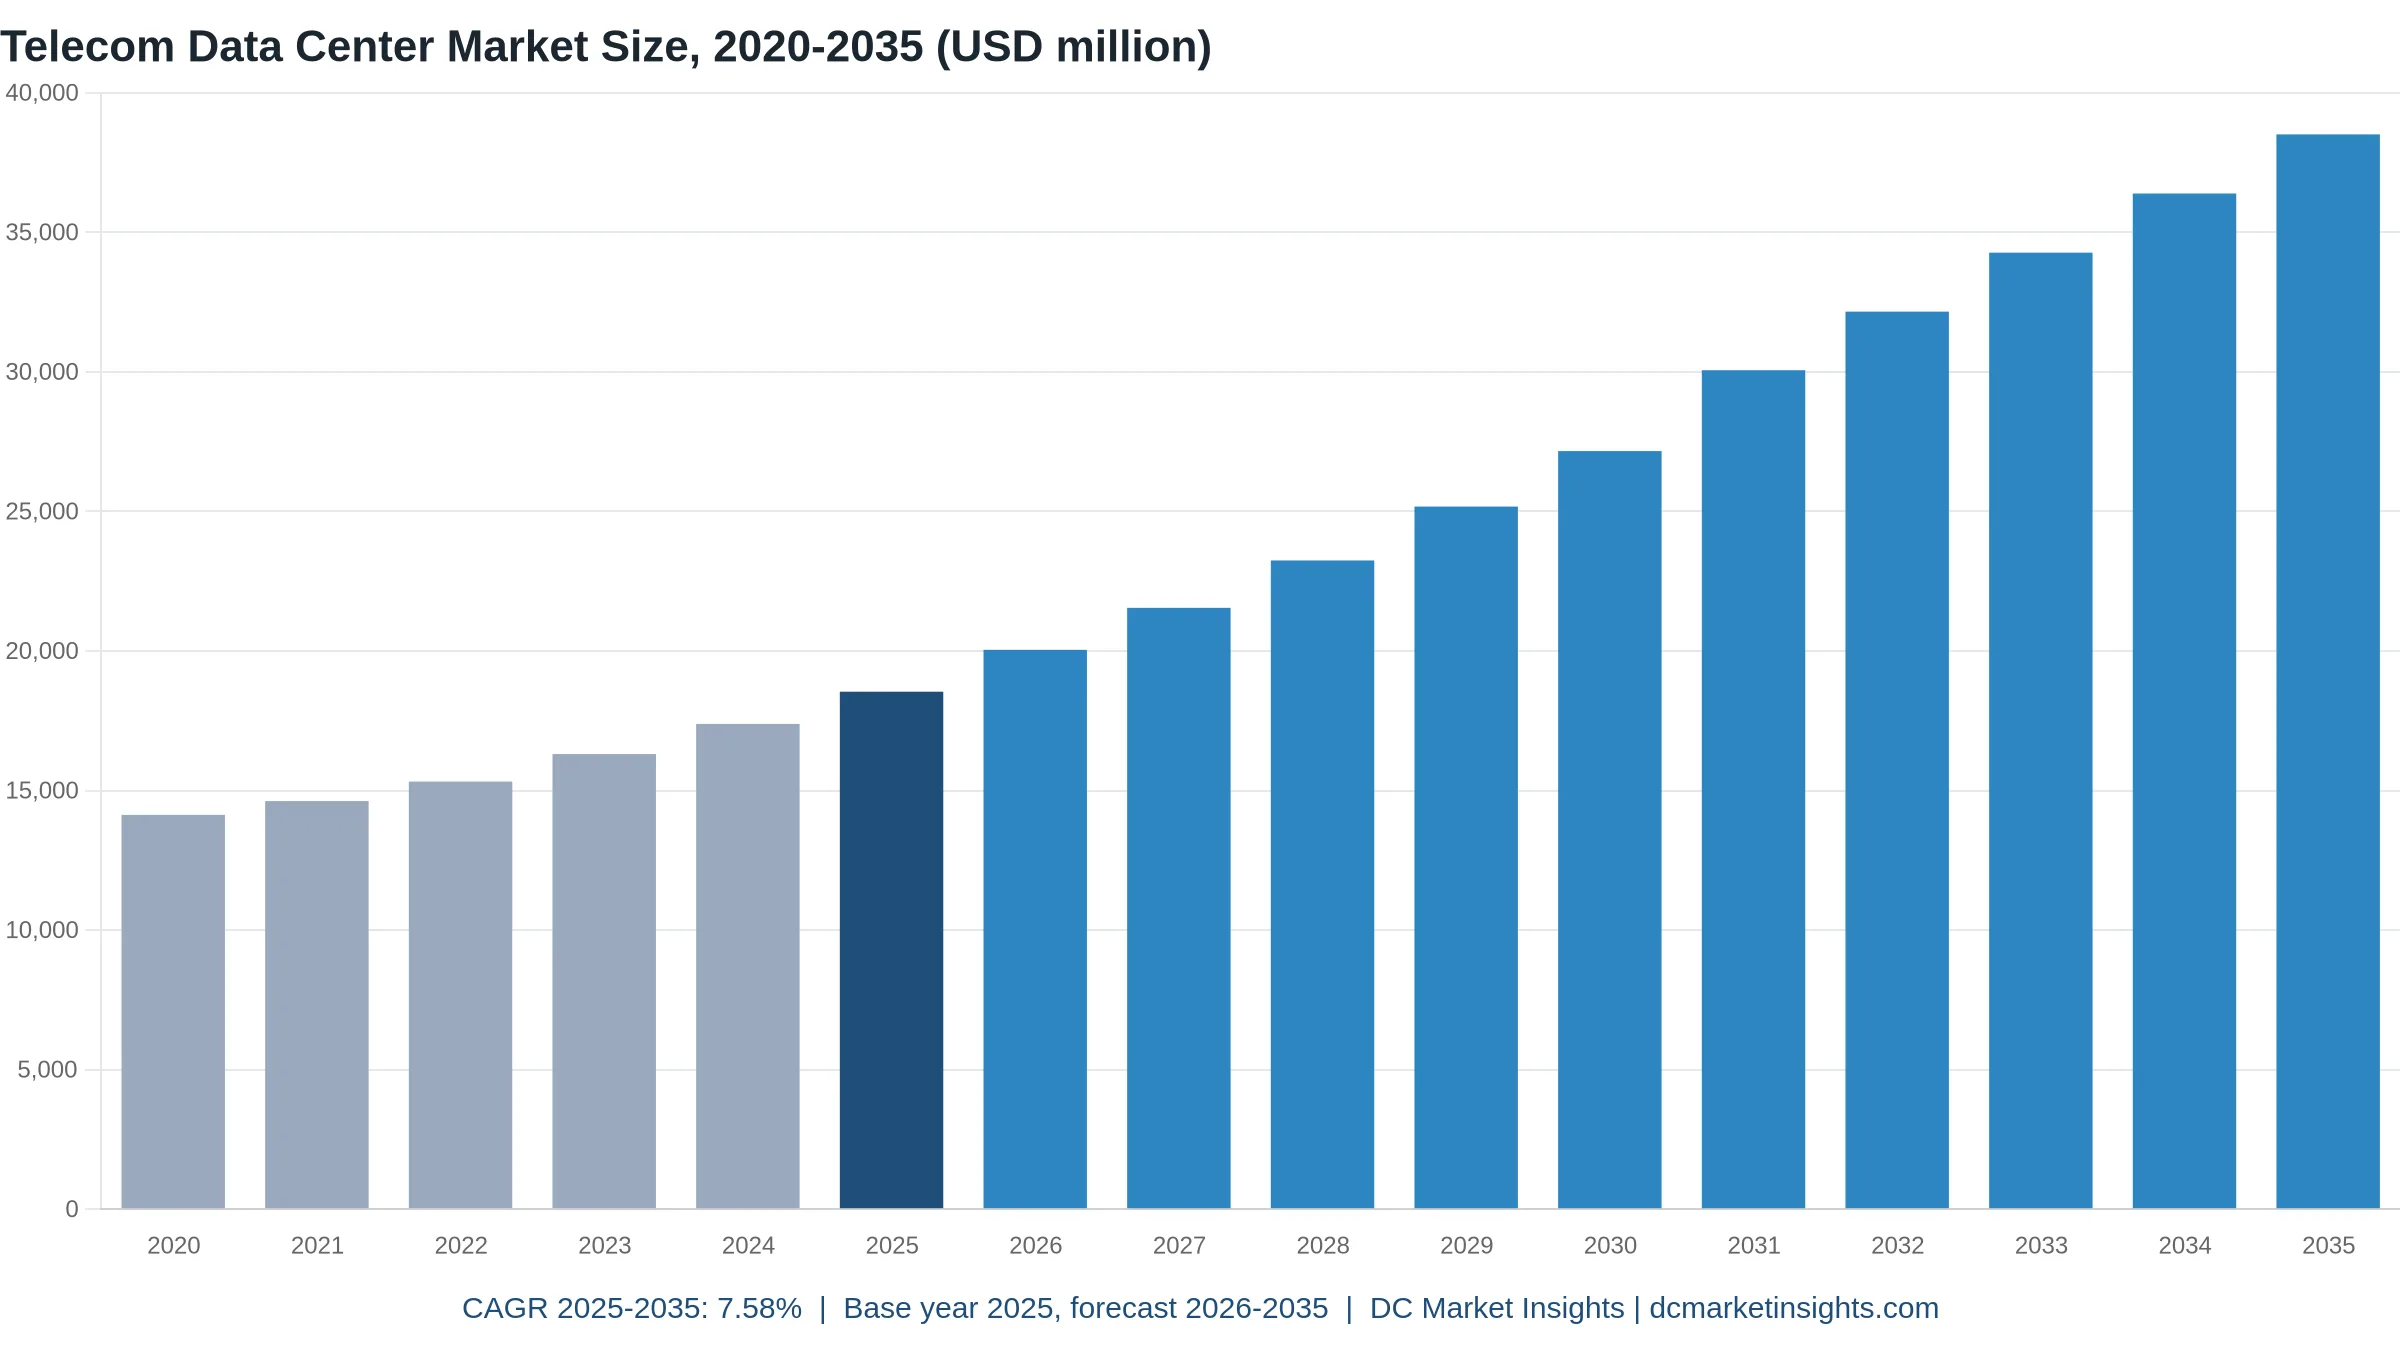
The Telecom Data Center market was worth USD 18.54 billion in 2025 and is forecast to reach USD 38.51 billion by 2035, growing at a 7.58% CAGR.
 By Amit Jain, Senior Consultant, ICT & Emerging Technologies
 Reviewed by Deepti Agrawal
Last updated 29 Oct 2026
Base year 2025 PDF + Excel
What is inside the report
- 01Introduction
- 02Executive Summary
- 03Market Scope
- 04Why Market Estimates Differ
- 05Market Drivers
- 06Market Trends
- 07Market Challenges and Restraints
- 08Market Opportunities
- 09Pricing Analysis
- 10Standards and Regulation
- 18chapters
- 2020-2024Historical period
- 2026-2035Forecast period
- —Companies profiled
Segmentation
Recent developments
AT&T reported more than 100 wire centers with no customers on legacy services and a copper exit target for 50% of wire centers outside California (Source: AT&T)
the European Commission proposed an EU rating scheme for data centers under the Energy Efficiency Directive (Source: European Commission)
MIIT reported 5.154 million 5G base stations in China at the end of July 2026 (Source: Ministry of Industry and Information Technology)
SK Telecom set 2027 for the 100 MW SK AI Data Center Ulsan with AWS (Source: SK Telecom)
China Telecom reported more than 3.2 GW of rack power capacity and 91 EFLOPS of AI computing (Source: China Telecom)
Deutsche Telekom launched its Industrial AI Cloud in Munich with up to 10,000 GPUs (Source: Deutsche Telekom)
Full analysis
The Telecom Data Center Market is valued at USD 20.04 billion in 2026 and is projected to reach USD 38.51 billion by 2035, up from USD 18.54 billion in 2025, a CAGR of 7.58% from 2025 to 2035 (DC Market Insights estimate). Telecom operators are turning copper-era buildings into compute sites: AT&T says more than 100 of its wire centers already carry no customers on legacy services, and it targets copper discontinuation in half of its wire centers outside California (AT&T third-quarter 2026 remarks). At the same time operators have become builders of national artificial intelligence (AI) capacity, led by Deutsche Telekom’s EUR 1 billion Munich cloud with up to 10,000 NVIDIA Blackwell graphics processing units (GPUs) (Deutsche Telekom, November 2025). The 2025 value rests on 5,100 megawatts (MW) of information technology (IT) load that operators run for their own networks and services x USD 3.64 million of yearly spending per MW = USD 18.54 billion, of which USD 13.52 billion is servers, storage and switching. Telco AI and GPU cloud is the fastest workload at 20.48% a year, and Middle East and Africa is the fastest region at 9.56% because Gulf operators are building sovereign AI campuses with state AI companies.
Key Market Statistics: How Big Is the Telecom Data Center Market in 2026?
DC Market Insights values telecom operator data center spending at USD 20.04 billion in 2026, 8.09% above 2025, as GPU halls, cloud-native 5G cores and converted central offices all add load in the same year.
- Telecom data center market size 2025: USD 18.54 billion
- Market size 2026: USD 20.04 billion
- Market size 2030: USD 27.16 billion
- Market size 2035: USD 38.51 billion
- CAGR 2025-2035: 7.58% (low case 5.85%, high case 9.00%)
- Largest component: IT hardware, USD 13.52 billion or 72.9% of 2025 value
- Fastest workload: telco AI and GPU cloud, 20.48% a year to USD 11.82 billion by 2035
- Largest operator type: integrated fixed and mobile operators, USD 9.27 billion in 2025
- Leading region: Asia Pacific, USD 7.42 billion or 40.0% of 2025 value; fastest region: Middle East and Africa at 9.56%
- Largest country: United States, USD 4.51 billion in 2025; fastest large country: India at 12.03%
- Market leaders: Huawei Technologies, ZTE Corporation, Dell Technologies and Hewlett Packard Enterprise in operator servers, and Ericsson and Nokia in network cloud platforms (DC Market Insights assessment)
Executive Summary: Telecom Data Center Market Size, 2020-2035
The Global Telecom Data Center Market size was valued at USD 14.13 billion in 2020, reached USD 18.54 billion in 2025, and is anticipated to reach USD 38.51 billion by 2035, at a CAGR of 7.58% during the forecast period. Growth was 5.59% a year from 2020 to 2025, when operators moved voice and packet cores onto standard servers; from 2025 it accelerates because a GPU rack costs about three times more per MW-year than a network cloud rack.
| Attribute | Value |
|---|---|
| Historical period | 2020-2024 |
| Base year | 2025 |
| Forecast period | 2026-2035 |
| Market size 2025 | USD 18.54 billion |
| Market size 2026 | USD 20.04 billion |
| CAGR 2025-2035 | 7.58% |
| Market size 2035 | USD 38.51 billion |
| Segments covered | Component, operator type, workload, facility type, region, 12 countries |
Spending is shifting away from legacy core halls: core and central office data centers grow only 3.59% a year to USD 14.25 billion in 2035, while network edge and multi-access edge computing (MEC) sites reach USD 12.71 billion and colocation and hosted cloud USD 11.55 billion. GPU capacity moves telco AI from 9.9% of 2025 value to 30.7% in 2035.
What Counts as a Telecom Data Center?
USD 18.54 billion in 2025: the data center capacity that mobile, fixed, cable and wholesale carriers own or lease to run their own networks and services, counted from the server to the building.
Included: servers, storage and switching in operator sites (USD 13.52 billion); colocation, wholesale and hyperscaler-hosted network cloud fees paid by operators (USD 2.21 billion); uninterruptible power supply (UPS), direct-current power plants, cooling and switchgear in owned sites (USD 2.14 billion); and construction, central office conversion and tenant fit-out (USD 672.27 million). Packet and voice cores, operations support systems and business support systems (OSS/BSS), content caches, MEC nodes and operator-run GPU clouds all count.
Excluded: radio access network equipment at cell sites, fibre and transmission gear, the electricity bill, and the colocation space that operators sell to outside customers (for example China Mobile’s external internet data center business, which belongs to the colocation market).
How the segments fit together: every split (component, operator type, workload, facility type, region) sums to the same USD 18.54 billion in 2025 and USD 38.51 billion in 2035. The model is built in MW: 5,100 MW in use in 2025, of which 969 MW is leased, 1,377 MW sits in edge and converted central office sites and 179 MW runs on GPU racks.
Why Do Telecom Data Center Market Estimates Differ?
Published figures for this market name differ by several times because they count different things; the DC Market Insights value of USD 20.04 billion in 2026 covers only capacity operators use for their own networks and services.
Broader definitions add the data center space that operators rent out to enterprises and cloud providers. That business is large in China: China Mobile served outside customers from more than 1.5 million standard racks in 2025, and China Telecom reported RMB 34.5 billion of AI data center revenue (company annual results, March 2026). Other studies add radio access and transmission equipment, network software licences or the carrier-neutral data center companies that operators have sold. Narrower studies count only buildings and miss the 84.8% of 2025 spending that goes to IT hardware and hosting fees.
| Element | In this report | Why |
|---|---|---|
| Servers, storage, switching in operator sites | Yes, USD 13.52 billion (2025) | Capacity the operator buys and runs |
| Colocation and hosted network cloud fees | Yes, USD 2.21 billion | Capacity the operator leases |
| Power, cooling, construction of owned sites | Yes, USD 2.81 billion | Data center infrastructure |
| Network edge, MEC and converted central offices | Yes, USD 5.01 billion (within the lines above) | Server-class compute in the network |
| Colocation sold to outside customers | No | Counted in the colocation market |
| Radio access and transmission equipment | No | Network equipment, not data center |
| Network software licences | No | Software market |
| Electricity bill | No | Operating cost, not capacity |
Small operators are in scope: a regional cable company with two core sites and a leased cage is counted the same way as a national incumbent. Colocation sold to outside customers, radio equipment and software licences stay out of scope throughout this estimate.
Why Are Telecom Operators Spending More on Data Centers?
Three drivers lift spending from USD 18.54 billion in 2025 to USD 27.16 billion in 2030: copper retirement, cloud-native 5G cores carrying fast-growing traffic, and operator-built sovereign AI clouds.
Copper Retirement Turns AT&T Wire Centers into Compute Sites
AT&T told investors on 21 October 2026 that more than 100 wire centers have no customers left on legacy services and that it targets copper discontinuation in 50% of wire centers outside California, a program central to USD 4 billion of yearly cost savings by the end of 2028 (AT&T, October 2026). The Federal Communications Commission (FCC) removed network change filings for copper retirements in March 2026. Each closed copper switch frees power and floor space that operators consolidate into fewer, denser network cloud sites, which is why core and central office data centers still absorb USD 10.01 billion of 2025 spending.
5.15 Million Chinese 5G Base Stations Feed Cloud-Native Cores
China had 5.154 million 5G base stations at the end of July 2026, 39.4% of all mobile base stations, and 1.303 billion 5G users; mobile internet traffic rose 17.6% in January-July 2026 (Ministry of Industry and Information Technology, August 2026). In the United Kingdom mobile data use rose 18% in 2025 to more than 1.2 billion gigabytes a month and 5G data grew 53% (Ofcom, November 2025). Standalone 5G runs its core as software on data center servers, so DC Market Insights puts core network and network cloud at USD 5.75 billion in 2025, the largest workload.
Deutsche Telekom and SK Telecom Build Sovereign AI Clouds
Deutsche Telekom’s EUR 1 billion Industrial AI Cloud with NVIDIA, launched in Munich in February 2026, holds up to 10,000 Blackwell GPUs and 0.5 exaflops and is expected to raise Germany’s AI computing power by about 50% (Deutsche Telekom, November 2025). SK Telecom is developing the 100 MW SK AI Data Center Ulsan with Amazon Web Services (AWS) for 2027 and plans to scale it to 1 gigawatt (GW) (SK Telecom, April 2026). DC Market Insights counts the operator’s own share of these campuses in telco AI and GPU cloud, worth USD 1.83 billion in 2025.
Which Trends Are Reshaping Telecom Data Centers?
Capital is moving from radio networks to computing, and edge sites grow 9.76% a year as operators reuse their real estate for MEC.
Chinese Operators Shift Capital Expenditure to Computing Power
China Mobile reached 92.5 exaflops (EFLOPS) of intelligent computing at the end of 2025 while cutting capital expenditure 8.0% to RMB 150.9 billion; China Unicom guides about RMB 50 billion of 2026 capital expenditure, more than 35% of it for computing, after building seven 100 MW-class AI data center campuses (company results, March 2026). China Telecom reported more than 3.2 GW of rack power capacity and 46 EFLOPS of self-owned AI computing (China Telecom 2025 annual results). DC Market Insights values China at USD 3.89 billion in 2025, growing 8.33% a year.
MEC Phase 4 Standards Push Compute into Central Offices
The European Telecommunications Standards Institute (ETSI) released its first MEC Phase 4 specifications in October 2025 (ETSI, October 2025), and in India 5G carried about 42.75% of wireless data in January-March 2026 (Telecom Regulatory Authority of India, June 2026). DC Market Insights forecasts network edge and MEC sites to grow from USD 5.01 billion in 2025 to USD 12.71 billion in 2035; the Multi-Access Edge Computing Market report covers the platform layer of the same build-out.
Japanese Operators Reuse a Former Sharp Factory for AI
SoftBank Corp. plans an AI data center of more than 150 MW, expandable to more than 400 MW, on the former Sharp plant in Sakai (SoftBank, June 2024), and KDDI plans its own Sakai site with about 1,000 NVIDIA GB200 NVL72 units (KDDI, June 2024). The Ministry of Economy, Trade and Industry approved up to JPY 72.5 billion of AI compute subsidies in April 2024, including about JPY 10.24 billion for KDDI. Japan accounts for USD 1.02 billion of 2025 telecom data center spending.
What Limits Telecom Data Center Investment?
Two limits keep the forecast at 7.58% a year: flat telecom revenue that caps capital budgets, and new energy duties on data centers in the European Union (EU).
Flat Service Revenue Caps Operator Capital Budgets
China’s telecom revenue rose only 0.7% to CNY 1.75 trillion in 2025 (MIIT, January 2026), and AT&T guides capital investment of USD 22-23 billion a year for 2027 and 2028, a range that must also fund fibre and wireless. Operators fund GPU halls by cutting radio spending, not by adding budget. In the DC Market Insights low case, slower AI cloud uptake cuts 2035 spending to USD 32.73 billion, USD 5.78 billion below the base case.
EU Energy Rules Reach Every Operator Site Above 500 kW
The Energy Efficiency Directive requires data centers with at least 500 kilowatts (kW) of installed IT power to report energy and water data, and only 770 sites, about 36% of those in scope, reported in the first round (European Commission, September 2026). On 21 September 2026 the Commission proposed an EU rating scheme for data centers, with minimum performance standards planned for the second quarter of 2027. EU data centers used about 70 terawatt-hours (TWh) in 2024, heading to 115 TWh by 2030 on figures the Commission cites. Europe’s operators spend USD 3.89 billion in 2025 and grow 6.79% a year, below the global rate.
Where Are the New Telecom Data Center Opportunities?
The two largest new pools are Gulf sovereign AI campuses and hosted network cloud, which adds USD 8.03 billion of yearly spending by 2035.
Saudi Arabia’s stc and HUMAIN Joint Venture
stc’s data center arm center3 and HUMAIN formed a joint venture for Saudi AI data centers of up to 1 GW, starting with up to 250 MW (stc results presentation, 2026). DC Market Insights forecasts Saudi Arabia’s telecom data center spending to grow from USD 333.75 million in 2025 to USD 1.00 billion in 2035, 11.61% a year, and Middle East and Africa to reach USD 2.77 billion.
Hosted Network Cloud and Leased Capacity
Colocation and hosted cloud grows from USD 3.52 billion in 2025 to USD 11.55 billion in 2035, 12.61% a year, as operators place cores in leased halls and on hyperscaler-hosted platforms instead of building new owned sites. For the providers covered in the Data Center Colocation Market report, telecom operators pay USD 2.21 billion of fees in 2025. The EU Digital Networks Act proposal of 21 January 2026 requires national copper phase-out plans, which will free more central office space in Europe (European Commission, January 2026).
How Much Does an Operator Spend per MW of Data Center Capacity?
USD 3.64 million per MW in use in 2025, DC Market Insights estimates, rising to USD 4.61 million by 2035 as GPU racks lift hardware spending per MW.
| Year | Operator IT load in use (MW) | Total spending per MW | IT hardware per MW | Colocation and hosting rate (USD per kW-month) |
|---|---|---|---|---|
| 2020 | 4,400 | USD 3.21 million | USD 2.37 million | USD 172 |
| 2025 | 5,100 | USD 3.64 million | USD 2.65 million | USD 190 |
| 2030 | 6,280 | USD 4.33 million | USD 3.04 million | USD 201 |
| 2035 | 8,350 | USD 4.61 million | USD 3.19 million | USD 208 |
Public anchors: Deutsche Telekom’s EUR 1 billion for up to 10,000 GPUs works out to about EUR 100,000 per GPU including the hall. China Unicom’s guidance puts more than RMB 17.5 billion of its 2026 capital expenditure into computing. A telco AI rack costs USD 8.20 million per MW-year of servers in the DC Market Insights model in 2025, against USD 2.45 million for network cloud servers.
Which Rules Shape Telecom Data Center Design?
At least seven named rules decide how operators retire copper, where they place compute and how they report energy, and they touch all USD 18.54 billion of 2025 spending.
- FCC Report and Order 26-19: adopted 26 March 2026, removed network change disclosure filings for copper retirements (Source: Federal Communications Commission)
- EU Digital Networks Act proposal: adopted 21 January 2026, mandatory national copper phase-out plans (Source: European Commission)
- EU Gigabit Infrastructure Act: in effect from 12 November 2025, fibre-ready in-building infrastructure for new buildings (Source: European Commission)
- EU Energy Efficiency Directive Article 12 and Delegated Regulation 2024/1364: yearly reporting for sites of 500 kW or more; rating scheme proposed 21 September 2026 (Source: European Commission)
- ETSI MEC Phase 4: first specifications released in October 2025 (Source: European Telecommunications Standards Institute)
- Japan Economic Security Promotion Act cloud program: up to JPY 72.5 billion of AI compute subsidies decided 19 April 2024 (Source: Ministry of Economy, Trade and Industry)
- China national computing statistics: 2,185 EFLOPS of intelligent computing and 71.4% rack use at end-June 2026 (Source: Ministry of Industry and Information Technology)
Telecom Data Center Market Segmentation: Which Segment Spends Most?
The largest component is IT hardware at USD 13.52 billion in 2025, integrated fixed and mobile operators the largest operator type at USD 9.27 billion, and core and central office sites the largest facility type at USD 10.01 billion.
By Component
Servers, storage and switching hold 72.9% of 2025 value; colocation and hosted network cloud grows fastest at 10.96% a year.
| Component | 2025 (USD million) | Share 2025 | 2035 (USD million) | CAGR 2025-2035 |
|---|---|---|---|---|
| IT Hardware | USD 13,521.38 million | 72.9% | USD 26,614.79 million | 7.01% |
| Colocation and Hosted Network Cloud | USD 2,209.32 million | 11.9% | USD 6,252.48 million | 10.96% |
| Electrical and Mechanical Infrastructure | USD 2,138.94 million | 11.5% | USD 4,056.44 million | 6.61% |
| Construction and Fit-Out | USD 672.27 million | 3.6% | USD 1,585.89 million | 8.96% |
By Operator Type
Integrated fixed and mobile operators spend USD 9.27 billion in 2025 because they run both broadband and mobile cores; other operators, including satellite and neutral-host providers, grow fastest at 10.72% a year.
| Operator Type | 2025 (USD million) | Share 2025 | 2035 (USD million) | CAGR 2025-2035 |
|---|---|---|---|---|
| Integrated Fixed and Mobile Operators | USD 9,270.96 million | 50.0% | USD 18,484.60 million | 7.14% |
| Mobile Network Operators | USD 4,264.64 million | 23.0% | USD 8,857.21 million | 7.58% |
| Cable and Broadband Operators | USD 2,225.03 million | 12.0% | USD 4,236.06 million | 6.65% |
| Wholesale and International Carriers | USD 1,668.77 million | 9.0% | USD 3,850.96 million | 8.72% |
| Other Operators | USD 1,112.51 million | 6.0% | USD 3,080.77 million | 10.72% |
By Workload
Core network and network cloud is the largest workload at USD 5.75 billion in 2025, but telco AI and GPU cloud passes it by 2035 at USD 11.82 billion.
| Workload | 2025 (USD million) | Share 2025 | 2035 (USD million) | CAGR 2025-2035 |
|---|---|---|---|---|
| Core Network and Network Cloud | USD 5,747.99 million | 31.0% | USD 9,627.39 million | 5.29% |
| OSS BSS and Corporate IT | USD 4,635.48 million | 25.0% | USD 6,161.54 million | 2.89% |
| Edge Computing and Content Delivery | USD 2,781.29 million | 15.0% | USD 6,161.54 million | 8.28% |
| Telco AI and GPU Cloud | USD 1,833.79 million | 9.9% | USD 11,818.60 million | 20.48% |
| Backup Security and Other Workloads | USD 3,543.36 million | 19.1% | USD 4,740.53 million | 2.95% |
By Facility Type
Core and central office data centers hold 54.0% of 2025 value; colocation and hosted cloud grows fastest at 12.61% a year.
| Facility Type | 2025 (USD million) | Share 2025 | 2035 (USD million) | CAGR 2025-2035 |
|---|---|---|---|---|
| Core and Central Office Data Centers | USD 10,012.63 million | 54.0% | USD 14,248.55 million | 3.59% |
| Network Edge and MEC Sites | USD 5,006.32 million | 27.0% | USD 12,708.17 million | 9.76% |
| Colocation and Hosted Cloud | USD 3,522.96 million | 19.0% | USD 11,552.88 million | 12.61% |
Telco AI Factory Tracker: 9 Operator Programs and 1,200 MW Announced
DC Market Insights lists 9 named operator AI data center programs from company releases and filings in this tracker, 9 inputs in all, with 1,200 MW of disclosed campus load. It shows that Asian and Gulf operators announce capacity in MW, while European operators announce GPU counts and euro budgets.
| Operator | Program | Date | MW announced | GPUs or compute | Type |
|---|---|---|---|---|---|
| Deutsche Telekom | Industrial AI Cloud, Munich (Tucherpark), EUR 1 billion with NVIDIA, 0.5 exaflops | Feb 2026 | not disclosed | up to 10,000 Blackwell GPUs | Sovereign AI cloud |
| SK Telecom (SK Group) | SK AI Data Center Ulsan with Amazon Web Services, planned to scale to 1 GW | Apr 2026 | 100 | Manufacturing AI Cloud: 2,000+ RTX PRO 6000 GPUs | AI campus |
| SoftBank Corp. | Sakai AI data center on the former Sharp plant, expandable to 400+ MW | Jun 2024 | 150 | not disclosed | AI campus |
| KDDI | Sakai AI data center on the former Sharp plant site | Jun 2024 | not disclosed | about 1,000 GB200 NVL72 units | AI campus |
| stc (center3) with HUMAIN | Saudi AI data center joint venture, up to 1 GW | 2026 | 250 | not disclosed | Sovereign AI campus |
| China Unicom | Seven 100 MW-class AI data center campuses | Mar 2026 | 700 | 45 EFLOPS | AI campuses |
| China Telecom | 3.2+ GW of rack power capacity, 46 exaflops self-owned | Mar 2026 | not disclosed | 91 EFLOPS self-owned and accessed | Network and AI data centers |
| Telenor | AI Factory in Norway, GPU capacity raised four-fold toward end-2025 | May 2025 | not disclosed | NVIDIA H100 base | Sovereign AI cloud |
| Swisscom (with Fastweb) | Up to CHF 100 million of AI infrastructure with NVIDIA | Jan 2024 | not disclosed | 31 DGX H100 systems at Fastweb | Sovereign AI cloud |
Reading the tracker: the 1,200 MW of disclosed load is 6.7 times the 179 MW of operator GPU capacity in use in 2025 in the DC Market Insights model, because most of these campuses also sell capacity to outside customers and come online after 2026. Only the operator’s own use is counted, which keeps telco AI and GPU cloud at USD 1.83 billion in 2025 and USD 11.82 billion by 2035.
Which Region Leads the Telecom Data Center Market?
Asia Pacific leads with USD 7.42 billion, 40.0% of 2025 value, and Middle East and Africa grows fastest at 9.56% a year to USD 2.77 billion by 2035.
| Region | 2025 (USD million) | Share 2025 | 2035 (USD million) | CAGR 2025-2035 |
|---|---|---|---|---|
| Asia Pacific | USD 7,416.77 million | 40.0% | USD 16,559.14 million | 8.36% |
| North America | USD 5,006.32 million | 27.0% | USD 9,242.30 million | 6.32% |
| Europe | USD 3,893.80 million | 21.0% | USD 7,509.37 million | 6.79% |
| Latin America | USD 1,112.51 million | 6.0% | USD 2,426.10 million | 8.11% |
| Middle East and Africa | USD 1,112.51 million | 6.0% | USD 2,772.69 million | 9.56% |
Asia Pacific
Asia Pacific spends USD 7.42 billion in 2025 and grows 8.36% a year. Chinese operators earned 25.7% of telecom revenue from cloud, big data, internet of things and data center businesses in 2025 (MIIT, January 2026), and India adds the fastest large-country growth at 12.03% a year.
North America
North America spends USD 5.01 billion in 2025 and grows 6.32% a year, the slowest region, because AT&T and other carriers are closing copper wire centers faster than they open new compute sites.
Europe
Europe spends USD 3.89 billion in 2025, growing 6.79% a year. In the United Kingdom, 5G standalone is available in 83% of the country from at least one network (Ofcom, November 2025), and Germany ranks first in the region at USD 741.68 million with Deutsche Telekom’s Munich AI cloud.
Latin America
Latin America spends USD 1.11 billion in 2025 and grows 8.11% a year; Brazil is the region’s largest country at USD 482.09 million, rising to USD 1.04 billion by 2035 as operators move 5G cores onto data center servers.
Middle East and Africa
Middle East and Africa spends USD 1.11 billion in 2025 and is the fastest region at 9.56%, led by Saudi Arabia, where stc’s center3 plans up to 250 MW of AI capacity in a first phase with HUMAIN.
Top 12 Countries in the Telecom Data Center Market
The United States is the largest country at USD 4.51 billion in 2025, 24.3% of the global total; India is the fastest large country at 12.03% a year.
| Rank | Country | Region | 2025 (USD million) | Share 2025 | 2035 (USD million) | CAGR 2025-2035 |
|---|---|---|---|---|---|---|
| 1 | United States | North America | USD 4,505.68 million | 24.3% | USD 8,279.56 million | 6.27% |
| 2 | China | Asia Pacific | USD 3,893.80 million | 21.0% | USD 8,664.66 million | 8.33% |
| 3 | Japan | Asia Pacific | USD 1,019.81 million | 5.5% | USD 1,848.46 million | 6.13% |
| 4 | India | Asia Pacific | USD 741.68 million | 4.0% | USD 2,310.58 million | 12.03% |
| 5 | Germany | Europe | USD 741.68 million | 4.0% | USD 1,386.35 million | 6.45% |
| 6 | United Kingdom | Europe | USD 611.88 million | 3.3% | USD 1,155.29 million | 6.56% |
| 7 | South Korea | Asia Pacific | USD 593.34 million | 3.2% | USD 1,270.82 million | 7.91% |
| 8 | France | Europe | USD 519.17 million | 2.8% | USD 962.74 million | 6.37% |
| 9 | Brazil | Latin America | USD 482.09 million | 2.6% | USD 1,039.76 million | 7.99% |
| 10 | Canada | North America | USD 463.55 million | 2.5% | USD 924.23 million | 7.14% |
| 11 | Saudi Arabia | Middle East and Africa | USD 333.75 million | 1.8% | USD 1,001.25 million | 11.61% |
| 12 | Italy | Europe | USD 315.21 million | 1.7% | USD 577.64 million | 6.24% |
China ranks second at USD 3.89 billion and closes the gap with the United States by 2035, because its three state operators keep adding AI computing. South Korea ranks seventh at USD 593.34 million and grows 7.91% a year on SK Telecom’s Ulsan campus.
How Large Could the Telecom Data Center Market Be in 2035?
Between USD 32.73 billion and USD 43.90 billion in 2035, with USD 38.51 billion as the DC Market Insights base case.
| Scenario | 2035 (USD million) | CAGR 2025-2035 | What it assumes |
|---|---|---|---|
| Low | USD 32,733.16 million | 5.85% | Operators lease GPU capacity instead of building it; AI racks at 15% of MW |
| Base | USD 38,509.60 million | 7.58% | 8,350 MW in 2035, 30% leased, AI racks at 21% of MW |
| High | USD 43,900.94 million | 9.00% | Faster sovereign AI build-out in Europe, the Gulf and India |
Low Scenario
USD 32.73 billion in 2035 if operators rent GPU capacity from cloud providers and flat service revenue holds capital budgets at today’s levels.
Base Scenario
USD 38.51 billion in 2035, with operator IT load rising from 5,100 MW to 8,350 MW and GPU racks rising to 21% of it.
High Scenario
USD 43.90 billion in 2035 if more operators follow Deutsche Telekom, SK Telecom and stc into owned AI campuses.
Who Are the Key Companies in the Telecom Data Center Market?
Huawei Technologies, ZTE Corporation, Dell Technologies and Hewlett Packard Enterprise together hold about 45% of the USD 13.52 billion of 2025 operator IT hardware spending (DC Market Insights estimate); facility power and cooling supply is more spread out.
- Huawei Technologies
- ZTE Corporation
- Ericsson
- Nokia
- Dell Technologies
- Hewlett Packard Enterprise
- Lenovo
- Inspur Information
- Cisco Systems
- NVIDIA
- Schneider Electric
- Vertiv
- Eaton
- Delta Electronics
- Microsoft (Azure Operator Nexus)
- Equinix
- Digital Realty
Company facts: China Mobile’s AI data center revenue rose 35.4% in 2025 while its total data center revenue grew 8.7% (China Mobile annual results, March 2026). Telenor said in May 2025 that it would raise the GPU capacity of its AI Factory four-fold toward the end of 2025 (Telenor, May 2025). Swisscom planned up to CHF 100 million of AI infrastructure with NVIDIA, and its Italian unit Fastweb bought 31 DGX H100 systems (Swisscom, January 2024). SK Telecom plans to buy more than 2,000 NVIDIA RTX PRO 6000 Blackwell GPUs for its Manufacturing AI Cloud (SK Telecom, November 2025).
Server Supplier Concentration, 2025
Chinese suppliers lead with about a quarter of operator server value because China is the second-largest country market; outside China, Dell Technologies, Hewlett Packard Enterprise and Lenovo share most operator server spending, while Ericsson and Nokia supply the cloud-native core software that runs on it (DC Market Insights estimate).
Recent Developments in the Telecom Data Center Market
Six dated events from the last twelve months changed the 2026 outlook of USD 20.04 billion.
- In October 2026, AT&T reported more than 100 wire centers with no customers on legacy services and a copper exit target for 50% of wire centers outside California (Source: AT&T)
- In September 2026, the European Commission proposed an EU rating scheme for data centers under the Energy Efficiency Directive (Source: European Commission)
- In August 2026, MIIT reported 5.154 million 5G base stations in China at the end of July 2026 (Source: Ministry of Industry and Information Technology)
- In April 2026, SK Telecom set 2027 for the 100 MW SK AI Data Center Ulsan with AWS (Source: SK Telecom)
- In March 2026, China Telecom reported more than 3.2 GW of rack power capacity and 91 EFLOPS of AI computing (Source: China Telecom)
- In February 2026, Deutsche Telekom launched its Industrial AI Cloud in Munich with up to 10,000 GPUs (Source: Deutsche Telekom)
Research Methodology: How DC Market Insights Sized the Telecom Data Center Market
The USD 18.54 billion 2025 value is a bottom-up DC Market Insights model of 5,100 MW of operator IT load in use, about 11% of the roughly 46 GW of enterprise and colocation capacity inside the 116 GW installed base, priced component by component; see the DC Market Insights research methodology.
Model Inputs
Operator IT load in use of 4,400, 5,100, 6,280 and 8,350 MW in 2020, 2025, 2030 and 2035; leased share 14%, 19%, 25% and 30%; GPU share 0.5%, 3.5%, 13% and 21%; edge and converted central office share 24%, 27%, 31% and 33%. IT hardware costs USD 2.45 million per network cloud MW-year and USD 8.20 million per AI MW-year in 2025; colocation and hosting average USD 190 per kW-month, so 969 leased MW x USD 190 x 12 = USD 2.21 billion. Owned-site electrical and mechanical spending is USD 2.14 billion and construction and fit-out USD 672.27 million. Sibling estimates use the same base: the Retail Data Center Market at about 8% of enterprise and colocation load, and network edge sites are a subset of the Edge Data Center Market.
Bound Checks
Ceiling 1: USD 18.54 billion is 3.3% of the DC Market Insights global data center market of USD 570.04 billion in 2025, between retail (3.0%) and banking (5.9%). Ceiling 2: China’s USD 3.89 billion is 9.8% of the RMB 285.5 billion (about USD 39.8 billion) that China Mobile, China Telecom and China Unicom spent on capital investment in 2025. Floor: China Telecom’s 3.2 GW of rack power and the 1,200 MW in the tracker show operator data center load in the gigawatts, consistent with 5,100 MW of own use worldwide. Every split sums to the total in every year, and the CAGR is recomputed from the 2025 and 2035 endpoints.
Table of contents
- 01Introduction
- 1.1Report Description
- 1.2Key Market Statistics, 2025, 2026, 2030 and 2035
- 02Executive Summary
- 2.1Market Snapshot, 2025, 2026 and 2035
- 2.2Market Size Chart, 2020-2035
- 03Market Scope
- 3.1Included
- 3.2Excluded
- 3.3How the Segments Fit Together
- 04Why Market Estimates Differ
- 4.1Scope Table: In and Out of This Estimate
- 05Market Drivers
- 5.1Copper Retirement Turns AT&T Wire Centers into Compute Sites
- 5.25.15 Million Chinese 5G Base Stations Feed Cloud-Native Cores
- 5.3Deutsche Telekom and SK Telecom Build Sovereign AI Clouds
- 06Market Trends
- 6.1Chinese Operators Shift Capital Expenditure to Computing Power
- 6.2MEC Phase 4 Standards Push Compute into Central Offices
- 6.3Japanese Operators Reuse a Former Sharp Factory for AI
- 07Market Challenges and Restraints
- 7.1Flat Service Revenue Caps Operator Capital Budgets
- 7.2EU Energy Rules Reach Every Operator Site Above 500 kW
- 08Market Opportunities
- 8.1Saudi Arabia's stc and HUMAIN Joint Venture
- 8.2Hosted Network Cloud and Leased Capacity
- 09Pricing Analysis
- 9.1Spending per MW, 2020-2035
- 9.2Public Price Anchors
- 10Standards and Regulation
- 10.1FCC Report and Order 26-19
- 10.2EU Digital Networks Act Proposal
- 10.3EU Gigabit Infrastructure Act
- 10.4EU Energy Efficiency Directive Article 12
- 10.5ETSI MEC Phase 4
- 10.6Japan Economic Security Promotion Act Cloud Program
- 10.7China National Computing Statistics
- 11Market Segmentation
- 11.1By Component
- 11.2IT Hardware
- 11.3Colocation and Hosted Network Cloud
- 11.4Electrical and Mechanical Infrastructure
- 11.5Construction and Fit-Out
- 11.6By Operator Type
- 11.7Integrated Fixed and Mobile Operators
- 11.8Mobile Network Operators
- 11.9Cable and Broadband Operators
- 11.10Wholesale and International Carriers
- 11.11Other Operators
- 11.12By Workload
- 11.13Core Network and Network Cloud
- 11.14OSS BSS and Corporate IT
- 11.15Edge Computing and Content Delivery
- 11.16Telco AI and GPU Cloud
- 11.17Backup Security and Other Workloads
- 11.18By Facility Type
- 11.19Core and Central Office Data Centers
- 11.20Network Edge and MEC Sites
- 11.21Colocation and Hosted Cloud
- 12DC Exclusive: Telco AI Factory Tracker
- 12.1Deutsche Telekom, Feb 2026
- 12.2SK Telecom (SK Group), Apr 2026
- 12.3SoftBank Corp., Jun 2024
- 12.4KDDI, Jun 2024
- 12.5stc (center3) with HUMAIN, 2026
- 12.6China Unicom, Mar 2026
- 12.7China Telecom, Mar 2026
- 12.8Telenor, May 2025
- 12.9Swisscom (with Fastweb), Jan 2024
- 13Regional Insights
- 13.1Asia Pacific
- 13.2North America
- 13.3Europe
- 13.4Latin America
- 13.5Middle East and Africa
- 14Country Analysis
- 14.1United States
- 14.2China
- 14.3Japan
- 14.4India
- 14.5Germany
- 14.6United Kingdom
- 14.7South Korea
- 14.8France
- 14.9Brazil
- 14.10Canada
- 14.11Saudi Arabia
- 14.12Italy
- 15Forecast Scenarios, 2035
- 15.1Low Scenario
- 15.2Base Scenario
- 15.3High Scenario
- 16Competitive Insights
- 16.1Server Supplier Concentration, 2025
- 16.2Huawei Technologies
- 16.3ZTE Corporation
- 16.4Ericsson
- 16.5Nokia
- 16.6Dell Technologies
- 16.7Hewlett Packard Enterprise
- 16.8Lenovo
- 16.9Inspur Information
- 16.10Cisco Systems
- 16.11NVIDIA
- 16.12Schneider Electric
- 16.13Vertiv
- 16.14Eaton
- 16.15Delta Electronics
- 16.16Microsoft (Azure Operator Nexus)
- 16.17Equinix
- 16.18Digital Realty
- 17Recent Developments
- 17.1AT&T Copper Exit Update, October 2026
- 17.2EU Data Center Rating Scheme, September 2026
- 17.3China 5G Base Stations, August 2026
- 17.4SK AI Data Center Ulsan, April 2026
- 17.5China Telecom Rack Power and Computing, March 2026
- 17.6Deutsche Telekom Industrial AI Cloud, February 2026
- 18Research Methodology
- 18.1Model Inputs
- 18.2Bound Checks
- Fig. 1Telecom Data Center Market Size, 2020-2035 (USD million)
- Table 1Market Snapshot, 2025, 2026 and 2035
- Table 2Scope Table: In and Out of This Estimate
- Table 3Spending per MW, 2020-2035
- Table 4Market by Component, 2025 and 2035
- Table 5Market by Operator Type, 2025 and 2035
- Table 6Market by Workload, 2025 and 2035
- Table 7Market by Facility Type, 2025 and 2035
- Table 8Telco AI Factory Tracker, 2024-2026
- Table 9Market by Region, 2025 and 2035
- Table 10Top 12 Countries, 2025 and 2035
- Table 112035 Forecast Scenarios
About this report
Written by Amit Jain and reviewed by Deepti Agrawal, Senior Editor, Research. Figures are built top-down and bottom-up and reconciled before publication, with 2025 as the base year.
Read our methodologyHow we built this
- Historical period2020-2024
- Base year2025
- Forecast period2026-2035
- Sizing approachTop-down + bottom-up
Need more than the report?
Advisory on this market
Due diligence, site selection and market entry work, by the analysts who wrote this report.
See consulting servicesFrequently asked questions
USD 20.04 billion in 2026, up 8.09% from USD 18.54 billion in 2025, according to DC Market Insights estimates. The market is projected to reach USD 38.51 billion by 2035, a CAGR of 7.58% from 2025.
7.58% a year from 2025 to 2035, after 5.59% a year from 2020 to 2025, as operator IT load in use rises from 5,100 MW to 8,350 MW and GPU racks climb from 3.5% to 21% of it.
USD 18.54 billion in 2025 was spent on data center capacity that carriers own or lease for their own networks and services: 5G and voice cores, central offices rebuilt as data centers, MEC edge sites, OSS/BSS systems and operator-run GPU clouds. Colocation sold to outside customers is not counted.
More than 100 AT&T wire centers have no customers left on legacy services, and AT&T targets copper discontinuation in 50% of wire centers outside California. Freed space and power become network cloud and edge sites, worth USD 12.71 billion by 2035.
1,200 MW is disclosed across 9 programs in the DC Market Insights tracker: China Unicom’s seven 100 MW-class campuses, stc’s 250 MW first phase with HUMAIN, SoftBank’s 150 MW Sakai site and SK Telecom’s 100 MW Ulsan campus; Deutsche Telekom runs up to 10,000 GPUs in Munich.
Telco AI and GPU cloud grows fastest at 20.48% a year to USD 11.82 billion by 2035; among facility types, colocation and hosted cloud leads at 12.61%, while core and central office sites grow 3.59%.
Asia Pacific, with USD 7.42 billion or 40.0% of 2025 value. Middle East and Africa grows fastest at 9.56% a year, and India is the fastest large country at 12.03%.
92.5 EFLOPS at China Mobile, 91 EFLOPS self-owned and accessed at China Telecom and 45 EFLOPS at China Unicom at the end of 2025, per their annual results. China Telecom also reported more than 3.2 GW of rack power capacity.
USD 3.64 million per MW in use in 2025, DC Market Insights estimates, rising to USD 4.61 million by 2035. A telco AI rack costs USD 8.20 million per MW-year of servers against USD 2.45 million for network cloud.
USD 20.04 billion in 2026 counts only capacity operators use for their own networks and services. Estimates that add colocation sold to outside customers, radio and transmission equipment or network software come out several times larger.
Licences, delivery and payment
Which licence should I choose?
Single User is a view-only PDF for one person. Multi User adds a printable PDF and the Excel data for unlimited users at one location. Enterprise covers your whole company and includes 100 free analyst hours.
How and when will I receive the report?
By email, within 24–48 business hours of payment, in the formats of your licence.
How can I pay?
Securely through PayPal: with a PayPal account, a debit or credit card, or PayPal Pay Later where available. Prices are in US dollars.
Can I see a sample first?
Yes. Request a free sample and we will email it to you.
Can the report be tailored to my needs?
Yes. We can add countries, segments or data cuts. Talk to an analyst about the scope you need.
Can I get an invoice or pay against a purchase order?
Write to sales@dcmarketinsights.com and our team will help.