
Middle East Data Center Infrastructure Market Size, Share & Forecast to 2035
Market at a glance
The Middle East Data Center Infrastructure market was worth USD 3,660.0 million in 2025 and is forecast to reach USD 13.61 billion by 2035, growing at a 14.03% CAGR.
 By Amit Jain, Senior Consultant, ICT & Emerging Technologies
 Reviewed by Deepti Agrawal
Last updated 3 Nov 2026
Base year 2025 PDF + Excel
Key findings
Stargate UAE and the Microsoft-G42 expansion add 400 MW of Abu Dhabi halls
Liquid cooling replaces air-only chiller plants in AI halls
Grid connections and cooling water cap campus phasing
AI campus electrical packages in Saudi Arabia and the UAE
What is inside the report
- 01Market Overview
- 02Executive Summary
- 03Market Scope
- 04Market Drivers
- 05Market Trends
- 06Market Challenges
- 07Market Opportunities
- 08Pricing Analysis
- 09Standards and Regulation
- 10Market Segmentation
- 17chapters
- 2020-2024Historical period
- 2026-2035Forecast period
- —Companies profiled
Segmentation
Recent developments
Microsoft said Saudi Arabia East opens to customers in November 2026, and AWS said its Saudi region is on track for December 2026 (Source: Microsoft, Amazon).
AMD, Cisco and HUMAIN said AMD Instinct systems were live and set a target of up to 1 GW by 2030 (Source: AMD).
MCIT reported Saudi operational data center capacity above 440 MW for 2025, up from 68 MW in 2021 (Source: MCIT).
Microsoft and G42 announced a 200 MW UAE expansion with Khazna Data Centers (Source: Microsoft).
center3 set a target of 300 MW of installed capacity by 2027 (Source: center3).
G42 and OpenAI launched Stargate UAE, a 1 GW cluster with 200 MW expected live in 2026 (Source: G42).
Full analysis
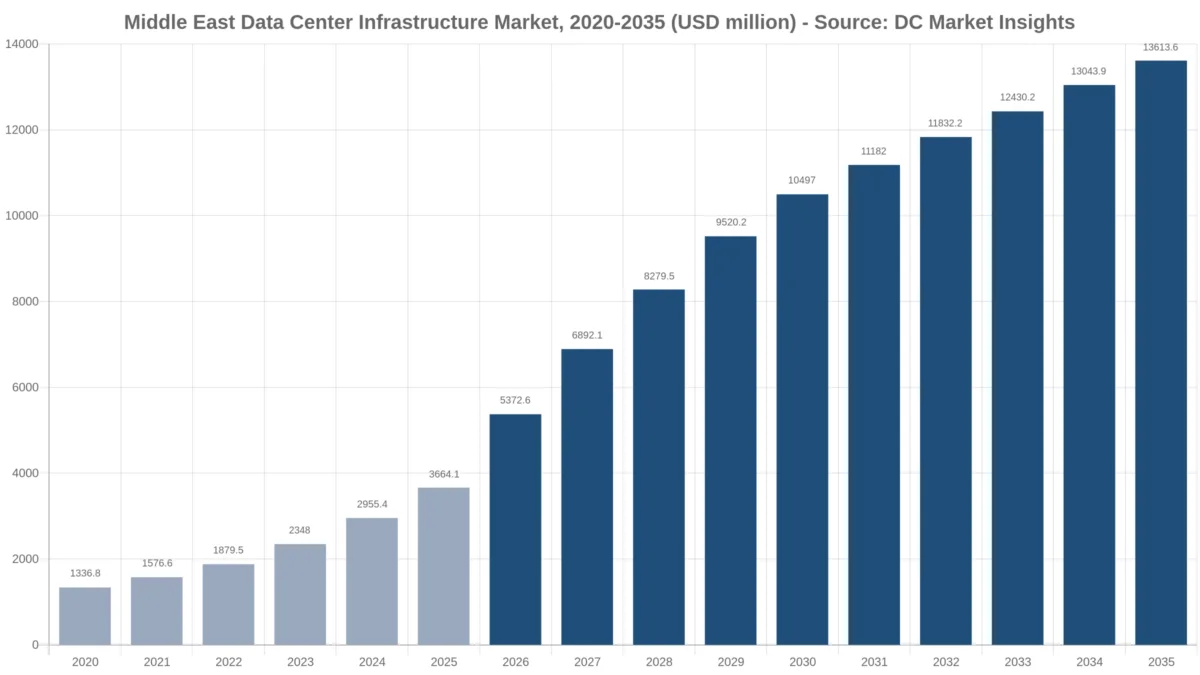
The Middle East Data Center Infrastructure Market is valued at USD 5.37 billion in 2026 and is projected to reach USD 13.61 billion by 2035, up from USD 3.66 billion in 2025, a CAGR of 14.03% from 2025 to 2035 (DC Market Insights estimate). Middle East Data Center Infrastructure covers the electrical, mechanical and cooling, civil and shell, rack fit-out and lifecycle upgrade spend that turns land and grid power into usable data center halls across twelve countries from Turkey to Oman. Desert heat and sovereign-cloud law move the money here: Saudi operational capacity rose from 68 MW in 2021 to more than 440 MW in 2025 (Source: Ministry of Communications and Information Technology (MCIT)), and every hall built for 45 °C summer air needs about USD 0.4 million more cooling plant per megawatt than a European hall, DC Market Insights estimates. The 2025 build receipt is 320 MW of new IT capacity × USD 9.83 million per MW = USD 3.15 billion, plus 1,673 MW of installed capacity × USD 0.31 million of lifecycle upgrades = USD 518.51 million. Halls above 50 kW per rack grow fastest at 25.78% a year, and Saudi Arabia is the fastest region at 16.75% as HUMAIN and the new Amazon Web Services (AWS) and Microsoft regions fill Riyadh and Dammam.
How Much Will the Middle East Spend Building Data Center Halls in 2026?
The Middle East will spend USD 5.37 billion on data center infrastructure in 2026, 46.63% more than the USD 3.66 billion of 2025, DC Market Insights estimates, because new IT capacity jumps from 320 MW to about 470 MW.
- Market size 2025: USD 3.66 billion
- Market size 2026: USD 5.37 billion
- Market size 2030: USD 10.50 billion
- Market size 2035: USD 13.61 billion
- CAGR 2025-2035: 14.03% (low case 11.51%, high case 16.03%)
- Largest infrastructure type: Electrical Infrastructure, 38% of 2025 value
- Fastest rack density: Above 50 kW per Rack, 25.78% CAGR
- Leading region: United Arab Emirates, 31% of 2025 value; fastest region: Saudi Arabia, 16.75% CAGR
- Largest country: United Arab Emirates, USD 1.14 billion in 2025
- Market leaders: Schneider Electric, Vertiv and Huawei Digital Power, about 38% of 2025 electrical and cooling equipment value together (DC Market Insights estimate)
Key Takeaways: Four Numbers for Gulf Contractors and Equipment Suppliers
Four numbers explain where the USD 13.61 billion of 2035 Middle East data center infrastructure spend comes from.
- Halls above 50 kW per rack rise from 18% to 48% of Middle East data center infrastructure value by 2035 because GPU clusters in Abu Dhabi and Riyadh need liquid cooling and heavier power trains.
- Hyperscale and AI Campuses grow 17.10% a year because Stargate UAE, HUMAIN and three hyperscale cloud regions build at the gigawatt scale.
- Saudi Arabia overtakes the United Arab Emirates by 2035, at 38% of value, because MCIT targets more than 1,300 MW of data center capacity before 2030.
- Enterprise and Government halls grow only 7.41% a year because ministries and banks move into sovereign-cloud and colocation space instead of building their own rooms.
Executive Summary: How Fast Is Gulf Hall Construction Growing, 2020-2035?
Middle East data center infrastructure spend nearly triples from 2020 to 2025. The Middle East Data Center Infrastructure Market size was valued at USD 1.34 billion in 2020, reached USD 3.66 billion in 2025, and is anticipated to reach USD 13.61 billion by 2035, at a CAGR of 14.03% during the forecast period. Growth from 2020 to 2025 ran at 22.34% a year because annual IT capacity additions rose from about 130 MW to 320 MW.
| Attribute | Detail |
|---|---|
| Historical period | 2020-2024 |
| Base year | 2025 |
| Forecast period | 2026-2035 |
| Market size 2025 | USD 3.66 billion |
| Market size 2026 | USD 5.37 billion |
| CAGR 2025-2035 | 14.03% |
| Market size 2035 | USD 13.61 billion |
DC Market Insights values new-build infrastructure at USD 3.15 billion in 2025 and lifecycle upgrades on the installed base at USD 518.51 million; by 2035 the two lines reach USD 10.54 billion and USD 3.08 billion. Annual additions flatten at 820 to 880 MW from 2030, so the upgrade line carries a rising share of Middle East spend after the first AI campuses are built.
What Does Middle East Data Center Infrastructure Spend Include?
Middle East Data Center Infrastructure covers USD 3.66 billion of 2025 facility spend in Saudi Arabia, the United Arab Emirates (UAE), Israel, Turkey, Qatar, Kuwait, Oman, Bahrain, Iran, Jordan, Iraq and Lebanon.
Included: medium-voltage switchgear, transformers, uninterruptible power supply (UPS) systems, generators, busway and power distribution; chillers, computer room air handlers, coolant distribution units and heat rejection; civil works, structure and building shell; racks, containment and white-space fit-out; and lifecycle upgrades and retrofits in operating halls.
Excluded: servers, storage and network equipment (storage sits in the Middle East Data Center Storage Market), land, electricity bills, cloud and colocation revenue (see the Middle East Data Center Market), and data center infrastructure management (DCIM) software, which has its own Middle East edition. North Africa, including Egypt, sits in the Africa editions and carries 0% of this total.
How the segments fit together: each of the four segment dimensions and the five regions adds up to the same total in every year, and the twelve countries add up to the five regions. Saudi figures reconcile with the KSA Data Center Infrastructure Market, which reaches USD 5.35 billion by 2035 against USD 5.17 billion for the Saudi line here.
Why Do Middle East Data Center Infrastructure Market Estimates Differ?
DC Market Insights puts Middle East data center infrastructure at USD 5.37 billion in 2026. Published 2025 figures differ by more than two times because some editions add IT equipment and North Africa.
Broader definitions add servers, storage and networking bought for the halls, infrastructure management software, Egypt and the rest of Africa, and the electricity and land under each campus. The earlier DC Market Insights edition of the Middle East Data Center Infrastructure Market reached USD 3.97 billion for 2025 on a basis that mixed facility and IT spend; this edition replaces it with a bottom-up figure of USD 3.66 billion that counts only facility infrastructure and lifecycle upgrades. Infrastructure management tools, environment monitoring, asset management and bi and analytics dashboards are DCIM software and sit outside this scope, while power monitoring meters and sensors wired into switchgear are counted in Electrical Infrastructure. Processors from Intel Corporation, NVIDIA and AMD are IT equipment and are excluded. Public sector buyers, BFSI (banking, financial services and insurance) firms, IT and ITES (IT-enabled services) companies, healthcare and life sciences operators and medium sized enterprises that build their own rooms are in scope through the Enterprise and Government segment, and cloud and edge sites through the Hyperscale and Edge segments. Algeria, Morocco and Nigeria, which some Middle East and Africa editions include, carry 0% of this total.
| Element | In this report | Why |
|---|---|---|
| Electrical, mechanical and shell works | Yes (USD 3.00 billion in 2025) | Core facility spend |
| Racks, fit-out and lifecycle upgrades | Yes (USD 659.54 million in 2025) | Bought with the halls |
| Servers, storage and network gear | No | IT equipment |
| DCIM software | No | Separate Middle East edition |
| Egypt and North Africa | No | Covered by Africa editions |
Market Drivers: What Is Pushing Gulf Data Center Construction in 2026?
Three dated programmes lift Middle East new IT additions from 320 MW in 2025 to about 470 MW in 2026, adding about USD 1.71 billion of infrastructure spend, DC Market Insights estimates.
Stargate UAE and the Microsoft-G42 expansion add 400 MW of Abu Dhabi halls
G42 and OpenAI plan a 1 GW Stargate UAE cluster with 200 MW expected live in 2026 (Source: G42 release), and Microsoft and G42 announced a further 200 MW with Khazna Data Centers in November 2025 (Source: Microsoft). At USD 11.0 million of facility infrastructure per AI megawatt, those 400 MW carry about USD 4.4 billion of electrical, cooling and shell works over 2025-2027, DC Market Insights estimates.
Saudi residency rules keep sovereign workloads in Kingdom halls
The NCA Cloud Cybersecurity Controls (CCC-1:2020) require cloud providers to run storage, processing and disaster-recovery systems inside Saudi Arabia (Source: National Cybersecurity Authority (NCA)). Microsoft said its Saudi Arabia East region opens to customers in November 2026 (Source: Microsoft), and AWS said its Saudi region, backed by more than USD 5.3 billion, is on track for December 2026 (Source: Amazon). Each three-zone region needs separate halls, so Saudi Arabia takes 30% of Middle East infrastructure value in 2025 and 38% by 2035.
HUMAIN AI factories set a 1 GW Saudi build target
HUMAIN, the AI company of the Public Investment Fund (PIF), and NVIDIA plan AI factories of up to 500 MW over five years (Source: NVIDIA, 13 May 2025), and the AMD, Cisco and HUMAIN venture targets up to 250 MW in 2027 and 1 GW by 2030 (Source: AMD). DC Market Insights estimates those two programmes alone hold about USD 8.5 billion of facility infrastructure at 2027 rates.
Market Trends: How Are Gulf Data Center Designs Changing?
The share of Middle East data center infrastructure spent on halls above 50 kW per rack rises from 18% in 2025 to 48% in 2035, DC Market Insights estimates, as AI clusters change power and cooling design.
Liquid cooling replaces air-only chiller plants in AI halls
Mechanical and Cooling Infrastructure holds USD 989.31 million in 2025 and grows 14.03% a year, because GB300-class racks in the HUMAIN first phase of 18,000 systems (Source: NVIDIA) cannot be cooled with air alone in Gulf summers; the coolant loop and dry coolers add about USD 0.9 million of mechanical cost per megawatt to an AI hall, net of the smaller air plant.
Prefabricated power and cooling modules shorten Gulf build times
Prefabricated and Modular delivery grows 17.35% a year to USD 4.36 billion by 2035 because skid-mounted electrical rooms and factory-built chiller plants cut site labour in 45 °C summers and let Riyadh and Abu Dhabi campuses energise phases in 12 to 18 months.
Market Challenges: What Slows Middle East Data Center Infrastructure Spending?
Two limits keep the 2035 base case of USD 13.61 billion about USD 2.59 billion below the high case, DC Market Insights estimates: grid and water limits in the Gulf, and conflict risk in the northern Middle East.
Grid connections and cooling water cap campus phasing
A 200 MW campus needs a dedicated 400 kV or 132 kV substation and, with evaporative cooling, up to 1.8 million cubic metres of water a year, DC Market Insights estimates; operators that choose dry coolers to save water pay about 8% more for mechanical plant. A one-year delay on half of the 2026 AI halls, about 99 MW, would move about USD 1.1 billion of spend into 2027.
Conflict and sanctions limit Iran, Iraq and Lebanon
Iran, Iraq and Lebanon together hold only 4.2% of 2025 Middle East data center infrastructure value, and Iran grows 6.81% a year because export controls limit access to Western UPS and chiller suppliers. Israel grows 10.03% a year, slower than the Gulf, because its announced campus pipeline is far smaller than Saudi Arabia’s.
Market Opportunities: Which Gulf Contracts Are Still Open to Suppliers?
Two buyer groups hold 82% of 2035 Middle East data center infrastructure spend, DC Market Insights estimates, and both still tender large packages.
AI campus electrical packages in Saudi Arabia and the UAE
Electrical Infrastructure reaches USD 5.04 billion by 2035. Oracle committed USD 14 billion over ten years in Saudi Arabia in May 2025 (Source: Oracle), and Microsoft spent more than USD 4.6 billion of AI and cloud data center capital expenditure in the UAE by the end of 2025 (Source: Microsoft); switchgear, UPS and medium-voltage packages are tendered phase by phase, which keeps room for second-tier suppliers.
Colocation expansions by center3 and Khazna
Colocation Facilities reach USD 2.99 billion by 2035. center3, the data center arm of stc, targets 300 MW of installed capacity by 2027 and 1 GW by 2030 (Source: center3), and each 100 MW step costs about USD 0.95 billion of facility works at the 2027 rate of USD 9.53 million per megawatt, DC Market Insights estimates.
What Does a Megawatt of Data Center Infrastructure Cost in the Gulf?
A conventional Middle East data center hall costs about USD 9.20 million of facility infrastructure per megawatt of IT capacity in 2025, and an AI hall about USD 11.00 million, DC Market Insights estimates.
| Year | Conventional hall (USD million per MW) | AI hall (USD million per MW) | Lifecycle upgrades (USD million per installed MW-year) | New IT capacity (MW) |
|---|---|---|---|---|
| 2020 | 8.41 | 10.36 | 0.28 | 130 |
| 2025 | 9.20 | 11.00 | 0.31 | 320 |
| 2030 | 10.06 | 11.68 | 0.34 | 820 |
| 2035 | 11.00 | 12.39 | 0.38 | 880 |
Contractors do not publish Gulf prices per megawatt, so the rates are calibrated on disclosed campus budgets. A useful public anchor is the Microsoft and G42 plan of 200 MW announced in November 2025 against Microsoft’s more than USD 4.6 billion of UAE AI and cloud capital expenditure (Source: Microsoft); facility works are typically 25% to 35% of such totals, the rest being IT equipment.
Which Rules and Standards Shape Gulf Data Center Builds?
Five rules decide where Middle East data center halls are built and how they are designed, touching an estimated USD 1.41 billion of regulated and sovereign-cloud infrastructure spend in 2025.
- NCA Cloud Cybersecurity Controls (CCC-1:2020): cloud storage, processing and disaster-recovery systems inside Saudi Arabia (Source: NCA).
- UAE Federal Decree-Law No. 45 of 2021 on personal data protection, in force 2 January 2022 (Source: UAE Government portal).
- Saudi Personal Data Protection Law and its transfer regulation (Source: Saudi Data and AI Authority (SDAIA)).
- Dubai and Abu Dhabi civil defence fire codes for battery rooms and diesel storage (Source: UAE civil defence authorities).
- ANSI/TIA-942 and EN 50600 design classes used in Gulf tender documents for availability levels (Source: TIA, CENELEC).
Market Segmentation: Which Infrastructure Type Takes the Largest Share of Gulf Hall Budgets?
Electrical Infrastructure leads with USD 1.39 billion, 38% of 2025 value, and Above 50 kW per Rack is the fastest segment at 25.78% a year, DC Market Insights estimates.
By Infrastructure Type
Lifecycle Services and Upgrades grow fastest at 16.93% a year because the installed base grows from about 1,968 MW to 8,898 MW.
| Segment | 2025 (USD million) | Share 2025 | 2035 (USD million) | CAGR 2025-2035 |
|---|---|---|---|---|
| Electrical Infrastructure | 1,392.36 | 38% | 5,037.03 | 13.72% |
| Mechanical and Cooling Infrastructure | 989.31 | 27% | 3,675.67 | 14.03% |
| Civil Structural and Shell | 622.90 | 17% | 1,769.77 | 11.01% |
| Racks and White Space Fit-Out | 146.56 | 4% | 680.68 | 16.60% |
| Lifecycle Services and Upgrades | 512.98 | 14% | 2,450.44 | 16.93% |
By Data Center Type
Hyperscale and AI Campuses rise from 46% to 60% of Middle East data center infrastructure value by 2035.
| Segment | 2025 (USD million) | Share 2025 | 2035 (USD million) | CAGR 2025-2035 |
|---|---|---|---|---|
| Hyperscale and AI Campuses | 1,685.49 | 46% | 8,168.15 | 17.10% |
| Colocation Facilities | 952.67 | 26% | 2,994.99 | 12.14% |
| Enterprise and Government | 732.82 | 20% | 1,497.49 | 7.41% |
| Edge and Telecom Sites | 293.13 | 8% | 952.96 | 12.51% |
By Rack Density
Halls below 20 kW per rack fall from 52% to 22% of value as AI designs take over new builds.
| Segment | 2025 (USD million) | Share 2025 | 2035 (USD million) | CAGR 2025-2035 |
|---|---|---|---|---|
| Below 20 kW per Rack | 1,905.34 | 52% | 2,994.99 | 4.63% |
| 20 to 50 kW per Rack | 1,099.23 | 30% | 4,084.08 | 14.03% |
| Above 50 kW per Rack | 659.54 | 18% | 6,534.52 | 25.78% |
By Delivery Model
Stick-built engineering, procurement and construction (EPC) contracts keep 62% of 2025 value, but prefabricated delivery gains ground.
| Segment | 2025 (USD million) | Share 2025 | 2035 (USD million) | CAGR 2025-2035 |
|---|---|---|---|---|
| Stick-Built EPC | 2,271.75 | 62% | 6,806.80 | 11.60% |
| Prefabricated and Modular | 879.39 | 24% | 4,356.35 | 17.35% |
| Retrofit and Upgrade | 512.97 | 14% | 2,450.44 | 16.93% |
DC Exclusive: Gulf Cost-per-MW Teardown, Conventional vs AI Hall
An AI hall in the Gulf costs USD 1.80 million more per megawatt than a conventional hall. The Gulf Cost-per-MW Teardown is a DC Market Insights estimate built on 10 inputs that splits 2025 facility cost for a 100 MW Riyadh or Abu Dhabi campus into its line items.
| Line item | Conventional hall (USD million per MW) | AI hall above 50 kW per rack (USD million per MW) | Why the AI hall differs |
|---|---|---|---|
| Medium-voltage switchgear and transformers | 1.25 | 1.45 | Higher load density per hall |
| UPS, batteries and power distribution | 1.40 | 1.65 | Heavier busway and rack feeds |
| Generators and fuel systems | 0.90 | 1.10 | N+1 sets per larger block |
| Chillers and heat rejection | 1.55 | 1.70 | Dry coolers for 45 °C summers |
| Air handling and containment | 0.95 | 0.50 | Less air, more liquid |
| Coolant distribution and liquid loops | 0.00 | 1.20 | Direct-to-chip cooling |
| Civil works and building shell | 2.30 | 2.40 | Heavier floor loads |
| Racks and white-space fit-out | 0.85 | 1.00 | Wider, heavier racks |
| Total | 9.20 | 11.00 | +USD 1.80 million per MW |
Applied to the 2025 build, the teardown explains the receipt: 208 conventional MW × USD 9.20 million + 112 AI MW × USD 11.00 million = USD 3.15 billion. Cooling lines carry 27% of a conventional Gulf hall and 31% of an AI hall, which is why chiller and liquid-cooling suppliers tracked in the Data Center Chiller Market see the Gulf as one of their fastest regions.
Regional Insights: Why Does Saudi Arabia Overtake the UAE in Data Center Construction?
The United Arab Emirates leads with USD 1.14 billion, 31% of 2025 value, DC Market Insights estimates. Saudi Arabia is the fastest-growing region at 16.75% a year and leads by 2035.
| Region | 2025 (USD million) | Share 2025 | 2035 (USD million) | CAGR 2025-2035 |
|---|---|---|---|---|
| Saudi Arabia | 1,099.23 | 30% | 5,173.16 | 16.75% |
| United Arab Emirates | 1,135.87 | 31% | 4,356.35 | 14.39% |
| Other GCC States | 476.33 | 13% | 1,633.63 | 13.12% |
| Israel | 366.41 | 10% | 952.95 | 10.03% |
| Turkey and Rest of Middle East | 586.27 | 16% | 1,497.50 | 9.83% |
Saudi Arabia
MCIT counts more than 440 MW of operational capacity in 2025 against a target above 1,300 MW before 2030, and Riyadh, Dammam and the HUMAIN campuses take most new halls. Data center infrastructure spend here rises from USD 1.10 billion in 2025 to USD 5.17 billion in 2035, a CAGR of 16.75%.
United Arab Emirates
Abu Dhabi’s Stargate UAE and the Microsoft-G42 expansion add 400 MW of AI halls from 2026, while Dubai keeps the largest colocation base. Data center infrastructure spend here rises from USD 1.14 billion in 2025 to USD 4.36 billion in 2035, a CAGR of 14.39%.
Other GCC States
Qatar, Kuwait, Oman and Bahrain build cloud-region and government halls; Oman’s Muscat and Salalah sites add subsea-cable landing demand. Data center infrastructure spend here rises from USD 476.33 million in 2025 to USD 1.63 billion in 2035, a CAGR of 13.12%.
Israel
The AWS Tel Aviv region, with up to ILS 26.6 billion of planned investment for 2023-2037 (Source: AWS), anchors halls around Tel Aviv and the Negev. Data center infrastructure spend here rises from USD 366.41 million in 2025 to USD 952.95 million in 2035, a CAGR of 10.03%.
Turkey and Rest of Middle East
Istanbul and Ankara colocation halls carry most of this region, while Iran, Iraq, Jordan and Lebanon stay small because of sanctions and conflict. Data center infrastructure spend here rises from USD 586.27 million in 2025 to USD 1.50 billion in 2035, a CAGR of 9.83%.
Which Middle East Countries Spend the Most on Data Center Infrastructure?
The United Arab Emirates is the largest country with 31% of 2025 Middle East data center infrastructure value, DC Market Insights estimates. Saudi Arabia is the fastest large country at 16.75% a year, and Oman grows 15.80% a year on new Muscat and Salalah halls.
| Rank | Country | Region | 2025 (USD million) | 2035 (USD million) | CAGR 2025-2035 |
|---|---|---|---|---|---|
| 1 | United Arab Emirates | United Arab Emirates | 1,135.87 | 4,356.35 | 14.39% |
| 2 | Saudi Arabia | Saudi Arabia | 1,099.23 | 5,173.16 | 16.75% |
| 3 | Turkey | Turkey and Rest of Middle East | 384.73 | 1,021.02 | 10.25% |
| 4 | Israel | Israel | 366.41 | 952.95 | 10.03% |
| 5 | Qatar | Other GCC States | 164.88 | 476.48 | 11.20% |
| 6 | Kuwait | Other GCC States | 109.92 | 367.57 | 12.83% |
| 7 | Oman | Other GCC States | 109.92 | 476.48 | 15.80% |
| 8 | Bahrain | Other GCC States | 91.60 | 313.11 | 13.08% |
| 9 | Iran | Turkey and Rest of Middle East | 91.60 | 176.98 | 6.81% |
| 10 | Jordan | Turkey and Rest of Middle East | 47.63 | 136.14 | 11.07% |
| 11 | Iraq | Turkey and Rest of Middle East | 40.31 | 122.52 | 11.76% |
| 12 | Lebanon | Turkey and Rest of Middle East | 21.98 | 40.84 | 6.39% |
Forecast Scenarios: Where Could Gulf Data Center Infrastructure Spend Land in 2035?
The Middle East Data Center Infrastructure Market reaches between USD 10.89 billion and USD 16.20 billion by 2035, with a base case of USD 13.61 billion, DC Market Insights estimates.
| Scenario | 2035 value | CAGR 2025-2035 | What has to happen |
|---|---|---|---|
| Low | USD 10.89 billion | 11.51% | AI campuses slip two years and annual additions settle near 650 MW |
| Base | USD 13.61 billion | 14.03% | About 8,898 MW installed by 2035; AI share of new capacity 70% |
| High | USD 16.20 billion | 16.03% | Stargate UAE reaches 1 GW and HUMAIN builds its full pipeline on schedule |
Key Players and Market Share: Who Supplies Middle East Data Center Infrastructure?
Three suppliers hold about 38% of 2025 Middle East electrical and cooling equipment value, DC Market Insights estimates: Schneider Electric, Vertiv and Huawei Digital Power. The estimate rests on installed UPS, switchgear and cooling plant in Gulf cloud, colocation and government halls.
- Schneider Electric
- Vertiv
- Huawei Digital Power
- ABB
- Eaton
- Siemens
- Legrand
- Johnson Controls
- Carrier
- Trane Technologies
- Rittal
- Caterpillar
- Cummins
- Khazna Data Centers
- center3
- Gulf Data Hub
Khazna Data Centers, center3 and Gulf Data Hub buy infrastructure as developers and operators rather than sell it, but their tenders set the packages that equipment makers compete for. center3 says it aims for 300 MW of installed capacity by 2027 (Source: center3), and Khazna is the build partner for the 200 MW Microsoft-G42 expansion (Source: Microsoft).
Recent Developments: What Changed in Gulf Data Center Construction in 2025 and 2026?
Six dated events since May 2025 moved Middle East data center infrastructure demand.
- In August 2026, Microsoft said Saudi Arabia East opens to customers in November 2026, and AWS said its Saudi region is on track for December 2026 (Source: Microsoft, Amazon).
- In August 2026, AMD, Cisco and HUMAIN said AMD Instinct systems were live and set a target of up to 1 GW by 2030 (Source: AMD).
- In April 2026, MCIT reported Saudi operational data center capacity above 440 MW for 2025, up from 68 MW in 2021 (Source: MCIT).
- In November 2025, Microsoft and G42 announced a 200 MW UAE expansion with Khazna Data Centers (Source: Microsoft).
- In August 2025, center3 set a target of 300 MW of installed capacity by 2027 (Source: center3).
- In May 2025, G42 and OpenAI launched Stargate UAE, a 1 GW cluster with 200 MW expected live in 2026 (Source: G42).
Research Methodology: How the Model Prices Middle East Halls Megawatt by Megawatt
The 2025 base of USD 3.66 billion is built bottom-up from 320 MW of new IT capacity and 1,673 MW of installed capacity. The Middle East data center infrastructure model adds new IT megawatts each year (about 130 MW in 2020, 320 MW in 2025, 820 MW in 2030 and 880 MW in 2035), splits them into conventional and AI halls (AI share 35% in 2025 and 70% in 2035), prices them at USD 9.20 million and USD 11.00 million per megawatt in 2025, and adds USD 0.31 million of lifecycle upgrades per installed megawatt, with 1.5% of the base retired each year. The 2025 receipt is USD 3.15 billion + USD 518.51 million = USD 3.66 billion. Bound checks: (1) ceiling — 2025 and 2026 spend together, USD 9.04 billion, is 38% of the USD 23.9 billion committed in three disclosed programmes (AWS Saudi USD 5.3 billion, Oracle Saudi USD 14 billion, Microsoft UAE USD 4.6 billion), consistent with facility works being a minority of campus budgets; (2) ceiling — Saudi capacity grew from 68 MW to 440 MW in 2021-2025, about 93 MW a year, or 29% of 2025 regional additions, matching the 30% Saudi share; (3) floor — 93 MW × USD 9.20 million = USD 855.60 million, below the Saudi 2025 line of USD 1.10 billion. Model limitations: there is no regression; scenario sensitivity comes from the low and high cases; prices are calibrated, not quoted. See our research methodology.
Table of contents
- 01Market Overview
- 1.1Market Snapshot, 2025, 2026 and 2035
- 1.2Key Market Statistics
- 1.3Key Takeaways
- 02Executive Summary
- 2.1Market Size 2020-2035
- 2.2New-Build vs Lifecycle Spend
- 03Market Scope
- 3.1Included Infrastructure
- 3.2Excluded Spend
- 3.3How the Segments Fit Together
- 3.4Why Estimates Differ
- 04Market Drivers
- 4.1Stargate UAE and the Microsoft-G42 Expansion
- 4.2Saudi Residency Rules and New Cloud Regions
- 4.3HUMAIN AI Factories
- 05Market Trends
- 5.1Liquid Cooling in AI Halls
- 5.2Prefabricated Power and Cooling Modules
- 06Market Challenges
- 6.1Grid Connections and Cooling Water
- 6.2Conflict and Sanctions
- 07Market Opportunities
- 7.1AI Campus Electrical Packages
- 7.2Colocation Expansions by center3 and Khazna
- 08Pricing Analysis
- 8.1Cost per MW, 2020-2035
- 09Standards and Regulation
- 9.1NCA Cloud Cybersecurity Controls
- 9.2UAE and Saudi Data Protection Laws
- 9.3Design Classes in Gulf Tenders
- 10Market Segmentation
- 10.1By Infrastructure Type: Electrical Infrastructure
- 10.2By Infrastructure Type: Mechanical and Cooling Infrastructure
- 10.3By Infrastructure Type: Civil Structural and Shell
- 10.4By Infrastructure Type: Racks and White Space Fit-Out
- 10.5By Infrastructure Type: Lifecycle Services and Upgrades
- 10.6By Data Center Type: Hyperscale and AI Campuses
- 10.7By Data Center Type: Colocation Facilities
- 10.8By Data Center Type: Enterprise and Government
- 10.9By Data Center Type: Edge and Telecom Sites
- 10.10By Rack Density: Below 20 kW per Rack
- 10.11By Rack Density: 20 to 50 kW per Rack
- 10.12By Rack Density: Above 50 kW per Rack
- 10.13By Delivery Model: Stick-Built EPC
- 10.14By Delivery Model: Prefabricated and Modular
- 10.15By Delivery Model: Retrofit and Upgrade
- 11DC Exclusive: Gulf Cost-per-MW Teardown
- 11.1Conventional Hall Line Items
- 11.2AI Hall Line Items
- 12Regional Insights
- 12.1Saudi Arabia
- 12.2United Arab Emirates
- 12.3Other GCC States
- 12.4Israel
- 12.5Turkey and Rest of Middle East
- 13Country Analysis
- 13.1United Arab Emirates
- 13.2Saudi Arabia
- 13.3Turkey
- 13.4Israel
- 13.5Qatar
- 13.6Kuwait
- 13.7Oman
- 13.8Bahrain
- 13.9Iran
- 13.10Jordan
- 13.11Iraq
- 13.12Lebanon
- 14Forecast Scenarios
- 14.1Low Case
- 14.2Base Case
- 14.3High Case
- 15Competitive Insights
- 15.1Schneider Electric
- 15.2Vertiv
- 15.3Huawei Digital Power
- 15.4ABB
- 15.5Eaton
- 15.6Siemens
- 15.7Legrand
- 15.8Johnson Controls
- 15.9Carrier
- 15.10Trane Technologies
- 15.11Rittal
- 15.12Caterpillar
- 15.13Cummins
- 15.14Khazna Data Centers
- 15.15center3
- 15.16Gulf Data Hub
- 16Recent Developments
- 16.12026 Developments
- 16.22025 Developments
- 17Research Methodology
- 17.1Model Receipt
- 17.2Bound Checks
- Fig. 1Middle East Data Center Infrastructure Market Size, 2020-2035
- Table 1Executive Summary Attributes
- Table 2Scope Comparison
- Table 3Cost per MW, 2020-2035
- Table 4Segments by Infrastructure Type
- Table 5Segments by Data Center Type
- Table 6Segments by Rack Density
- Table 7Segments by Delivery Model
- Table 8Gulf Cost-per-MW Teardown
- Table 9Regional Market Size
- Table 10Top 12 Countries
- Table 11Forecast Scenarios 2035
About this report
Written by Amit Jain and reviewed by Deepti Agrawal, Senior Editor, Research. Figures are built top-down and bottom-up and reconciled before publication, with 2025 as the base year.
Read our methodologyHow we built this
- Historical period2020-2024
- Base year2025
- Forecast period2026-2035
- Sizing approachTop-down + bottom-up
Need more than the report?
Advisory on this market
Due diligence, site selection and market entry work, by the analysts who wrote this report.
See consulting servicesFrequently asked questions
USD 5.37 billion in 2026, up 46.63% from USD 3.66 billion in 2025, according to DC Market Insights estimates. The market is projected to reach USD 13.61 billion by 2035, a CAGR of 14.03% from 2025, as new IT capacity rises from 320 MW to about 470 MW a year.
USD 9.20 million per MW for a conventional hall and USD 11.00 million for an AI hall in 2025, DC Market Insights estimates. Liquid cooling, heavier power trains and dry coolers for 45 °C summers explain the USD 1.80 million gap.
The United Arab Emirates, with USD 1.14 billion or 31% of 2025 value. Saudi Arabia grows faster, at 16.75% a year, and leads by 2035 with USD 5.17 billion.
Electrical Infrastructure, with USD 1.39 billion or 38% of 2025 value, because switchgear, UPS, generators and power distribution carry the largest line items in every Gulf hall.
Halls above 50 kW per rack, growing 25.78% a year from USD 659.54 million in 2025 to USD 6.53 billion in 2035, because AI clusters need liquid cooling and denser power.
16.75% a year, because MCIT targets more than 1,300 MW of capacity before 2030, the NCA cloud controls keep sovereign workloads in the Kingdom, and HUMAIN plans up to 1 GW of AI capacity with AMD and Cisco by 2030.
About 38% of 2025 electrical and cooling equipment value sits with Schneider Electric, Vertiv and Huawei Digital Power, DC Market Insights estimates; ABB, Eaton, Siemens, Johnson Controls and Trane follow.
By more than two times, because wider editions add servers, storage, DCIM software and North Africa. This edition counts only facility infrastructure and lifecycle upgrades: USD 3.66 billion in 2025.
USD 10.89 billion to USD 16.20 billion is the 2035 range. Delays to AI campuses or grid connections give the low case; Stargate UAE at 1 GW and the full HUMAIN pipeline give the high case.
USD 3.66 billion of 2025 facility hardware and works is counted here; data center infrastructure management (DCIM) software that monitors those assets is excluded and covered in its own Middle East edition.
Get this report
How do I get the full report?
Request a quote; we reply by email within one business day.
How and when will I receive the report?
By email, within 24–48 business hours of payment.
How can I pay?
Once you accept the quote, we email you a secure payment link.
Can I see a sample first?
Yes. Request a free sample and we will email it to you.
Can the report be tailored to my needs?
Yes. We can add countries, segments or data cuts. Talk to an analyst about the scope you need.
Can I get an invoice or pay against a purchase order?
Write to sales@dcmarketinsights.com and our team will help.