
Modular Data Center Market Size, Share & Forecast to 2035
Market at a glance
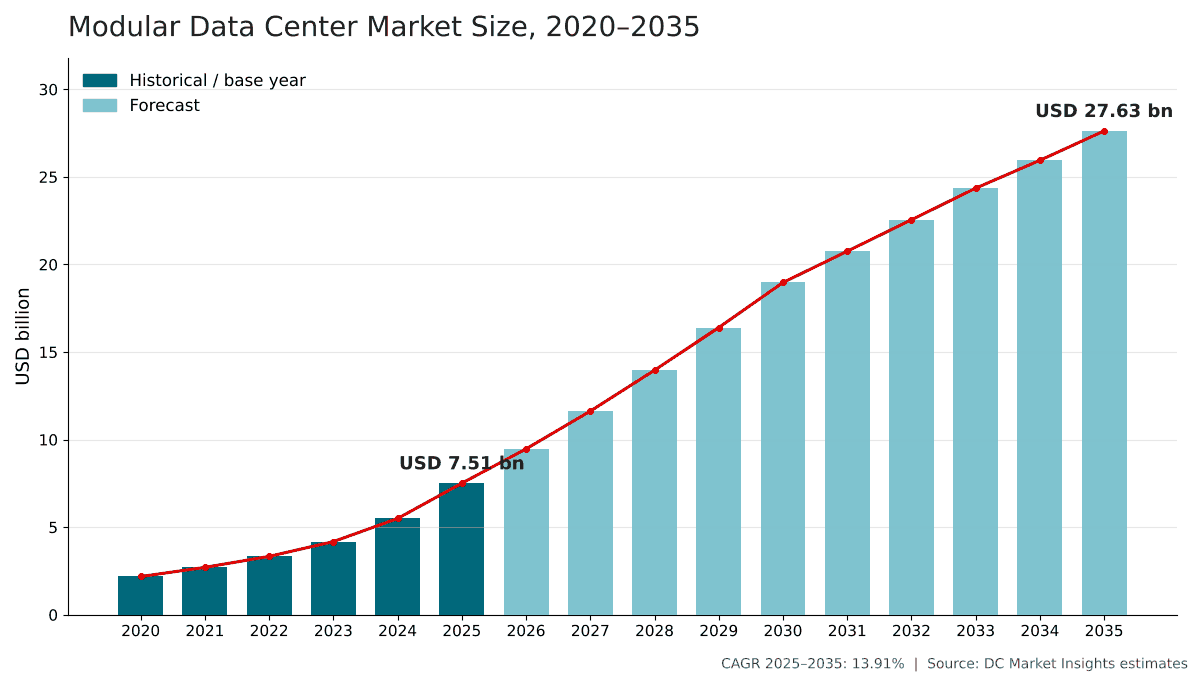
The Modular Data Center market was worth USD 7,510.0 million in 2025 and is forecast to reach USD 27.63 billion by 2035, growing at a 13.91% CAGR. North America accounts for 43.5% of the market.
 By Satyabrat Rajawat, Senior Research Analyst, Strategic Advisory
 Reviewed by Deepti Agrawal
Last updated 6 Oct 2026
Base year 2025 PDF + Excel
Reviewed by Deepti Agrawal
Last updated 6 Oct 2026
Base year 2025 PDF + Excel
Source: DC Market Insights analysis
Key findings
AI Racks Approaching 600 kW Lift Modular Content to USD 3.20 Million per MW
Electrical Majors Buy Prefabricated Power Capacity
Order Backlogs Stretch Factory Lead Times
Hyperscale and Cloud Providers Reach USD 10.66 billion by 2035
What is inside the report
- 01Introduction
- 02Research Methodology
- 03Executive Summary
- 04Market Dynamics
- 05Pricing and Cost Analysis
- 06Standards and Regulation
- 07Supply Chain and Value Chain Analysis
- 08Global Modular Data Center Market Size and Forecast
- 09Market by Component
- 10Market by Form Factor
- 20chapters
- 2020-2024Historical period
- 2026-2035Forecast period
- 11Companies profiled
Regional insights
- North America43.5%
- Asia Pacific26.4%
- Europe20.1%
- Middle East and Africa5.3%
- Latin America4.7%
Segmentation
Companies profiled
- Vertiv
- Schneider Electric
- Eaton (Fibrebond)
- Huawei
- ABB
- Delta Electronics
- Hewlett Packard Enterprise (HPE)
- Rittal
- Dell Technologies
- Flex (Anord Mardix)
- Efficiency IT
Recent developments
Schneider Electric agreed to acquire a 75% stake in liquid cooling company Motivair, in an all-cash deal reported at USD 850.00 million (Source: Data Center Dynamics news report).
HPE introduced the AI Mod POD modular data center, with each module supporting up to 1.5 MW and a PUE of under 1.1 (Source: Data Center Dynamics news report).
Eaton acquired Fibrebond, a designer and builder of pre-integrated modular power enclosures, for USD 1.43 billion net of cash acquired (Source: Eaton SEC filing).
Vertiv announced global availability of Vertiv OneCore, a factory-assembled prefabricated system that supports 5 to 50 MW in a single block (Source: Vertiv press release).
Schneider Electric and Compass Datacenters said their jointly engineered prefabricated EcoStruxure Pod could let operators begin revenue generation up to three months sooner (Source: Construction Dive news report).
Delta introduced a prefabricated AI modular data center at COMPUTEX 2026 that it says reduces deployment time by up to 60% (Source: Delta press release).
Full analysis
The Modular Data Center Market covers factory-built, prefabricated data center modules: IT modules and all-in-one enclosures, power modules such as skids, eHouses and power pods, cooling modules, and the design, integration and commissioning services sold with them. DC Market Insights values the global Modular Data Center Market at USD 7.51 billion in 2025 and forecasts USD 27.63 billion by 2035, a CAGR of 13.91%. The 2025 value is built from deployments: about 12.0 GW of new IT capacity, of which 16.0% was delivered with prefabricated modules at about USD 3.20 million of modular content per MW, gives USD 6.14 billion, and about 7,800 edge and small modular units at an average of about USD 175,000 add USD 1.37 billion. Deployments above 10 MW are the fastest-growing segment at 17.10% a year because AI campuses now order power and cooling as factory-tested blocks, and the Middle East and Africa is the fastest-growing region at 16.79% a year as sovereign AI programs build from a small base on tight schedules.
Executive Summary
The Global Modular Data Center Market size was valued at USD 2.18 billion in 2020, reached USD 7.51 billion in 2025, and is anticipated to reach USD 27.63 billion by 2035, at a CAGR of 13.91% during the forecast period.
| Report attribute | Details |
|---|---|
| Historical Period | 2020-2024 |
| Base Year | 2025 |
| Forecast Period | 2026-2035 |
| Modular Data Center Market Size 2025 | USD 7.51 Billion |
| Modular Data Center Market, CAGR | 13.91% |
| Modular Data Center Market Size 2035 | USD 27.63 Billion |
The market grew at 28.02% a year between 2020 and 2025, and 2025 alone added 36.7% over 2024 as graphics processing unit (GPU) clusters pushed operators to deliver power and cooling faster than site-built construction allows. DC Market Insights estimates that the modular share of new data center capacity rose from 8.5% in 2020 to 16.0% in 2025. Growth slows to 13.91% a year from 2025 to 2035 because the modular share rises more gently, to 26.0% by 2035, even as annual capacity additions more than double from 12.0 GW to 27.0 GW.
Market Scope: What Does the Modular Data Center Market Cover?
The Modular Data Center Market covers prefabricated modules that are designed, assembled and tested in a factory and shipped to a data center site, valued at first sale in current US dollars, with 2025 as the base year and forecasts to 2035. DC Market Insights sizes it at USD 7.51 billion in 2025.
Included. All-in-one and containerized IT modules with their racks, power distribution and cooling; prefabricated modular data halls built from factory-made sections; power modules such as power skids, eHouses and power pods with factory-integrated switchgear, UPS and distribution; cooling modules such as prefabricated chiller plants, coolant distribution skids and liquid cooling blocks; and the design, integration, commissioning and lifecycle services sold with the modules. The value of the equipment integrated in the factory is counted as part of the module.
Excluded. Servers, storage and network equipment installed in the modules after delivery, conventional site-built (stick-built) data halls, standalone equipment sold without a prefabricated enclosure or skid, land, shell buildings and utility grid connections, and on-site civil works.
How the segments fit together. The component, form factor, deployment size, end-user and vertical splits each re-cut the same USD 7.51 billion total. Large-scale deployments are counted in MW of IT capacity; edge and small modules below 1 MW are counted in units. Government and defense appears both as an end-user (by owner) and as a vertical, with slightly different values because a share of government demand is served through colocation operators.
Market Drivers: What Drives the Modular Data Center Market?
Three drivers explain most of the growth in the Modular Data Center Market: AI racks that draw hundreds of kilowatts, a modular share of new capacity rising from 16.0% to 26.0%, and schedule savings that vendors put at up to half of deployment time.
AI Racks Approaching 600 kW Lift Modular Content to USD 3.20 Million per MW
NVIDIA describes its GB200 NVL72 as a liquid-cooled, rack-scale system that combines 72 Blackwell GPUs and 36 Grace CPUs, and at GTC 2025 its chief executive said each Rubin Ultra NVL576 rack will draw 600 kW. NVIDIA has also said it is leading a transition to 800 VDC data center power infrastructure to support 1 MW IT racks and beyond, starting in 2027. Racks of this kind need liquid cooling loops, new power distribution and higher fault currents that are easier to engineer and test once in a factory than on every site. DC Market Insights estimates modular content at USD 3.20 million per MW of IT capacity in 2025, up from USD 2.60 million in 2020, and forecasts USD 3.54 million by 2035 as cooling modules take a larger share of each block.
Modular Share of New Capacity Rises from 16.0% to 26.0%
Demand for capacity sets the ceiling for the Modular Data Center Market. The International Energy Agency (IEA) estimates that data centres used around 415 TWh of electricity in 2024, about 1.5% of world consumption, and expects consumption to more than double to around 945 TWh by 2030 (Source: IEA Energy and AI report). BloombergNEF forecasts that US data center power demand could reach 106 GW in 2035, and Bloom Energy put US operating data center capacity at about 25 GW in 2024. DC Market Insights models new capacity rising from 12.0 GW in 2025 to 22.0 GW in 2030 and 27.0 GW in 2035, with the modular share of that capacity rising from 16.0% to 22.8% in 2030 and 26.0% in 2035.
Vendors Claim Prefabrication Cuts Deployment Time by Up to 50%
Speed to power is the main reason buyers pay a premium for factory work. Vertiv says its MegaMod CoolChip prefabricated solution can reduce the time to deploy AI critical digital infrastructure by up to 50%, and Delta says the prefabricated AI modular data center it showed at COMPUTEX 2026 reduces deployment time by up to 60%. Schneider Electric and Compass Datacenters said their jointly engineered EcoStruxure Pod could let operators begin generating revenue from new facilities up to three months sooner. These are vendor claims rather than independent measurements, but they explain why buyers accept a module price above the cost of the equipment inside it.
Market Trends: How Is Modular Data Center Supply Changing?
The Modular Data Center Market is shifting from containers for remote sites toward factory-built power and cooling blocks for AI campuses, with power modules already the largest component at 31.7% of 2025 value.
Electrical Majors Buy Prefabricated Power Capacity
Eaton acquired Fibrebond, a US designer and builder of pre-integrated modular power enclosures for data center, industrial, utility and communications customers, on April 1, 2025, for USD 1.43 billion net of cash acquired, according to its second-quarter 2026 results filing (Source: Eaton filing with the US Securities and Exchange Commission). Eaton’s first-quarter 2025 results filing reported Fibrebond sales of about USD 378.00 million for the twelve months ended February 28, 2025. Flex reports that its Anord Mardix unit offers prefabricated construction and modular power pods at data center facilities. Power modules are worth USD 2.38 billion in 2025 and USD 9.01 billion by 2035 in the DC Market Insights model.
Prefabricated Blocks Scale from Containers to 50 MW
Vertiv’s OneCore is a prefabricated solution that integrates power, thermal and IT infrastructure into a single factory-assembled system and supports 5 to 50 MW in a single block. Hewlett Packard Enterprise (HPE) offers its AI Mod POD, with each module supporting up to 1.5 MW and a power usage effectiveness (PUE) of under 1.1. Deployments above 10 MW are worth USD 2.88 billion in 2025 and reach USD 13.98 billion by 2035, rising from 38.4% to 50.6% of the market.
Liquid Cooling Moves Inside the Module
Suppliers are adding liquid cooling to their prefabricated lines through acquisitions. Schneider Electric agreed to buy a 75% stake in Motivair, a liquid cooling company, in a deal reported at USD 850.00 million. Vertiv completed its acquisition of PurgeRite, a provider of mechanical flushing, purging and filtration services for data centers and other mission-critical facilities, for about USD 1.00 billion, and Eaton acquired Boyd Thermal for USD 9.55 billion, according to Eaton’s results filing. Cooling modules are the fastest-growing component at 16.12% a year, rising from 21.3% of the market in 2025 to 25.8% in 2035.
Market Challenges: What Holds the Modular Data Center Market Back?
Factory capacity and the slow pace of change in existing facilities are the two constraints that DC Market Insights expects to cap the modular share of new capacity at 26.0% by 2035.
Order Backlogs Stretch Factory Lead Times
Prefabrication moves the bottleneck from the site to the factory. Eaton’s results filing reported year-over-year total backlog growth of 43% in its Electrical sector. When switchgear, transformers and UPS systems are on allocation, a module cannot ship faster than its slowest component, so part of the schedule benefit is lost. DC Market Insights assumes the modular share of new capacity rises by less than one point a year after 2030 for this reason.
Most Existing Facilities Still Run Below 30 kW per Rack
The Uptime Institute Global Data Center Survey 2025 found that average PUE levels have shown little change for the sixth consecutive year and that rack densities are rising slowly, driven by racks in the 10 kW to 30 kW range, with few facilities above 30 kW. Most of the installed base therefore has no immediate need for modular AI blocks, which is why enterprise spend on modular data centers grows only 9.45% a year, the slowest of the five end-user groups.
Market Opportunities: Where Are the New Revenue Pools?
The largest new revenue pools in the Modular Data Center Market are hyperscale AI campuses, which add USD 8.05 billion of annual spend by 2035, and telecom and edge operators growing at 15.01% a year.
Hyperscale and Cloud Providers Reach USD 10.66 billion by 2035
Hyperscale and cloud providers spent USD 2.61 billion on modular data center products and services in 2025, and DC Market Insights expects USD 10.66 billion in 2035, a CAGR of 15.10%. Rack-level design matters too: the OCP Rack Market report shows how open rack standards change power and cooling at the rack, the layer a prefabricated hall must serve.
Telecom and Edge Operators Grow at 15.01% a Year
Telecom and edge operators spent USD 968.80 million in 2025 and reach USD 3.92 billion by 2035. Edge and small modular units rise from about 7,800 in 2025 to 14,250 in 2035 in the DC Market Insights model, at an average price that edges up from about USD 175,000 to USD 197,000 as more units carry liquid cooling. The smallest and most mobile end of this segment is covered in the Micro-mobile Data Center Market report.
Efficiency Reporting Favors Factory-Tested Designs
The European Union now requires operators of data centres with an installed IT power demand of at least 500 kW to report energy and sustainability indicators to a European database every year. Modules that ship with measured efficiency data make that reporting simpler, which supports services and lifecycle contracts worth USD 1.40 billion in 2025 and USD 4.61 billion by 2035.
Pricing: How Much Does a Modular Data Center Cost per MW?
A prefabricated deployment carries about USD 3.20 million of modular content per MW of IT capacity in 2025, and an edge or small modular unit sells for about USD 175,000 on average. These are DC Market Insights estimates covering the module, the equipment integrated in the factory and the services sold with it, excluding IT equipment, land and site works.
| Modular pricing indicator | 2020 | 2025 | 2030 | 2035 |
|---|---|---|---|---|
| Modular content per MW (USD million) | 2.60 | 3.20 | 3.36 | 3.54 |
| Average edge or small unit price (USD thousand) | 165 | 175 | 186 | 197 |
| Modular share of new capacity | 8.5% | 16.0% | 22.8% | 26.0% |
Content per MW rose about 4.2% a year between 2020 and 2025 as liquid cooling and higher-rated power trains entered the modules, and DC Market Insights expects it to rise about 1.0% a year after 2025 as factory volumes grow and designs repeat.
Standards and Regulation: Which Rules Shape Modular Data Centers?
Five sets of rules decide how a modular data center is designed, certified and operated: UL 2755 for modular data centers, the TIA-942 infrastructure standard of the Telecommunications Industry Association (TIA), the ISO/IEC 22237 series, the Uptime Institute Tier Standard and the EU data centre reporting rules.
UL 2755. The UL 2755 Outline of Investigation covers modular data centers that are prefabricated units consisting of an outer enclosure housing IT equipment and support equipment such as electrical distribution and HVAC systems. It gives inspectors a single reference for a factory-built unit.
ANSI/TIA-942. The ANSI/TIA-942 Telecommunications Infrastructure Standard for Data Centers specifies minimum requirements for data centers and covers all physical infrastructure, including site location, architectural, electrical, mechanical, fire safety, telecommunication and security requirements.
ISO/IEC 22237. The international series on data centre facilities and infrastructures starts with ISO/IEC 22237-1:2021 on general concepts.
Uptime Institute Tier Standard. Under its TIER-Ready partnership with Uptime Institute, specific models of Vertiv’s prefabricated modular designs are reviewed during engineering against the Tier Standard of Topology, so that deployed units can more readily achieve Tier certification.
EU Delegated Regulation 2024/1364. Operators of data centres with at least 500 kW of installed IT power demand must report key performance indicators to the European database by 15 May each year, after a first report by 15 September 2024 (Source: Commission Delegated Regulation (EU) 2024/1364).
Market Segmentation: Which Segment Leads the Modular Data Center Market?
Power modules lead the Modular Data Center Market with 31.7% of 2025 value, prefabricated modular data halls lead form factors with 41.6%, and hyperscale and cloud providers lead buyers with 34.8%. Deployments above 10 MW are the fastest-growing segment at 17.10% a year, against 12.09% for 1 MW to 10 MW and 10.20% for up to 1 MW, because AI campuses order prefabricated power and cooling in blocks of tens of megawatts.
By Component: Power Modules Lead with 31.7%
| Component | 2025 (USD billion) | Share 2025 | 2035 (USD billion) | CAGR 2025-2035 |
|---|---|---|---|---|
| IT Modules | 2.13 | 28.4% | 6.88 | 12.42% |
| Power Modules | 2.38 | 31.7% | 9.01 | 14.23% |
| Cooling Modules | 1.60 | 21.3% | 7.13 | 16.12% |
| Services | 1.40 | 18.6% | 4.61 | 12.69% |
Power modules hold the largest share because switchgear, UPS and distribution are the most standardized parts of a data center and the easiest to build and test in a factory. Cooling modules gain 4.5 points of share by 2035 as liquid cooling becomes standard in AI halls, while IT modules lose share as large campuses buy power and cooling blocks for site-built halls.
By Form Factor: Prefabricated Modular Data Halls Lead with 41.6%
| Form factor | 2025 (USD billion) | Share 2025 | 2035 (USD billion) | CAGR 2025-2035 |
|---|---|---|---|---|
| ISO Containerized Modules | 1.85 | 24.6% | 4.95 | 10.35% |
| Skid-Mounted Modules | 2.54 | 33.8% | 9.50 | 14.11% |
| Prefabricated Modular Data Halls | 3.12 | 41.6% | 13.18 | 15.48% |
ISO containerized modules grow slowest at 10.35% a year because container dimensions limit the power and cooling a single unit can carry.
By Deployment Size: 1 MW to 10 MW Leads with 38.9%
| Deployment size | 2025 (USD billion) | Share 2025 | 2035 (USD billion) | CAGR 2025-2035 |
|---|---|---|---|---|
| Up to 1 MW | 1.71 | 22.7% | 4.50 | 10.20% |
| 1 MW to 10 MW | 2.92 | 38.9% | 9.15 | 12.09% |
| Above 10 MW | 2.88 | 38.4% | 13.98 | 17.10% |
Deployments above 10 MW reach 50.6% of the market by 2035, the largest size class by then.
By End-user: Hyperscale and Cloud Providers Lead with 34.8%
| End-user | 2025 (USD billion) | Share 2025 | 2035 (USD billion) | CAGR 2025-2035 |
|---|---|---|---|---|
| Hyperscale and Cloud Providers | 2.61 | 34.8% | 10.66 | 15.10% |
| Colocation Providers | 1.83 | 24.3% | 6.94 | 14.28% |
| Enterprises | 1.32 | 17.6% | 3.26 | 9.45% |
| Telecom and Edge Operators | 0.97 | 12.9% | 3.92 | 15.01% |
| Government and Defense | 0.78 | 10.4% | 2.85 | 13.80% |
Colocation providers use prefabricated power and cooling to deliver leased capacity in phases, and government and defense buyers value modules that can be deployed at secure or remote sites.
By Vertical: IT and Telecom Lead with 44.2%
IT and telecom operators account for USD 3.32 billion (44.2%) of 2025 demand and grow at 15.12% a year. BFSI follows with USD 1.02 billion (13.6%), then government and defense with 10.1%, energy and utilities with 9.1%, manufacturing with 8.4%, others with 8.3% and healthcare with 6.3%. Energy and utilities grow fastest outside IT and telecom at 14.61% a year.
DC Exclusive: The Modular Content per MW Model and Component × Buyer Matrix
At USD 1.01 billion in 2025, hyperscale power modules are the single largest cell of the matrix and 13.4% of all modular data center spending. The matrix below cross-tabulates what is bought and who buys it. It is a DC Market Insights model, not a shipment count: it is built from 103 inputs: 16 annual capacity cohorts (2020 to 2035), 16 modular-share rates, 16 content-per-MW values, 16 edge unit counts, 16 edge unit prices, 20 component weights (4 components for each of 5 buyer groups) and 3 supplier disclosures used as cross-checks.
| 2025, USD billion | IT Modules | Power Modules | Cooling Modules | Services | Total |
|---|---|---|---|---|---|
| Hyperscale and Cloud Providers | 0.49 | 1.01 | 0.72 | 0.39 | 2.61 |
| Colocation Providers | 0.42 | 0.65 | 0.43 | 0.33 | 1.83 |
| Enterprises | 0.49 | 0.33 | 0.21 | 0.29 | 1.32 |
| Telecom and Edge Operators | 0.43 | 0.21 | 0.13 | 0.20 | 0.97 |
| Government and Defense | 0.30 | 0.18 | 0.11 | 0.19 | 0.78 |
| Total | 2.13 | 2.38 | 1.60 | 1.40 | 7.51 |
Hyperscale and cloud providers spend 66% of their modular budget on power and cooling modules, while enterprises spend 37% on IT modules and telecom and edge operators 44%. A supplier strong only in containerized IT modules is therefore selling mostly into the slower-growing buyers, while power and cooling block makers are aligned with the fastest-growing ones.
The modular content per MW model behind these figures has two inputs that any reader can check: new capacity delivered each year (12.0 GW in 2025) and the share of it delivered with prefabricated modules (16.0% in 2025). Multiplying the modular MW by the content per MW and adding edge units gives the market. The model and its assumptions are explained on our research methodology page.
Regional Insights: Which Region Leads the Modular Data Center Market?
North America leads the Modular Data Center Market with 43.5% of 2025 value, and the Middle East and Africa is the fastest-growing region at 16.79% a year, because sovereign AI and national cloud programs there need capacity on schedules that site-built projects struggle to meet.
North America Leads with 43.5% Share
North American buyers spent USD 3.27 billion on modular data centers in 2025, and the region is forecast to reach USD 11.30 billion in 2035, a CAGR of 13.21%. Lawrence Berkeley National Laboratory reported that US data centers used about 176 TWh in 2023, about 4.4% of US electricity, and projected 6.7% to 12% by 2028. North America loses 2.6 points of share by 2035 as other regions catch up.
Asia Pacific Holds 26.4% Share
Asia Pacific is worth USD 1.98 billion in 2025 and USD 8.18 billion by 2035, a CAGR of 15.22%. China is the largest market in the region, and India and Malaysia grow fastest as hyperscale and colocation operators add capacity outside the established hubs. Asia Pacific gains 3.2 points of share, the largest gain of any region.
Europe Holds 20.1% Share
Europe is worth USD 1.51 billion in 2025 and USD 4.92 billion by 2035, a CAGR of 12.54%, the slowest of the five regions. The EU reporting rules for sites of 500 kW and above favor modules delivered with measured efficiency data.
Middle East and Africa Holds 5.3% Share
The Middle East and Africa is worth USD 398.04 million in 2025 and USD 1.88 billion by 2035, the fastest growth of any region at 16.79% a year. Saudi Arabia, worth USD 123.79 million in 2025, is the only country from the region in the top 12, and remote and high-temperature sites favor factory-tested power and cooling.
Latin America Holds 4.7% Share
Latin America is worth USD 352.97 million in 2025 and USD 1.35 billion by 2035, a CAGR of 14.39%, led by Brazil.
Country Analysis: Which Countries Buy the Most Modular Data Centers?
The United States is the largest country market for modular data centers at USD 2.89 billion in 2025, 38.5% of global value, followed by China at USD 777.21 million (10.3%) and Canada at USD 378.96 million (5.0%). The 12 largest countries account for 79.0% of 2025 spending.
| Rank | Country | Region | 2025 (USD billion) | Share 2025 | 2035 (USD billion) | CAGR 2025-2035 |
|---|---|---|---|---|---|---|
| 1 | United States | North America | 2.89 | 38.5% | 9.93 | 13.15% |
| 2 | China | Asia Pacific | 0.78 | 10.3% | 2.93 | 14.18% |
| 3 | Canada | North America | 0.38 | 5.0% | 1.37 | 13.69% |
| 4 | Germany | Europe | 0.32 | 4.3% | 1.03 | 12.27% |
| 5 | United Kingdom | Europe | 0.30 | 4.0% | 0.94 | 12.19% |
| 6 | India | Asia Pacific | 0.28 | 3.7% | 1.55 | 18.65% |
| 7 | Japan | Asia Pacific | 0.25 | 3.4% | 0.92 | 13.69% |
| 8 | France | Europe | 0.18 | 2.4% | 0.62 | 12.99% |
| 9 | Australia | Asia Pacific | 0.17 | 2.3% | 0.69 | 14.82% |
| 10 | Brazil | Latin America | 0.16 | 2.1% | 0.58 | 14.10% |
| 11 | Saudi Arabia | Middle East and Africa | 0.12 | 1.6% | 0.63 | 17.69% |
| 12 | Malaysia | Asia Pacific | 0.11 | 1.4% | 0.55 | 17.74% |
India is the fastest-growing large country market at 18.65% a year, ahead of Malaysia at 17.74% and Saudi Arabia at 17.69%. The country figures are a DC Market Insights allocation of the regional totals, weighted by each country’s estimated share of new data center capacity and of modular adoption.
Forecast Scenarios: How Could the 2035 Forecast Change?
The Modular Data Center Market reaches USD 27.63 billion by 2035 in the base case, with a range of USD 22.93 billion to USD 32.05 billion across the low and high scenarios.
| Scenario | Assumption from 2026 | 2035 (USD billion) | CAGR 2025-2035 |
|---|---|---|---|
| Low | Modular share of new capacity and edge unit volumes 17% below base by 2035 | 22.93 | 11.81% |
| Base | Additions rise to 27.0 GW a year; modular share reaches 26.0% | 27.63 | 13.91% |
| High | Modular share of new capacity and edge unit volumes 16% above base by 2035 | 32.05 | 15.61% |
The low case is what a pause in AI capital spending combined with persistent factory backlogs looks like: operators fall back on site-built designs they already know. The high case assumes 800 VDC power and liquid cooling standardize quickly, which favors factory-built blocks over custom site work.
Competitive Insights: Who Leads the Modular Data Center Market?
- Vertiv
- Schneider Electric
- Eaton (Fibrebond)
- Huawei
- ABB
- Delta Electronics
- Hewlett Packard Enterprise (HPE)
- Rittal
- Dell Technologies
- Flex (Anord Mardix)
- Secure I.T. Environments
- Efficiency IT
The Modular Data Center Market is fragmented: DC Market Insights estimates that the five largest suppliers, Vertiv, Schneider Electric, Eaton, Huawei and ABB, together hold about two-fifths of 2025 value. The basis is supplier disclosures set against the USD 7.51 billion market: Fibrebond alone reported sales of about USD 378.00 million in the twelve months to February 2025, equal to about 5.0% of the market, although part of those sales go to industrial, utility and communications customers. Vertiv competes with prefabricated systems such as OneCore and MegaMod CoolChip and has added rack and liquid cooling service capacity through the Great Lakes Data Racks & Cabinets purchase of about USD 200.00 million and the PurgeRite purchase. Schneider Electric offers its Prefabricated Modular EcoStruxure Pod Data Center and added liquid cooling through Motivair. Eaton owns Fibrebond, a builder of pre-integrated modular power enclosures, while Huawei, ABB, Delta and Rittal supply modular power, cooling and IT enclosures. HPE and Dell sell modular units alongside their servers, and Flex supplies modular power pods through Anord Mardix. Compass Datacenters, a developer and operator, co-engineered the prefabricated EcoStruxure Pod with Schneider Electric for its own campuses.
Recent Developments
- In October 2024, Schneider Electric agreed to acquire a 75% stake in liquid cooling company Motivair, in an all-cash deal reported at USD 850.00 million (Source: Data Center Dynamics news report).
- In March 2025, HPE introduced the AI Mod POD modular data center, with each module supporting up to 1.5 MW and a PUE of under 1.1 (Source: Data Center Dynamics news report).
- In April 2025, Eaton acquired Fibrebond, a designer and builder of pre-integrated modular power enclosures, for USD 1.43 billion net of cash acquired (Source: Eaton SEC filing).
- In August 2025, Vertiv announced global availability of Vertiv OneCore, a factory-assembled prefabricated system that supports 5 to 50 MW in a single block (Source: Vertiv press release).
- In September 2025, Schneider Electric and Compass Datacenters said their jointly engineered prefabricated EcoStruxure Pod could let operators begin revenue generation up to three months sooner (Source: Construction Dive news report).
- In June 2026, Delta introduced a prefabricated AI modular data center at COMPUTEX 2026 that it says reduces deployment time by up to 60% (Source: Delta press release).
We follow these deals, launches and capacity announcements as they happen in our data center industry updates.
Methodology: How We Built the Modular Data Center Market Model
DC Market Insights built this market bottom-up from 16 annual capacity cohorts (2020 to 2035). For each year, new IT capacity in GW was multiplied by the modular share of that capacity (8.5% in 2020, 16.0% in 2025 and 26.0% in 2035) and by modular content per MW (USD 2.60 million in 2020, USD 3.20 million in 2025 and USD 3.54 million in 2035). Edge and small modules were added as units times average price (7,800 units at about USD 175,000 each in 2025). The total was split by 4 components, 3 form factors, 3 deployment sizes, 5 end-user groups, 7 verticals and 5 regions, and every split sums to the market total. The result was checked top-down against Fibrebond’s disclosed sales, Vertiv’s prefabricated block sizes and HPE’s per-module rating, and against published electricity and capacity outlooks from the IEA, Lawrence Berkeley National Laboratory and BloombergNEF. The analyst named on this page built the model, and the reviewer checked the arithmetic, the sources and the dates before publication.
Table of contents
- 01Introduction
- 1.1Market Definition and Scope
- 1.2Components, Form Factors, Buyers and Regions Covered
- 1.3Currency, Base Year and Forecast Period
- 1.4Key Questions Answered
- 02Research Methodology
- 2.1Modular Content per MW Model
- 2.2Capacity Cohorts and Modular Share of New Capacity
- 2.3Edge and Small Modular Units Model
- 2.4Top-Down Check Against Supplier Disclosures
- 2.5Assumptions and Limitations
- 03Executive Summary
- 3.1Market at a Glance, 2020-2035
- 3.2Key Findings
- 3.3Analyst Recommendations by Buyer Type
- 04Market Dynamics
- 4.1Drivers
- 4.2Challenges and Restraints
- 4.3Opportunities
- 4.4Trends
- 4.5Impact Analysis of Drivers and Challenges, 2025-2035
- 05Pricing and Cost Analysis
- 5.1Modular Content per MW, 2020-2035
- 5.2Average Edge and Small Unit Price, 2020-2035
- 5.3Modular Share of New Capacity, 2020-2035
- 06Standards and Regulation
- 6.1UL 2755 Modular Data Centers
- 6.2ANSI/TIA-942
- 6.3ISO/IEC 22237 Series
- 6.4Uptime Institute Tier Standard and TIER-Ready Designs
- 6.5EU Delegated Regulation 2024/1364
- 07Supply Chain and Value Chain Analysis
- 7.1Power and Electrical Equipment Suppliers
- 7.2Cooling and Liquid Cooling Suppliers
- 7.3Module Fabrication and Integration
- 7.4Logistics, Installation and Commissioning
- 08Global Modular Data Center Market Size and Forecast
- 8.1Market Size, 2020-2024
- 8.2Market Size, 2025
- 8.3Market Forecast, 2026-2035
- 8.4Large-Scale Deployments vs Edge and Small Units
- 09Market by Component
- 9.1IT Modules
- 9.2Power Modules
- 9.3Cooling Modules
- 9.4Services
- 10Market by Form Factor
- 10.1ISO Containerized Modules
- 10.2Skid-Mounted Modules
- 10.3Prefabricated Modular Data Halls
- 11Market by Deployment Size
- 11.1Up to 1 MW
- 11.21 MW to 10 MW
- 11.3Above 10 MW
- 12Market by End-user
- 12.1Hyperscale and Cloud Providers
- 12.2Colocation Providers
- 12.3Enterprises
- 12.4Telecom and Edge Operators
- 12.5Government and Defense
- 13Market by Vertical
- 13.1IT and Telecom
- 13.2BFSI
- 13.3Government and Defense
- 13.4Energy and Utilities
- 13.5Healthcare
- 13.6Manufacturing
- 13.7Others
- 14DC Exclusive: Component × Buyer Matrix
- 14.1Component × End-user Matrix, 2025
- 14.2Implications for Suppliers
- 15Market by Region
- 15.1North America (United States, Canada)
- 15.2Europe (Germany, United Kingdom, France, Rest of Europe)
- 15.3Asia Pacific (China, India, Japan, Australia, Malaysia, Rest of Asia Pacific)
- 15.4Latin America (Brazil, Rest of Latin America)
- 15.5Middle East and Africa (Saudi Arabia, Rest of Middle East and Africa)
- 15.6Top 12 Countries, 2025 and 2035
- 16Regional Cross-Sections
- 16.1Region × Component, 2025 and 2035
- 16.2Region × End-user, 2025 and 2035
- 17Forecast Scenarios
- 17.1Base, Low and High Cases to 2035
- 17.2Sensitivity to Modular Share of New Capacity
- 17.3Sensitivity to Edge Unit Volumes
- 18Competitive Landscape
- 18.1Top-Five Supplier Concentration, 2025
- 18.2Mergers and Acquisitions, 2024-2026
- 18.3Product Launches
- 19Company Profiles
- 19.1Vertiv
- 19.2Schneider Electric
- 19.3Eaton (Fibrebond)
- 19.4Huawei
- 19.5ABB
- 19.6Delta Electronics
- 19.7Hewlett Packard Enterprise (HPE)
- 19.8Rittal
- 19.9Dell Technologies
- 19.10Flex (Anord Mardix)
- 19.11Secure I.T. Environments
- 19.12Efficiency IT
- 20Analyst Recommendations
- 20.1For Module and Equipment Suppliers
- 20.2For Hyperscale, Colocation and Edge Operators
- 20.3For Investors
- Fig. 1Modular Data Center Market Size, 2020-2035
- Fig. 2New Data Center Capacity and Modular Share, 2020-2035
- Fig. 3Modular Content per MW, 2020-2035
- Fig. 4Large-Scale vs Edge and Small Unit Spending, 2020-2035
- Fig. 5Market Share by Component, 2025 and 2035
- Fig. 6Market Share by Form Factor, 2025 and 2035
- Fig. 7Market Share by End-user, 2025 and 2035
- Fig. 8Component × End-user Matrix, 2025
- Fig. 9Market by Region, 2025 and 2035
- Fig. 10Top 12 Countries, 2025
- Fig. 11Forecast Scenarios, 2025-2035
- Table 1Report Attributes
- Table 2Modular Pricing Indicators, 2020-2035
- Table 3Market by Component, 2025 and 2035
- Table 4Market by Form Factor, 2025 and 2035
- Table 5Market by Deployment Size, 2025 and 2035
- Table 6Market by End-user, 2025 and 2035
- Table 7Market by Vertical, 2025 and 2035
- Table 8Component × End-user Matrix, 2025
- Table 9Market by Region, 2025 and 2035
- Table 10Top 12 Countries, 2025 and 2035
- Table 11Forecast Scenarios, 2035
- Table 12Mergers and Acquisitions, 2024-2026
- Table 13Company Profiles: Products and Data Center Focus
About this report
Written by Satyabrat Rajawat and reviewed by Deepti Agrawal, Senior Editor, Research. Figures are built top-down and bottom-up and reconciled before publication, with 2025 as the base year.
Read our methodologyHow we built this
- Historical period2020-2024
- Base year2025
- Forecast period2026-2035
- Sizing approachTop-down + bottom-up
Need more than the report?
Advisory on this market
Due diligence, site selection and market entry work, by the analysts who wrote this report.
See consulting servicesFrequently asked questions
USD 7.51 billion in 2025, rising to USD 27.63 billion by 2035. DC Market Insights estimates the market at USD 2.18 billion in 2020.
13.91% a year from 2025 to 2035. Growth was faster, at 28.02% a year, between 2020 and 2025 as AI clusters pushed operators toward factory-built power and cooling.
Power modules, with USD 2.38 billion or 31.7% of the market in 2025. Cooling modules are the fastest-growing component at 16.12% a year.
About USD 3.20 million of modular content per MW of IT capacity in 2025, according to DC Market Insights estimates covering the module, factory-integrated equipment and services, excluding IT equipment and site works.
North America, with USD 3.27 billion or 43.5% of 2025 value. The Middle East and Africa grows fastest at 16.79% a year.
About two-fifths of 2025 value is held by Vertiv, Schneider Electric, Eaton, Huawei and ABB together (DC Market Insights estimate). Delta Electronics, HPE, Rittal, Dell Technologies and Flex also compete.
Hyperscale and cloud providers, with USD 2.61 billion or 34.8% of 2025 demand. Telecom and edge operators grow at 15.01% a year.
USD 2.89 billion in the United States, or 38.5% of 2025 spending, followed by China at USD 777.21 million. India grows fastest among large country markets at 18.65% a year (DC Market Insights estimate).
Licences, delivery and payment
Which licence should I choose?
Single User is a view-only PDF for one person. Multi User adds a printable PDF and the Excel data for unlimited users at one location. Enterprise covers your whole company and includes 100 free analyst hours.
How and when will I receive the report?
By email, within 24–48 business hours of payment, in the formats of your licence.
How can I pay?
Securely through PayPal: with a PayPal account, a debit or credit card, or PayPal Pay Later where available. Prices are in US dollars.
Can I see a sample first?
Yes. Request a free sample and we will email it to you.
Can the report be tailored to my needs?
Yes. We can add countries, segments or data cuts. Talk to an analyst about the scope you need.
Can I get an invoice or pay against a purchase order?
Write to sales@dcmarketinsights.com and our team will help.