
Optical Transceiver Market Size, Share & Forecast to 2035
Market at a glance
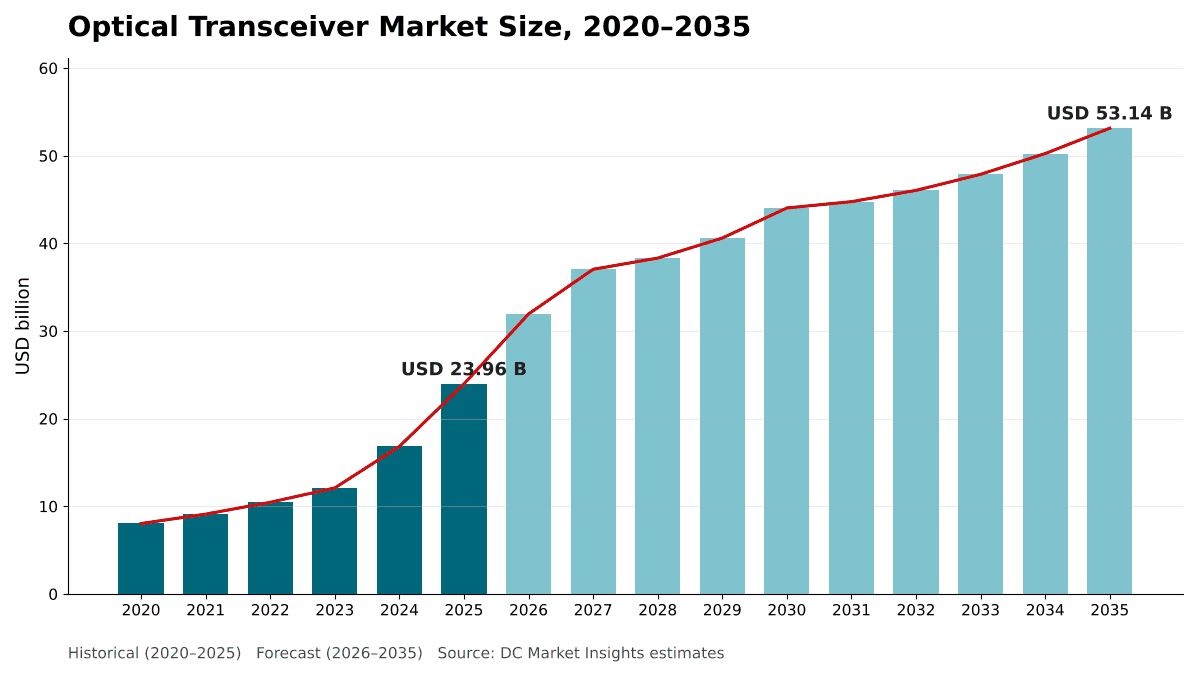
The Optical Transceiver market was worth USD 23.96 billion in 2025 and is forecast to reach USD 53.14 billion by 2035, growing at a 8.29% CAGR. North America accounts for 47.8% of the market.
 By Amit Jain, Senior Consultant, ICT & Emerging Technologies
 Reviewed by Deepti Agrawal
Last updated 6 Oct 2026
Base year 2025 PDF + Excel
Reviewed by Deepti Agrawal
Last updated 6 Oct 2026
Base year 2025 PDF + Excel
Source: DC Market Insights analysis
Key findings
AI Back-End Networks Take 41.6% of Transceiver Spend in 2025
Leading Suppliers Grew Revenue by 60.3% and 187% in 2025
Co-Packaged Optics Remove Pluggable Modules from the Largest Switches
GPU and Neocloud Providers Reach USD 11.25 Billion by 2035
What is inside the report
- 01Introduction
- 02Research Methodology
- 03Executive Summary
- 04Market Dynamics
- 05Pricing Analysis
- 06Standards and Regulation
- 07Supply Chain Analysis
- 08Market Size and Forecast
- 09Optical Transceiver Market, By Data Rate
- 10Optical Transceiver Market, By Form Factor
- 22chapters
- 2020-2024Historical period
- 2026-2035Forecast period
- 11Companies profiled
Regional insights
- North America47.8%
- Asia Pacific33.6%
- Europe11.2%
- Middle East and Africa3.9%
- Latin America3.5%
Segmentation
Companies profiled
- Zhongji InnoLight
- Eoptolink Technology
- Coherent
- Lumentum
- NVIDIA
- Cisco
- Accelink Technologies
- Applied Optoelectronics
- Source Photonics
- Ciena
- Broadcom
Recent developments
Broadcom announced that it is shipping Tomahawk 6-Davisson to early-access customers, a 102.4 Tbps co-packaged optics Ethernet switch with 200 Gbps per channel (Source: Broadcom press release).
Applied Optoelectronics received a first volume order of 1.6T data center transceivers worth more than USD 200 million from a major hyperscale customer, with shipments expected from early in the third quarter of 2026 (Source: Applied Optoelectronics press release).
Applied Optoelectronics received a further USD 71 million order for 800G single-mode data center transceivers from a major hyperscale customer (Source: Applied Optoelectronics press release).
Eoptolink filed for a Hong Kong listing seeking to raise up to USD 5 billion, after 2025 revenue rose 187% to CNY 24.84 billion (Source: The Next Web report).
Zhongji InnoLight priced its Hong Kong listing at HK$980 per share, raising HK$53.41 billion (USD 6.81 billion) in the base deal (Source: EqualOcean report).
Coherent reported fourth-quarter fiscal 2026 revenue of USD 2.05 billion, up 34% year on year, and guided first-quarter fiscal 2027 revenue of USD 2.2 billion to USD 2.4 billion (Source: Coherent SEC filing).
Full analysis
The Optical Transceiver Market covers the pluggable optical modules that convert electrical signals into light and back again on the switch, server, router and transport ports of data centers and telecom networks, from 10G and 25G small form-factor pluggable (SFP) modules to 800G and 1.6T octal small form-factor pluggable (OSFP) modules and coherent ZR and ZR+ pluggables. DC Market Insights values the global Optical Transceiver Market at USD 23.96 billion in 2025 and forecasts USD 53.14 billion by 2035, a CAGR of 8.29%. The 2025 value is built from units and prices: about 102.95 million modules shipped at a blended average selling price of about USD 232.72 per module, led by 18.47 million 800G modules at about USD 576.20 each. The 1.6T and above class is the fastest-growing segment at 30.88% a year because AI back-end networks move to 200G-per-lane signaling, and the Middle East and Africa is the fastest-growing region at 9.85% a year as DC Market Insights expects Gulf AI campuses to add GPU clusters from a small installed base.
Executive Summary
The Global Optical Transceiver Market size was valued at USD 8.04 billion in 2020, reached USD 23.96 billion in 2025, and is anticipated to reach USD 53.14 billion by 2035, at a CAGR of 8.29% during the forecast period.
| Report attribute | Details |
|---|---|
| Historical Period | 2020-2024 |
| Base Year | 2025 |
| Forecast Period | 2026-2035 |
| Optical Transceiver Market Size 2025 | USD 23.96 Billion |
| Optical Transceiver Market, CAGR | 8.29% |
| Optical Transceiver Market Size 2035 | USD 53.14 Billion |
DC Market Insights estimates that the Optical Transceiver Market grew at 24.40% a year between 2020 and 2025, and that 2025 alone added 42.3% over 2024, which the model attributes mainly to 800G modules for graphics processing unit (GPU) back-end fabrics. DC Market Insights expects another 33.3% rise in 2026, to USD 31.94 billion, as 1.6T modules enter volume production. Growth then slows to a forecast 8.29% a year over 2025 to 2035 for two reasons: the price of each module per gigabit falls by more than half over the decade, and DC Market Insights assumes that co-packaged optics (CPO) begin to replace pluggable modules on the largest AI switches from 2027.
Market Scope: What Does the Optical Transceiver Market Cover?
The Optical Transceiver Market covers pluggable optical modules sold to network equipment makers, cloud operators, GPU cloud providers, colocation operators, enterprises and telecom carriers, valued at first sale in current US dollars, with 2025 as the base year and forecasts to 2035. DC Market Insights sizes it at USD 23.96 billion in 2025.
Included. Intensity-modulated direct-detect (IM-DD) modules at every data rate from 10G to 1.6T and above, in SFP, quad small form-factor pluggable (QSFP28, QSFP56 and QSFP112), quad small form-factor pluggable double density (QSFP-DD), OSFP and CFP2 form factors; multimode short-reach, single-mode DR and FR (up to 2 km) and LR and ER (10 km and above) optics; linear pluggable optics (LPO); and coherent pluggable modules such as 400ZR, 800ZR and ZR+ for data center interconnect and metro networks.
Excluded. Active optical cables and direct-attach copper cables, which are covered in the Data Center Cables Market report; optical engines co-packaged inside switch or accelerator packages; stand-alone lasers, photodetectors and digital signal processor (DSP) chips sold as components; and line-card coherent transponders that are not pluggable.
How the segments fit together. The data-rate split and the reach split re-cut the same USD 23.96 billion: coherent modules appear once in each. Form factor, application and end user are further cuts of the same total, and every split sums to the market value.
Market Drivers: What Drives the Optical Transceiver Market?
AI back-end networks drive the Optical Transceiver Market, with 41.6% of 2025 value. DC Market Insights expects AI back-end spending to rise from USD 9.98 billion to USD 33.57 billion by 2035 as data center construction and GPU cluster sizes keep growing.
AI Back-End Networks Take 41.6% of Transceiver Spend in 2025
A GPU training cluster links every accelerator through a dedicated back-end network, and each link needs a module at both ends. DC Market Insights estimates that AI back-end networks accounted for USD 9.98 billion, or 41.6%, of the Optical Transceiver Market in 2025, and that 62% of all 800G module value went into these fabrics. The share rises to 63.2% by 2035, a CAGR of 12.90%, against 5.19% for the cloud front-end networks that link servers to users and storage. Lumentum said that “As AI compute workloads increase in both speed and bandwidth, data center architects are turning to optical links as a primary means of connectivity” in its fiscal 2026 results.
Data Center Capital Spending Rises Toward USD 750 Billion a Year
BloombergNEF counted more than 23 GW of data center capacity under construction worldwide at the end of September 2025, with 15.9 GW of it in the United States, and expects the capital expenditure of the 14 largest publicly owned data center operators to reach close to USD 750 billion in 2026, against a little less than USD 450 billion in 2025. Optical modules are a recurring line in that spending because every new GPU hall and every switch refresh needs a full set of optics. DC Market Insights models hyperscale cloud providers at USD 13.47 billion of transceiver demand in 2025, 56.2% of the market.
1.6T Modules Reach Cost Parity per Gigabit with 800G
DC Market Insights estimates the average 1.6T module at about USD 1,163 in 2025, or USD 0.73 per gigabit per second, almost equal to USD 0.72 for an 800G module. Once the cost per bit is equal, operators choose the faster module because it halves the number of ports, fibers and switch boxes. The IEEE P802.3dj project objectives include a 1.6 Tb/s Ethernet rate and optional single-lane 200 Gb/s interfaces, which set the electrical path for 1.6T modules. DC Market Insights forecasts the 1.6T and above class to grow from USD 2.88 billion in 2025 to USD 42.54 billion in 2035.
Market Trends: How Is the Optical Transceiver Market Changing?
The Optical Transceiver Market is changing in three ways: supplier revenue is rising faster than the market itself, single-mode optics up to 2 km are taking a larger share, and OSFP is becoming the main form factor for AI networks.
Leading Suppliers Grew Revenue by 60.3% and 187% in 2025
Zhongji InnoLight reported 2025 revenue of CNY 38.24 billion, about USD 5.6 billion, up 60.3%, and Eoptolink reported CNY 24.84 billion, about USD 3.67 billion, up 187%. Growth continued into 2026: InnoLight’s first-quarter revenue rose to RMB 19.50 billion from RMB 6.67 billion a year earlier, and Eoptolink’s first-quarter revenue rose to CNY 8.34 billion. Both companies make modules from 100G to 1.6T. In July 2026 InnoLight listed in Hong Kong, and Eoptolink filed for a Hong Kong listing.
Single-Mode Optics up to 2 km Rise to 77.2% of Value by 2035
Single-mode DR and FR modules reach up to 2 km, which covers the distance between racks and halls on a large AI campus. DC Market Insights values them at USD 13.87 billion (57.9%) in 2025 and forecasts USD 41.01 billion (77.2%) in 2035, a CAGR of 11.45%. Multimode short-reach modules hold USD 4.43 billion in 2025 and decline slightly to USD 4.16 billion by 2035, because DC Market Insights assumes that most 200G-per-lane links move to single-mode fiber rather than vertical-cavity surface-emitting laser (VCSEL) multimode optics.
OSFP Takes 72.0% of Module Value by 2035
The OSFP Multi-Source Agreement (MSA) defines a module with 8 electrical lanes that supports 400G (8x50G), 800G (8x100G) or 1.6T (8x200G), and its OSFP-XD variant uses 16 lanes for 3.2T. DC Market Insights estimates OSFP modules at USD 9.67 billion (40.3%) in 2025, rising to USD 38.28 billion (72.0%) in 2035, a CAGR of 14.76%. In the DC Market Insights model, QSFP-DD and QSFP112 modules remain the second family at USD 11.92 billion in 2035.
Market Challenges: What Holds the Optical Transceiver Market Back?
Co-packaged optics and falling prices per gigabit are the two constraints that hold the Optical Transceiver Market to an 8.29% CAGR after 2025, despite unit volumes that keep rising.
Co-Packaged Optics Remove Pluggable Modules from the Largest Switches
Co-packaged optics place the optical engines next to the switch chip, so the switch front panel takes fiber instead of pluggable modules. In October 2025, Broadcom announced that it is shipping Tomahawk 6-Davisson, a 102.4 Tbps Ethernet switch with 16 optical engines of 6.4 Tbps each, sampling it to early-access customers, and said it cuts optical interconnect power by 70%, more than 3.5 times lower than traditional pluggable solutions (Source: Broadcom press release). NVIDIA’s Spectrum-X Photonics switches, with 1.6 Tbps per port and up to 512 ports, were announced for 2026 shipment. DC Market Insights assumes that co-packaged optics take a growing share of AI scale-out switch ports from 2027, which is why the Optical Transceiver Market grows only 3.5% in 2028 in the base case.
Average Prices Fall 62% per 1.6T Module by 2035
In the DC Market Insights model, every module class follows the same price path: high at launch, then steep declines as volume grows. DC Market Insights models the average 1.6T module falling from USD 1,163 in 2025 to USD 441.30 in 2035, and the 800G module from USD 576.20 to USD 224.70. Older classes shrink: 200G and 400G modules fall from USD 4.28 billion in 2025 to USD 683.48 million in 2035, a decline of 16.76% a year, and 800G modules fall at 8.92% a year after peaking in 2027.
Telecom Demand Declines at 1.78% a Year
DC Market Insights estimates that telecom networks, including 5G fronthaul and backhaul and metro links, bought USD 3.52 billion of modules in 2025, mostly 10G and 25G SFP and 100G optics. DC Market Insights forecasts that demand to fall to USD 2.95 billion by 2035 because price erosion outpaces unit growth in these lower-speed classes.
Market Opportunities: Where Are the New Revenue Pools?
GPU and neocloud providers, growing at 13.03% a year, and coherent data center interconnect, growing at 5.93% a year, are the two largest new revenue pools in the Optical Transceiver Market.
GPU and Neocloud Providers Reach USD 11.25 Billion by 2035
DC Market Insights estimates that specialist GPU cloud operators bought USD 3.30 billion of optical modules in 2025, and DC Market Insights expects their spend to reach USD 11.25 billion in 2035, the fastest growth of any buyer. They build complete AI fabrics in leased halls, often at 800G and 1.6T. Single orders can be large: Applied Optoelectronics received a first volume order for 1.6T data center transceivers worth more than USD 200 million from a major hyperscale customer in March 2026.
Coherent Data Center Interconnect Grows to USD 3.47 Billion
Coherent ZR and ZR+ pluggables carry traffic between data center campuses over distances of tens to hundreds of kilometers. DC Market Insights values coherent modules at USD 2.59 billion in 2025 and USD 4.30 billion by 2035, and data center interconnect as a whole grows from USD 1.95 billion to USD 3.47 billion as DC Market Insights expects AI training to span multiple campuses.
Pricing: How Much Does an Optical Transceiver Cost?
An 800G optical transceiver cost about USD 576.20 on average in 2025 and a 1.6T module about USD 1,163, according to DC Market Insights estimates of blended selling prices across reach types and suppliers. The blended price of all modules shipped was about USD 232.72.
| Average selling price (USD per module) | 2020 | 2025 | 2030 | 2035 |
|---|---|---|---|---|
| Up to 100G | 105.00 | 53.80 | 39.00 | 31.30 |
| 200G and 400G | 900.00 | 306.40 | 168.00 | 121.40 |
| 800G | n/a | 576.20 | 312.00 | 224.70 |
| 1.6T and Above | n/a | 1,163.00 | 566.00 | 441.30 |
| Coherent | 1,900.00 | 1,487.00 | 1,030.00 | 772.60 |
In the DC Market Insights price curves, prices fall fastest in the first three years after launch. The 200G and 400G class fell from about USD 900 in 2020 to about USD 306.40 in 2025, a 66% decline. Coherent modules fall more slowly in the model because each one carries a coherent DSP and a tunable laser.
Standards and Regulation: Which Standards Shape Optical Transceivers?
Two sets of standards decide what an optical transceiver must do: the Ethernet physical-layer standards of the Institute of Electrical and Electronics Engineers (IEEE), and the multi-source agreements that fix the mechanical and electrical form of each module.
IEEE P802.3dj. The IEEE P802.3dj objectives include MAC data rates of 200 Gb/s, 400 Gb/s, 800 Gb/s and 1.6 Tb/s, optional single-lane 200 Gb/s attachment unit interfaces, and single-mode fiber reaches of at least 500 m and 2 km at 1.6 Tb/s, with a 10 km objective at 800 Gb/s. The 500 m and 2 km reaches match the DR and FR module types that make up most of the 1.6T class.
OSFP MSA. The OSFP specification defines 8-lane modules for 400G, 800G and 1.6T and a 16-lane OSFP-XD for 3.2T. Revision 5.22 was released on 14 August 2025.
Market Segmentation: Which Segment Leads the Optical Transceiver Market?
800G modules lead the Optical Transceiver Market with 44.4% of 2025 value, OSFP leads form factors with 40.3%, and AI back-end networks lead applications with 41.6%. The 1.6T and above class is the fastest-growing segment at 30.88% a year because AI back-end networks are moving from 100G-per-lane to 200G-per-lane signaling, which doubles the bandwidth of each module for about the same cost per gigabit.
By Data Rate: 800G Modules Lead with 44.4%
| Data rate | 2025 (USD billion) | Share 2025 | 2035 (USD billion) | CAGR 2025-2035 |
|---|---|---|---|---|
| Up to 100G | 3.57 | 14.9% | 1.43 | -8.73% |
| 200G and 400G | 4.28 | 17.9% | 0.68 | -16.76% |
| 800G | 10.64 | 44.4% | 4.18 | -8.92% |
| 1.6T and Above | 2.88 | 12.0% | 42.54 | 30.88% |
| Coherent | 2.59 | 10.8% | 4.30 | 5.22% |
The 1.6T and above class grows from 12.0% of value in 2025 to 80.1% in 2035, and includes 3.2T modules from the early 2030s. In the DC Market Insights model, up to 100G modules remain the largest class by units at about 66.3 million in 2025, but carry only 14.9% of value.
By Form Factor: OSFP Leads with 40.3%
| Form factor | 2025 (USD billion) | Share 2025 | 2035 (USD billion) | CAGR 2025-2035 |
|---|---|---|---|---|
| OSFP | 9.67 | 40.3% | 38.28 | 14.76% |
| QSFP-DD and QSFP112 | 8.94 | 37.3% | 11.92 | 2.92% |
| SFP Family | 2.21 | 9.2% | 1.00 | -7.62% |
| QSFP28 and QSFP56 | 1.95 | 8.2% | 0.47 | -13.28% |
| CFP2 and Others | 1.19 | 5.0% | 1.46 | 2.09% |
By Reach: Single-Mode up to 2 km Leads with 57.9%
| Reach and fiber type | 2025 (USD billion) | Share 2025 | 2035 (USD billion) | CAGR 2025-2035 |
|---|---|---|---|---|
| Single-Mode up to 2 km | 13.87 | 57.9% | 41.01 | 11.45% |
| Multimode Short Reach | 4.43 | 18.5% | 4.16 | -0.63% |
| Single-Mode 10 km and Above | 3.07 | 12.8% | 3.67 | 1.79% |
| Coherent ZR and ZR+ | 2.59 | 10.8% | 4.30 | 5.22% |
By Application: AI Back-End Networks Lead with 41.6%
| Application | 2025 (USD billion) | Share 2025 | 2035 (USD billion) | CAGR 2025-2035 |
|---|---|---|---|---|
| AI Back-End Networks | 9.98 | 41.6% | 33.57 | 12.90% |
| Cloud Front-End Networks | 7.43 | 31.0% | 12.32 | 5.19% |
| Telecom (5G and Metro) | 3.52 | 14.7% | 2.95 | -1.78% |
| Data Center Interconnect | 1.95 | 8.1% | 3.47 | 5.93% |
| Enterprise and Other | 1.08 | 4.5% | 0.83 | -2.56% |
Cloud front-end networks are the second-largest application at USD 7.43 billion. Telecom and enterprise demand shrink in value through 2035, while data center interconnect grows at 5.93% a year.
By End User: Hyperscale Cloud Providers Lead with 56.2%
| End user | 2025 (USD billion) | Share 2025 | 2035 (USD billion) | CAGR 2025-2035 |
|---|---|---|---|---|
| Hyperscale Cloud Providers | 13.47 | 56.2% | 33.44 | 9.52% |
| Telecom Operators | 3.99 | 16.7% | 3.48 | -1.38% |
| GPU and Neocloud Providers | 3.30 | 13.8% | 11.25 | 13.03% |
| Colocation and Enterprise | 3.19 | 13.3% | 4.98 | 4.57% |
Hyperscale cloud providers gain 6.7 points of share by 2035. Telecom operators lose the most share, from 16.7% to 6.5%, because their purchases are concentrated in the slowest-growing data rates.
DC Exclusive: The Data Rate × Application Matrix
At USD 6.60 billion in 2025, 800G modules for AI back-end networks are the single largest cell of the matrix and 27.5% of all optical transceiver spending. The matrix cross-tabulates the two splits that buyers and suppliers ask about most: which speed is bought, and which network it goes into.
| 2025, USD billion | AI Back-End Networks | Cloud Front-End Networks | Data Center Interconnect | Telecom (5G and Metro) | Enterprise and Other | Total |
|---|---|---|---|---|---|---|
| Up to 100G | 0.07 | 1.00 | 0.11 | 1.68 | 0.71 | 3.57 |
| 200G and 400G | 0.94 | 2.35 | 0.26 | 0.51 | 0.21 | 4.28 |
| 800G | 6.60 | 3.62 | 0.21 | 0.13 | 0.09 | 10.64 |
| 1.6T and Above | 2.37 | 0.46 | 0.03 | 0.02 | 0.01 | 2.88 |
| Coherent | 0.00 | 0.00 | 1.35 | 1.19 | 0.05 | 2.59 |
| Total | 9.98 | 7.43 | 1.95 | 3.52 | 1.08 | 23.96 |
Coherent modules have no AI back-end or front-end value, so suppliers without coherent products have no exposure to data center interconnect. Up to 100G modules still earn USD 1.68 billion in telecom, the largest telecom cell, which is why suppliers with large 5G portfolios grow slower than the market. The 1.6T row is still small in 2025 at USD 2.88 billion, but 82% of it is AI back-end demand. The matrix is a DC Market Insights model, not a shipment count: it is built from 271 inputs: 100 unit and price anchors (5 data-rate classes, 10 anchor years, units and price), 134 mix shares for form factor, reach, application and end user in 2025 and 2035, 10 regional shares, 24 country shares and 3 supplier disclosures used as a cross-check. The model and its assumptions are explained on our research methodology page.
Regional Insights: Which Region Leads the Optical Transceiver Market?
North America leads the Optical Transceiver Market with 47.8% of 2025 value. The Middle East and Africa is the fastest-growing region at 9.85% a year, because DC Market Insights expects Gulf AI campuses to add GPU clusters from a small installed base.
North America Leads with 47.8% Share
DC Market Insights estimates that North American buyers spent USD 11.45 billion on optical modules in 2025, and DC Market Insights forecasts USD 24.66 billion in 2035, a CAGR of 7.97%. The United States held 15.9 GW of the more than 23 GW of data center capacity under construction worldwide at the end of September 2025, according to BloombergNEF.
Asia Pacific Holds 33.6% Share
Asia Pacific is worth USD 8.05 billion in 2025 and USD 18.33 billion by 2035, a CAGR of 8.58%. China is the largest Asian buyer in the DC Market Insights allocation, and India grows fastest in the region at 13.64% a year.
Europe Holds 11.2% Share
Europe is worth USD 2.68 billion in 2025 and USD 5.79 billion by 2035, a CAGR of 8.00%. DC Market Insights assumes slower AI hall additions in Europe than in North America, so a larger part of European demand comes from cloud front-end upgrades and telecom networks.
Middle East and Africa Holds 3.9% Share
The Middle East and Africa is worth USD 934.37 million in 2025 and USD 2.39 billion by 2035, the fastest regional growth at 9.85% a year, on the DC Market Insights assumption that Gulf AI campuses keep adding GPU clusters.
Latin America Holds 3.5% Share
Latin America is worth USD 838.54 million in 2025 and USD 1.97 billion by 2035, a CAGR of 8.90%, led by Brazil at USD 383.33 million.
Country Analysis: Which Countries Buy the Most Optical Transceivers?
The United States buys the most optical transceivers, with 44.9% of 2025 value. DC Market Insights estimates the United States market at USD 10.76 billion in 2025, followed by China at USD 4.41 billion (18.4%) and Japan at USD 862.50 million (3.6%). The 12 largest countries account for 84.8% of 2025 spending.
| Rank | Country | Region | 2025 (USD billion) | Share 2025 | 2035 (USD billion) | CAGR 2025-2035 |
|---|---|---|---|---|---|---|
| 1 | United States | North America | 10.76 | 44.9% | 23.01 | 7.90% |
| 2 | China | Asia Pacific | 4.41 | 18.4% | 9.35 | 7.81% |
| 3 | Japan | Asia Pacific | 0.86 | 3.6% | 1.75 | 7.35% |
| 4 | Canada | North America | 0.69 | 2.9% | 1.65 | 9.02% |
| 5 | United Kingdom | Europe | 0.62 | 2.6% | 1.28 | 7.43% |
| 6 | Germany | Europe | 0.58 | 2.4% | 1.22 | 7.79% |
| 7 | India | Asia Pacific | 0.50 | 2.1% | 1.81 | 13.64% |
| 8 | South Korea | Asia Pacific | 0.48 | 2.0% | 1.06 | 8.29% |
| 9 | Brazil | Latin America | 0.38 | 1.6% | 0.90 | 8.95% |
| 10 | Australia | Asia Pacific | 0.36 | 1.5% | 0.91 | 9.78% |
| 11 | France | Europe | 0.35 | 1.5% | 0.80 | 8.66% |
| 12 | Singapore | Asia Pacific | 0.32 | 1.4% | 0.74 | 8.69% |
India is the fastest-growing large country market at 13.64% a year, ahead of Australia at 9.78%. The country figures are a DC Market Insights allocation of the regional totals, weighted by each country’s estimated share of AI, cloud and telecom network capacity.
Forecast Scenarios: How Could the 2035 Forecast Change?
The Optical Transceiver Market reaches USD 53.14 billion by 2035 in the base case, with a range of USD 43.04 billion to USD 63.23 billion across the low and high scenarios.
| Scenario | Assumption from 2026 | 2035 (USD billion) | CAGR 2025-2035 |
|---|---|---|---|
| Low | Co-packaged optics take most AI scale-out ports by 2030; 1.6T and above units about 19% below base | 43.04 | 6.03% |
| Base | 1.6T and above units reach about 96.4 million in 2035; prices fall in line with past generations | 53.14 | 8.29% |
| High | Pluggables keep most switch ports; AI cluster build-out runs about 19% above base | 63.23 | 10.19% |
The low case is what fast co-packaged optics adoption or a pause in AI capital spending looks like. The high case assumes that linear pluggable optics keep pluggable modules competitive on power and that hyperscale capital spending keeps rising after 2027.
Competitive Insights: Who Leads the Optical Transceiver Market?
- Zhongji InnoLight
- Eoptolink Technology
- Coherent
- Lumentum
- NVIDIA
- Cisco
- Accelink Technologies
- Applied Optoelectronics
- Source Photonics
- Ciena
- Broadcom
Zhongji InnoLight is the market leader with up to about 23% of the Optical Transceiver Market in 2025, and InnoLight and Eoptolink together hold up to about 38.7% (DC Market Insights estimate: their reported 2025 revenue of about USD 5.6 billion and USD 3.67 billion set against the USD 23.96 billion market, treating all reported revenue as module sales, so these are upper bounds). InnoLight itself reports a 21.2% global share of the broader optical interconnect solutions market in 2025 and says it has ranked first by revenue since 2021. Coherent reported fiscal 2026 revenue of USD 7.12 billion, of which its Datacenter and Communications segment contributed USD 5.27 billion, and fourth-quarter revenue of USD 2.05 billion, up 34% (Source: Coherent filing with the US Securities and Exchange Commission). Lumentum reported fiscal 2026 net revenue of USD 3.01 billion and said its cloud module business is advancing 1.6T adoption. Applied Optoelectronics plans combined monthly output above 500,000 units of 800G and 1.6T transceivers by the end of 2026. Cisco offers 800G OSFP modules, Ciena offers coherent pluggables, and Accelink and Source Photonics have shown or released 1.6T modules. Broadcom and NVIDIA compete from a different direction, with co-packaged optics switches that replace pluggable modules on switch ports.
Recent Developments
- In October 2025, Broadcom announced that it is shipping Tomahawk 6-Davisson to early-access customers, a 102.4 Tbps co-packaged optics Ethernet switch with 200 Gbps per channel (Source: Broadcom press release).
- In March 2026, Applied Optoelectronics received a first volume order of 1.6T data center transceivers worth more than USD 200 million from a major hyperscale customer, with shipments expected from early in the third quarter of 2026 (Source: Applied Optoelectronics press release).
- In April 2026, Applied Optoelectronics received a further USD 71 million order for 800G single-mode data center transceivers from a major hyperscale customer (Source: Applied Optoelectronics press release).
- In July 2026, Eoptolink filed for a Hong Kong listing seeking to raise up to USD 5 billion, after 2025 revenue rose 187% to CNY 24.84 billion (Source: The Next Web report).
- In July 2026, Zhongji InnoLight priced its Hong Kong listing at HK$980 per share, raising HK$53.41 billion (USD 6.81 billion) in the base deal (Source: EqualOcean report).
- In August 2026, Coherent reported fourth-quarter fiscal 2026 revenue of USD 2.05 billion, up 34% year on year, and guided first-quarter fiscal 2027 revenue of USD 2.2 billion to USD 2.4 billion (Source: Coherent SEC filing).
We follow these orders, listings and product launches as they happen in our data center industry updates. Optical modules increasingly use silicon photonic chips, which the Silicon Photonics Market report sizes at USD 4.70 billion of transceiver value in 2025, about a fifth of this market.
Methodology: How We Built the Optical Transceiver Market Model
DC Market Insights built the Optical Transceiver Market bottom-up from 5 data-rate classes (up to 100G, 200G and 400G, 800G, 1.6T and above, and coherent), each with unit shipments and an average selling price at 10 anchor years between 2020 and 2035, interpolated for the years in between. In 2025 the model counts 102.95 million modules at a blended USD 232.72, which gives USD 23.96 billion. The total was split by 4 form-factor groups plus coherent CFP2 and others, 4 reach types, 5 applications, 4 end users, 5 regions and 12 countries, and every split sums to the market total. The result was checked top-down against the disclosed revenue of 3 listed suppliers: the 2025 revenue of Zhongji InnoLight and Eoptolink, about USD 9.27 billion together, and the Datacenter and Communications segment of Coherent, USD 5.27 billion in fiscal 2026. The analyst named on this page built the model, and the reviewer checked the arithmetic, the sources and the dates before publication.
Table of contents
- 01Introduction
- 1.1Market Definition and Scope
- 1.2Data Rate, Form Factor and Reach Definitions
- 1.3Currency, Pricing and Base Year
- 02Research Methodology
- 2.1Bottom-Up Units and Price Model
- 2.2Top-Down Supplier Revenue Checks
- 2.3Data Sources and Fact Verification
- 2.4Forecast Assumptions
- 03Executive Summary
- 3.1Optical Transceiver Market Size, 2020-2035
- 3.2Key Findings
- 3.3Analyst Viewpoint
- 04Market Dynamics
- 4.1Market Drivers
- 4.2Market Trends
- 4.3Market Challenges
- 4.4Market Opportunities
- 05Pricing Analysis
- 5.1Average Selling Price by Data Rate, 2020-2035
- 5.2Price per Gigabit by Data Rate
- 5.3Price Decline Curves after Launch
- 06Standards and Regulation
- 6.1IEEE P802.3dj and 200G-per-Lane Ethernet
- 6.2OSFP Multi-Source Agreement
- 6.3Implications for Module Design
- 07Supply Chain Analysis
- 7.1Lasers, Photodetectors and DSP Chips
- 7.2Module Assembly and Test
- 7.3Co-Packaged Optics and Pluggable Substitution
- 08Market Size and Forecast
- 8.1Market Value, 2020-2035
- 8.2Unit Shipments, 2020, 2025, 2030 and 2035
- 8.3Year-on-Year Growth
- 09Optical Transceiver Market, By Data Rate
- 9.1Up to 100G
- 9.2200G and 400G
- 9.3800G
- 9.41.6T and Above
- 9.5Coherent
- 10Optical Transceiver Market, By Form Factor
- 10.1SFP Family
- 10.2QSFP28 and QSFP56
- 10.3QSFP-DD and QSFP112
- 10.4OSFP
- 10.5CFP2 and Others
- 11Optical Transceiver Market, By Reach
- 11.1Multimode Short Reach
- 11.2Single-Mode up to 2 km
- 11.3Single-Mode 10 km and Above
- 11.4Coherent ZR and ZR+
- 12Optical Transceiver Market, By Application
- 12.1AI Back-End Networks
- 12.2Cloud Front-End Networks
- 12.3Data Center Interconnect
- 12.4Telecom (5G and Metro)
- 12.5Enterprise and Other
- 13Optical Transceiver Market, By End User
- 13.1Hyperscale Cloud Providers
- 13.2GPU and Neocloud Providers
- 13.3Colocation and Enterprise
- 13.4Telecom Operators
- 14DC Exclusive: Data Rate × Application Matrix
- 14.1Cell Values, 2025
- 14.2Model Inputs and Cross-Checks
- 15Optical Transceiver Market, By Region
- 15.1North America (United States, Canada)
- 15.2Asia Pacific (China, Japan, India, South Korea, Australia, Singapore)
- 15.3Europe (United Kingdom, Germany, France)
- 15.4Latin America (Brazil)
- 15.5Middle East and Africa
- 16Country Analysis
- 16.1Top 12 Countries, 2025 and 2035
- 16.2Fastest-Growing Countries
- 17Regional Cross-Sections
- 17.1Regional Shares, 2025 and 2035
- 17.2Regional Growth Comparison, 2025-2035
- 18Forecast Scenarios
- 18.1Low Scenario
- 18.2Base Scenario
- 18.3High Scenario
- 19Competitive Landscape
- 19.1Market Concentration, 2025
- 19.2Supplier Revenue Benchmarks
- 19.3Pluggable versus Co-Packaged Optics Competition
- 20Company Profiles
- 20.1Zhongji InnoLight
- 20.2Eoptolink Technology
- 20.3Coherent
- 20.4Lumentum
- 20.5NVIDIA
- 20.6Cisco
- 20.7Accelink Technologies
- 20.8Applied Optoelectronics
- 20.9Source Photonics
- 20.10Ciena
- 20.11Broadcom
- 21Recent Developments
- 21.1Orders and Capacity Expansions
- 21.2Listings and Financing
- 21.3Product Launches
- 22Analyst Recommendations
- 22.1For Module Suppliers
- 22.2For Hyperscale and GPU Cloud Buyers
- 22.3For Investors
- Fig. 1Optical Transceiver Market Size, 2020-2035
- Fig. 2Optical Transceiver Market by Data Rate, 2025 and 2035
- Fig. 3Optical Transceiver Market by Form Factor, 2025 and 2035
- Fig. 4Optical Transceiver Market by Application, 2025 and 2035
- Fig. 5Optical Transceiver Market by Region, 2025 and 2035
- Fig. 6Average Selling Price by Data Rate, 2020-2035
- Fig. 7Forecast Scenarios, 2035
- Table 1Report Attributes
- Table 2Average Selling Price by Data Rate, 2020, 2025, 2030 and 2035
- Table 3Market by Data Rate, 2025 and 2035
- Table 4Market by Form Factor, 2025 and 2035
- Table 5Market by Reach, 2025 and 2035
- Table 6Market by Application, 2025 and 2035
- Table 7Market by End User, 2025 and 2035
- Table 8Data Rate × Application Matrix, 2025
- Table 9Market by Region, 2025 and 2035
- Table 10Top 12 Countries, 2025 and 2035
- Table 11Forecast Scenarios, 2035
About this report
Written by Amit Jain and reviewed by Deepti Agrawal, Senior Editor, Research. Figures are built top-down and bottom-up and reconciled before publication, with 2025 as the base year.
Read our methodologyHow we built this
- Historical period2020-2024
- Base year2025
- Forecast period2026-2035
- Sizing approachTop-down + bottom-up
Need more than the report?
Advisory on this market
Due diligence, site selection and market entry work, by the analysts who wrote this report.
See consulting servicesFrequently asked questions
USD 23.96 billion in 2025, rising to USD 53.14 billion by 2035. DC Market Insights estimates the market at USD 8.04 billion in 2020.
8.29% a year from 2025 to 2035. Growth was faster, at 24.40% a year, between 2020 and 2025, according to DC Market Insights estimates.
800G modules, with USD 10.64 billion or 44.4% of the market in 2025. The 1.6T and above class grows fastest at 30.88% a year, reaching USD 42.54 billion by 2035.
About USD 576.20 for an 800G module and USD 1,163 for a 1.6T module in 2025, according to DC Market Insights estimates of blended selling prices. Both work out to about USD 0.73 per gigabit or less.
North America, with USD 11.45 billion or 47.8% of 2025 value. The Middle East and Africa grows fastest at 9.85% a year.
Zhongji InnoLight leads with up to about 23% of the market, and InnoLight and Eoptolink together hold up to about 38.7% (DC Market Insights estimate). Coherent, Lumentum, NVIDIA, Cisco, Accelink, Applied Optoelectronics, Source Photonics and Ciena also compete.
AI back-end networks, with USD 9.98 billion or 41.6% of 2025 spending, rising to USD 33.57 billion by 2035. Cloud front-end networks follow at USD 7.43 billion.
70% lower optical interconnect power is what Broadcom reports for its Tomahawk 6-Davisson co-packaged optics switch. DC Market Insights expects co-packaged optics to take a growing share of AI switch ports from 2027, slowing market growth to 3.5% in 2028.
Licences, delivery and payment
Which licence should I choose?
Single User is a view-only PDF for one person. Multi User adds a printable PDF and the Excel data for unlimited users at one location. Enterprise covers your whole company and includes 100 free analyst hours.
How and when will I receive the report?
By email, within 24–48 business hours of payment, in the formats of your licence.
How can I pay?
Securely through PayPal: with a PayPal account, a debit or credit card, or PayPal Pay Later where available. Prices are in US dollars.
Can I see a sample first?
Yes. Request a free sample and we will email it to you.
Can the report be tailored to my needs?
Yes. We can add countries, segments or data cuts. Talk to an analyst about the scope you need.
Can I get an invoice or pay against a purchase order?
Write to sales@dcmarketinsights.com and our team will help.