
AI-Powered Storage Market Size, Share & Forecast to 2035
Market at a glance
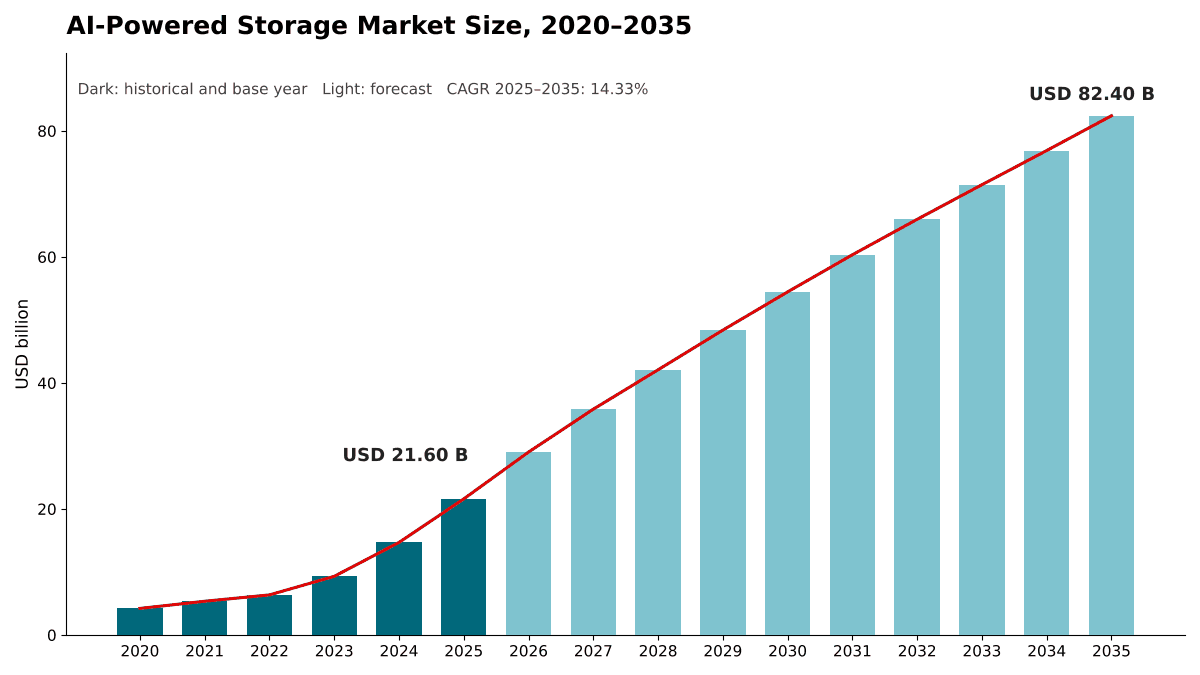
The AI-Powered Storage market was worth USD 21.60 billion in 2025 and is forecast to reach USD 82.40 billion by 2035, growing at a 14.33% CAGR. North America accounts for 46.8% of the market.
 By Amit Jain, Senior Consultant, ICT & Emerging Technologies
 Reviewed by Deepti Agrawal
Last updated 7 Oct 2026
Base year 2025 PDF + Excel
Reviewed by Deepti Agrawal
Last updated 7 Oct 2026
Base year 2025 PDF + Excel
Source: DC Market Insights analysis
Key findings
USD 248.30 Billion of AI Compute Spend Pulled USD 21.60 Billion of Storage in 2025
High-Capacity QLC Flash Grows from 21.3% to 37.6% of Spend
Western Digital Hard Drive Output Is Sold Out for 2026
GPU and Neocloud Providers Reach USD 14.50 Billion by 2035
What is inside the report
- 01Introduction
- 02Research Methodology
- 03Executive Summary
- 04Market Dynamics
- 05Pricing and Cost Analysis
- 06Standards and Regulation
- 07Supply Chain and Value Chain Analysis
- 08Global AI-Powered Storage Market Size and Forecast
- 09Market by Component
- 10Market by Storage Architecture
- 20chapters
- 2020-2024Historical period
- 2026-2035Forecast period
- 16Companies profiled
Regional insights
- North America46.8%
- Asia Pacific26.4%
- Europe17.9%
- Latin America4.3%
- Middle East and Africa4.6%
Segmentation
Companies profiled
- Dell Technologies
- NetApp
- Everpure (formerly Pure Storage)
- Hewlett Packard Enterprise (HPE)
- IBM
- DDN
- VAST Data
- WEKA
- Hitachi Vantara
- Nutanix
- Cloudian
- Cohesity
- Hammerspace
- Seagate Technology
- Western Digital
- Sandisk
Recent developments
Blackstone invested USD 300 million in DDN, valuing the company at USD 5 billion (Source: Blocks and Files news report).
Hammerspace announced USD 100 million of funding at a valuation of over USD 500 million, with backers including Altimeter Capital and ARK Invest (Source: TechCrunch news report).
NetApp introduced AFX, a disaggregated all-flash storage system for AI workloads, and the NetApp AI Data Engine at NetApp INSIGHT 2025 (Source: NetApp press release).
VAST Data signed a commercial agreement valued at USD 1.17 billion with CoreWeave (Source: VAST Data press release).
Pure Storage announced it was changing its name to Everpure and agreed to acquire 1touch, a data intelligence and orchestration company (Source: World Wide Technology news report).
VAST Data closed a Series F round of about USD 1 billion at a valuation of USD 30 billion, led by Drive Capital (Source: ChannelLife news report).
Full analysis
The AI-Powered Storage Market covers the storage hardware, data platform software and services that data centers deploy to feed, protect and serve artificial intelligence (AI) workloads: parallel and scale-out file systems, object stores, NVMe all-flash and high-capacity drives, and the AI-driven data management layers that sit on top of them. DC Market Insights values the global AI-Powered Storage Market at USD 21.60 billion in 2025 and forecasts USD 82.40 billion by 2035, a CAGR of 14.33%. The 2025 value is built from compute spend: DC Market Insights models USD 248.30 billion of accelerated AI compute spending in 2025 and an attach ratio of 8.70%, so every USD 100 spent on AI servers pulls about USD 8.70 of storage. High-capacity QLC flash is the fastest-growing segment at 21.01% a year because it replaces hard disk drives and performance flash in read-heavy AI data lakes, and the Middle East and Africa is the fastest-growing region at 18.88% a year as, in the DC Market Insights view, national AI campuses in the Gulf add storage from a small base.
Executive Summary
The Global AI-Powered Storage Market size was valued at USD 4.22 billion in 2020, reached USD 21.60 billion in 2025, and is anticipated to reach USD 82.40 billion by 2035, at a CAGR of 14.33% during the forecast period.
| Report attribute | Details |
|---|---|
| Historical Period | 2020-2024 |
| Base Year | 2025 |
| Forecast Period | 2026-2035 |
| AI-Powered Storage Market Size 2025 | USD 21.60 Billion |
| AI-Powered Storage Market, CAGR | 14.33% |
| AI-Powered Storage Market Size 2035 | USD 82.40 Billion |
The market grew at 38.63% a year between 2020 and 2025, and 2025 alone added 47.1% over 2024 as graphics processing unit (GPU) clusters moved from pilots to campus-scale training and inference fleets. Storage spending grew slower than compute in 2023 to 2025: buyers rushed accelerators into service first, and the attach ratio fell from 10.47% in 2020 to 8.70% in 2025. DC Market Insights expects the ratio to recover to 9.62% by 2030 and 10.28% by 2035, because inference, retrieval-augmented generation (RAG) and long-context caching keep far more data online than training alone.
Growth slows to 14.33% a year from 2025 to 2035 as accelerated compute spending matures from triple-digit growth to single digits after 2030. DC Market Insights models compute spend rising from USD 248.30 billion in 2025 to USD 566.00 billion in 2030 and USD 801.60 billion in 2035, and storage keeps a slowly rising share of each dollar.
Market Scope: What Does the AI-Powered Storage Market Cover?
The AI-Powered Storage Market covers every storage system, storage medium and storage software layer bought for AI workloads in data centers, valued at first sale in current US dollars, with 2025 as the base year and forecasts to 2035. DC Market Insights sizes it at USD 21.60 billion in 2025.
Included. Parallel and scale-out file systems, object storage, NVMe and NVMe over Fabrics (NVMe-oF) block storage and unified arrays deployed for AI training, inference, RAG and data preparation; the performance flash, high-capacity flash and hard disk drives that hyperscale and GPU cloud operators buy directly for AI clusters; AI data platform software such as vector indexing, metadata catalogs, global namespaces and AI-driven storage management; and the installation, managed and support services sold with them.
Excluded. Storage that serves general enterprise applications with no AI workload, GPU high-bandwidth memory and server DRAM, accelerators and servers, networking switches and cables, public cloud storage capacity billed to end customers (counted once, at the operator’s purchase), and backup appliances that do not hold AI data.
How the segments fit together. The component, storage architecture, media, workload and end-user splits each re-cut the same USD 21.60 billion, so every split sums to the market total. Media covers the drives and other storage media inside both vendor systems and operator-built storage, valued at the system level.
Market Drivers: What Drives the AI-Powered Storage Market?
Three drivers explain most of the growth in the AI-Powered Storage Market: AI compute spending that DC Market Insights models at USD 248.30 billion in 2025, the shift of AI work from training to inference and RAG, and storage platforms that are now certified and sold as part of the AI stack.
USD 248.30 Billion of AI Compute Spend Pulled USD 21.60 Billion of Storage in 2025
Every GPU cluster needs a data tier that can keep accelerators busy and hold checkpoints, so storage spending follows compute with a short lag. NVIDIA reported record data center revenue of USD 62.3 billion in the fourth quarter of its fiscal 2026, up 75% from a year earlier, and record full-year revenue of USD 215.9 billion (Source: NVIDIA filing with the US Securities and Exchange Commission). Dell Technologies closed more than USD 64 billion of AI-optimized server orders in fiscal 2026, shipped more than USD 25 billion and entered fiscal 2027 with a record backlog of USD 43 billion. DC Market Insights models the storage attached to that compute at 8.70% of spend in 2025, or USD 21.60 billion. The compute layer itself is sized in the AI Infrastructure Market report.
Inference and RAG Grow to USD 34.03 Billion of Storage Spend by 2035
Training reads a large dataset in bursts and writes checkpoints; inference and RAG keep vector indexes, document stores and key-value caches online around the clock. DC Market Insights estimates inference and RAG storage at USD 5.23 billion in 2025 and forecasts USD 34.03 billion by 2035, a CAGR of 20.60%, when it overtakes training as the largest workload. NetApp reported approximately 500 AI and data preparation wins in its fourth fiscal 2026 quarter, a sign that enterprises are preparing their own data for retrieval rather than only renting training capacity.
Certified AI Data Platforms Turn Storage into Part of the AI Stack
Storage is now bought as a validated component of the AI cluster rather than as a separate tender. In March 2025, NVIDIA introduced the AI Data Platform, a reference design that integrates its GPUs, BlueField network interface cards, Spectrum-X switches and AI software with storage systems, and named DDN, Dell Technologies, HPE, Hitachi Vantara, IBM, NetApp, Nutanix, Pure Storage, VAST Data and WEKA among the providers collaborating on it. In October 2025, NetApp introduced AFX, a disaggregated all-flash system for AI workloads that scales performance and capacity independently up to 128 nodes and is certified for NVIDIA DGX SuperPOD. Certification shortens the sales cycle and raises the software content of each deal: DC Market Insights forecasts software to grow at 18.19% a year, against 12.60% for hardware.
Market Trends: How Is AI Storage Changing?
The AI-Powered Storage Market is moving toward high-capacity flash, object storage as the primary AI data lake, and storage suppliers that sell data management rather than capacity.
High-Capacity QLC Flash Grows from 21.3% to 37.6% of Spend
Quad-level cell (QLC) flash fills the gap between hard disk drives and performance flash for read-heavy AI data. In April 2025, Meta was reported to be working with Pure Storage on flash drives, controllers and Purity management software for read-bandwidth-intensive workloads; Pure Storage says its DirectFlash Modules are available at 150 TB and soon 300 TB capacity points using QLC flash. Pure Storage has since partnered with SK hynix to deliver QLC flash storage optimized for large data centers. DC Market Insights forecasts QLC flash to grow from USD 4.60 billion in 2025 to USD 30.98 billion by 2035, a CAGR of 21.01%, overtaking performance flash before 2035.
Object Storage Becomes the AI Data Lake
Object storage is the fastest-growing architecture at 17.60% a year, from USD 5.36 billion in 2025 to USD 27.11 billion by 2035, as RAG pipelines and multimodal datasets settle on S3-compatible object stores with file access added on top. Parallel and scale-out file storage stays the largest architecture at USD 8.99 billion in 2025, because large training jobs still need file semantics and very high read throughput.
Storage Suppliers Rebrand as Data Management Companies
In February 2026, Pure Storage announced it was changing its name to Everpure as it expands from all-flash storage to broader data management for the AI era, and agreed to acquire 1touch, a data intelligence and orchestration company. NetApp’s AI Data Engine (AIDE), announced in October 2025, adds vectorization, semantic search and built-in security controls to its storage. Value moves from the drive to the data layer, which is why DC Market Insights forecasts the software share of the market to rise from 22.3% in 2025 to 31.1% by 2035.
Market Challenges: What Holds the AI-Powered Storage Market Back?
Media supply and power are the two constraints that DC Market Insights expects to slow the AI-Powered Storage Market in 2026 and 2027, together with the attach ratio that fell to 8.70% in 2025 while buyers prioritized GPUs.
Western Digital Hard Drive Output Is Sold Out for 2026
Western Digital’s chief executive said in early 2026 that the company was “pretty much sold out for calendar 2026”, with firm purchase orders from its top seven customers; cloud-oriented business is nearly 89% of its revenue. Sandisk reported fiscal second-quarter 2026 data center revenue of USD 440 million, up 76% from a year earlier, citing strong adoption among AI infrastructure builders, and described a structural reset to align supply with demand. Tight drive and flash supply raises the cost of each terabyte, and DC Market Insights expects some operators to delay capacity expansions or keep data on older tiers longer in 2026.
Storage Competes with GPUs for Power and Budget
Every kilowatt that a storage rack draws is a kilowatt not available for accelerators in a power-limited hall, and every dollar of storage competes with the next GPU order. The attach ratio fell from 10.47% in 2020 to 8.70% in 2025 for this reason. Dell’s storage revenue rose only 2% to USD 4.8 billion in the fourth quarter of its fiscal 2026 while its AI server revenue surged, which shows how far storage lags compute in a build cycle. Newer standards add power controls at the drive level, but power-per-terabyte remains a buying criterion that favors dense flash.
Market Opportunities: Where Are the New Revenue Pools?
The largest new revenue pools in the AI-Powered Storage Market are GPU and neocloud providers, growing at 17.23% a year, AI data platform software, growing at 18.19% a year, and enterprise inference.
GPU and Neocloud Providers Reach USD 14.50 Billion by 2035
Specialist GPU cloud operators spent USD 2.96 billion on AI storage in 2025, and DC Market Insights expects their spend to reach USD 14.50 billion by 2035. In November 2025, VAST Data signed a commercial agreement valued at USD 1.17 billion with CoreWeave, making its software the primary data foundation for CoreWeave’s AI cloud. Contracts of this size show that GPU clouds buy storage as a multi-year platform rather than as boxes.
Enterprise AI Storage Grows to USD 25.46 Billion by 2035
Enterprises spent USD 6.44 billion on AI storage in 2025, and DC Market Insights forecasts USD 25.46 billion by 2035, a CAGR of 14.74%. Enterprises keep sensitive data on premises and add inference, RAG and data preparation to existing arrays, which favors suppliers with installed bases. NetApp’s record all-flash array revenue of USD 1.2 billion in its fourth fiscal 2026 quarter, up 18%, points to that refresh.
Pricing: How Much Do AI Clusters Spend on Storage?
AI clusters spent about USD 8.70 on storage for every USD 100 of accelerated compute in 2025, according to DC Market Insights estimates covering storage systems, operator-bought media, software and services.
| Storage attach (DC Market Insights model) | 2020 | 2025 | 2030 | 2035 |
|---|---|---|---|---|
| Accelerated compute spend (USD billion) | 40.30 | 248.30 | 566.00 | 801.60 |
| Storage attach ratio | 10.47% | 8.70% | 9.62% | 10.28% |
| AI-Powered Storage Market (USD billion) | 4.22 | 21.60 | 54.45 | 82.40 |
The attach ratio fell between 2020 and 2025 because accelerator prices and volumes rose faster than storage budgets. DC Market Insights expects it to rise again as inference fleets keep more data hot and as checkpoint sizes grow with model size. Per-terabyte prices move the other way: denser QLC drives lower the cost of each terabyte over time, while tight 2026 supply lifts it in the short term.
Standards and Regulation: Which Rules Shape AI Storage?
Three sets of rules shape what AI storage buyers specify: the NVMe interface standards, EU data center reporting rules and supplier certification against AI reference designs.
NVMe 2.3 (August 2025). NVM Express released a suite of 11 updated NVMe specifications, adding Rapid Path Failure Recovery, which lets controllers communicate over alternate channels when the primary connection fails, Power Limit Config and Self-reported Drive Power, which give administrators control over and visibility of drive power. These features matter in power-limited AI halls and in NVMe-oF fabrics that connect GPU servers to shared flash.
EU data center rating scheme. Commission Delegated Regulation (EU) 2024/1364 of 14 March 2024 establishes the first phase of a common Union rating scheme for data centers. The scheme covers data centers with installed IT power demand of at least 500 kW and requires annual submissions by May 15, generally covering the preceding calendar year. DC Market Insights expects this reporting to add weight to power-per-terabyte in European storage tenders.
AI reference design certification. Certification such as NVIDIA DGX SuperPOD, which NetApp AFX holds, is not a public standard, but DC Market Insights treats it as a de facto entry requirement in GPU cloud and large enterprise AI tenders.
Market Segmentation: Which Segment Leads the AI-Powered Storage Market?
Hardware leads the AI-Powered Storage Market with 67.3% of 2025 value, parallel and scale-out file storage leads architectures with 41.6%, and hyperscale cloud providers lead buyers with 46.2%. High-capacity QLC flash is the fastest-growing segment at 21.01% a year, ahead of inference and RAG workloads at 20.60%, because read-heavy AI data moves off hard disk drives and performance flash onto dense, lower-power flash.
By Component: Hardware Leads with 67.3%
| Component | 2025 (USD billion) | Share 2025 | 2035 (USD billion) | CAGR 2025-2035 |
|---|---|---|---|---|
| Hardware | 14.54 | 67.3% | 47.63 | 12.60% |
| Software | 4.82 | 22.3% | 25.63 | 18.19% |
| Services | 2.25 | 10.4% | 9.15 | 15.07% |
Hardware loses 9.5 points of share by 2035 as AI data platform software, global namespaces and AI-driven management take a larger part of each deal.
By Storage Architecture: Parallel and Scale-Out File Storage Leads with 41.6%
| Storage architecture | 2025 (USD billion) | Share 2025 | 2035 (USD billion) | CAGR 2025-2035 |
|---|---|---|---|---|
| Parallel and Scale-Out File Storage | 8.99 | 41.6% | 29.83 | 12.75% |
| Object Storage | 5.36 | 24.8% | 27.11 | 17.60% |
| Block Storage (NVMe-oF) | 4.26 | 19.7% | 15.16 | 13.55% |
| Unified and Hybrid Storage | 3.00 | 13.9% | 10.30 | 13.12% |
Object storage gains 8.1 points of share by 2035 and nearly matches file storage, as RAG and multimodal datasets settle on object stores.
By Media: Performance Flash Leads with 44.7%
| Media | 2025 (USD billion) | Share 2025 | 2035 (USD billion) | CAGR 2025-2035 |
|---|---|---|---|---|
| Performance Flash (TLC) | 9.66 | 44.7% | 29.50 | 11.82% |
| High-Capacity Flash (QLC) | 4.60 | 21.3% | 30.98 | 21.01% |
| Hard Disk Drives | 6.18 | 28.6% | 18.05 | 11.31% |
| Other Media | 1.17 | 5.4% | 3.87 | 12.75% |
Hard disk drives still hold 28.6% of 2025 value because AI data lakes and checkpoint archives need low cost per terabyte; Seagate, which reported fiscal 2026 revenue of USD 12.2 billion, up 34%, is addressing that exabyte demand with its Mozaic platform and heat-assisted magnetic recording (HAMR) roadmap. Other media covers tape, storage-class memory and memory-expansion tiers. Flash pricing and supply are covered in the NAND Flash & Enterprise SSD Market report.
By Workload: AI Training Leads with 43.8%
| Workload | 2025 (USD billion) | Share 2025 | 2035 (USD billion) | CAGR 2025-2035 |
|---|---|---|---|---|
| AI Training | 9.46 | 43.8% | 26.12 | 10.69% |
| AI Inference and RAG | 5.23 | 24.2% | 34.03 | 20.60% |
| Data Ingestion and Preparation | 4.45 | 20.6% | 14.75 | 12.73% |
| Checkpoint and Archive Retention | 2.46 | 11.4% | 7.50 | 11.78% |
Inference and RAG overtake training around 2031 in the DC Market Insights model and reach 41.3% of value by 2035.
By End-user: Hyperscale Cloud Providers Lead with 46.2%
| End-user | 2025 (USD billion) | Share 2025 | 2035 (USD billion) | CAGR 2025-2035 |
|---|---|---|---|---|
| Hyperscale Cloud Providers | 9.98 | 46.2% | 35.76 | 13.61% |
| GPU and Neocloud Providers | 2.96 | 13.7% | 14.50 | 17.23% |
| Enterprises | 6.44 | 29.8% | 25.46 | 14.74% |
| Government and Research | 2.23 | 10.3% | 6.67 | 11.61% |
In the DC Market Insights model, hyperscale cloud providers build much of their AI storage themselves from drives bought directly, so their spending is weighted toward media. Government and research buyers, which include national laboratories and sovereign AI programs, grow slowest because supercomputer procurements are lumpy.
DC Exclusive: The Storage Attach Model and Workload × Buyer Matrix
At USD 4.51 billion in 2025, hyperscale training storage is the single largest cell of the matrix and 20.9% of all AI storage spending. The matrix below cross-tabulates the two splits that buyers and vendors ask about most: which workload the storage serves, and who buys it.
| 2025, USD billion | AI Training | Inference and RAG | Data Preparation | Checkpoint and Archive | Total |
|---|---|---|---|---|---|
| Hyperscale Cloud Providers | 4.51 | 2.70 | 1.81 | 0.96 | 9.98 |
| GPU and Neocloud Providers | 1.77 | 0.63 | 0.32 | 0.24 | 2.96 |
| Enterprises | 2.05 | 1.64 | 1.83 | 0.92 | 6.44 |
| Government and Research | 1.14 | 0.25 | 0.50 | 0.34 | 2.23 |
| Total | 9.46 | 5.23 | 4.45 | 2.46 | 21.60 |
GPU and neocloud providers spend 59.7% of their storage budget on training, the highest of any buyer, while enterprises spend 28.4% on data preparation, more than on inference; a supplier strong only in training throughput is selling into the buyer group whose mix shifts fastest toward inference. Government and research buyers put half of their spend into training clusters for national AI and science programs.
The matrix is a DC Market Insights model, not a shipment count. It is built from 54 inputs: 16 years of accelerated compute spend (2020 to 2035), 16 annual storage attach ratios, 4 workload mixes for each of the 4 buyer groups, 4 media cost shares and 2 supplier disclosure checks. The storage attach model behind these figures has two inputs any reader can check: accelerated compute spend each year (USD 248.30 billion in 2025) and the share of it spent on storage (8.70% in 2025). The model and its assumptions are explained on our research methodology page.
Regional Insights: Which Region Leads the AI-Powered Storage Market?
North America leads the AI-Powered Storage Market with 46.8% of 2025 value, and the Middle East and Africa is the fastest-growing region at 18.88% a year, because, in the DC Market Insights view, national AI campuses in Saudi Arabia and the Gulf add storage from a small base.
North America Leads with 46.8% Share
North American buyers spent USD 10.11 billion on AI storage in 2025, and the region is forecast to reach USD 33.95 billion by 2035, a CAGR of 12.88%. The United States alone accounts for USD 9.12 billion, or 90.2% of the region. North America loses 5.6 points of share by 2035 as other regions build their own AI capacity, not because its volume slows.
Asia Pacific Holds 26.4% Share
Asia Pacific is worth USD 5.70 billion in 2025 and USD 24.97 billion by 2035, a CAGR of 15.91%. China is the largest market in the region at USD 2.12 billion, and India grows fastest at 20.79% a year. Asia Pacific gains 3.9 points of share, the largest gain of any region.
Europe Holds 17.9% Share
Europe is worth USD 3.87 billion in 2025 and USD 13.68 billion by 2035, a CAGR of 13.47%. The United Kingdom, Germany and France together account for 58.2% of the region in 2025, and DC Market Insights expects EU energy reporting to favor dense, low-power flash.
Latin America Holds 4.3% Share
Latin America is worth USD 928.89 million in 2025 and USD 4.20 billion by 2035, a CAGR of 16.29%, the second-fastest regional growth.
Middle East and Africa Holds 4.6% Share
The Middle East and Africa is worth USD 993.70 million in 2025 and USD 5.60 billion by 2035, the fastest growth of any region. Saudi Arabia is the largest market in the region at USD 294.77 million in 2025 and grows at 20.18% a year.
Country Analysis: Which Countries Spend the Most on AI Storage?
The United States is the largest country market for AI storage at USD 9.12 billion in 2025, 42.2% of global value, followed by China at USD 2.12 billion (9.8%) and the United Kingdom at USD 911.46 million (4.2%). The 12 largest countries account for 79.9% of 2025 spending.
| Rank | Country | Region | 2025 (USD billion) | Share 2025 | 2035 (USD billion) | CAGR 2025-2035 |
|---|---|---|---|---|---|---|
| 1 | United States | North America | 9.12 | 42.2% | 30.01 | 12.65% |
| 2 | China | Asia Pacific | 2.12 | 9.8% | 8.34 | 14.67% |
| 3 | United Kingdom | Europe | 0.91 | 4.2% | 2.98 | 12.57% |
| 4 | Japan | Asia Pacific | 0.90 | 4.2% | 3.27 | 13.76% |
| 5 | Canada | North America | 0.82 | 3.8% | 3.19 | 14.57% |
| 6 | Germany | Europe | 0.80 | 3.7% | 2.72 | 13.02% |
| 7 | France | Europe | 0.54 | 2.5% | 1.97 | 13.87% |
| 8 | India | Asia Pacific | 0.54 | 2.5% | 3.55 | 20.79% |
| 9 | South Korea | Asia Pacific | 0.51 | 2.3% | 2.10 | 15.24% |
| 10 | Australia | Asia Pacific | 0.40 | 1.9% | 1.72 | 15.58% |
| 11 | Singapore | Asia Pacific | 0.30 | 1.4% | 1.17 | 14.75% |
| 12 | Saudi Arabia | Middle East and Africa | 0.30 | 1.4% | 1.85 | 20.18% |
India is the fastest-growing large country market at 20.79% a year, ahead of Saudi Arabia at 20.18%, as hyperscale and sovereign AI capacity moves into new markets. The country figures are a DC Market Insights allocation of the regional totals, weighted by each country’s estimated share of installed and new AI compute capacity.
Forecast Scenarios: How Could the 2035 Forecast Change?
The AI-Powered Storage Market reaches USD 82.40 billion by 2035 in the base case, with a range of USD 65.10 billion to USD 98.06 billion across the low and high scenarios.
| Scenario | Assumption from 2026 | 2035 (USD billion) | CAGR 2025-2035 |
|---|---|---|---|
| Low | Accelerated compute spend 12% below base; attach ratio stays near 9.1% | 65.10 | 11.66% |
| Base | Compute spend reaches USD 801.60 billion; attach ratio rises to 10.28% | 82.40 | 14.33% |
| High | Compute spend 10% above base; attach ratio reaches about 11.1% on inference growth | 98.06 | 16.33% |
The low case is what a two-year pause in AI capital spending looks like: GPU orders slip and operators sweat existing storage. The high case assumes inference fleets and RAG deployments keep more data on flash than the base case. Flash and hard drive supply is the main swing factor in 2026 and 2027, and the split between vendor systems and operator-built storage is the main swing factor for supplier revenue.
Competitive Insights: Who Leads the AI-Powered Storage Market?
- Dell Technologies
- NetApp
- Everpure (formerly Pure Storage)
- Hewlett Packard Enterprise (HPE)
- IBM
- DDN
- VAST Data
- WEKA
- Hitachi Vantara
- Nutanix
- Cloudian
- Cohesity
- Hammerspace
- Seagate Technology
- Western Digital
- Sandisk
DC Market Insights estimates that the five largest system suppliers, Dell Technologies, NetApp, Everpure, DDN and VAST Data, together hold about 30% of the AI-Powered Storage Market in 2025; the rest is split among other system and software suppliers and the storage that hyperscalers build themselves from drives bought directly from Seagate, Western Digital, Sandisk and other media makers. The estimate sets the AI share of each supplier’s disclosed revenue against the USD 21.60 billion market: NetApp reported fiscal 2026 net revenues of USD 6.93 billion, up 5% (Source: NetApp filing with the US Securities and Exchange Commission), Pure Storage reported fiscal 2026 revenue of USD 3.7 billion, up 16%, and guided to USD 4.3 billion to USD 4.4 billion for fiscal 2027, and VAST Data reported in April 2026 more than USD 4 billion in cumulative bookings and over USD 500 million in committed annual recurring revenue. DDN reported 400% growth in AI revenue in 2024. In the DC Market Insights view, specialist software-defined suppliers such as VAST Data, WEKA and Hammerspace compete on performance for GPU clouds, while Dell, HPE, IBM, Hitachi Vantara and Nutanix sell into enterprise installed bases. The ten storage providers NVIDIA named for its AI Data Platform, DDN, Dell Technologies, HPE, Hitachi Vantara, IBM, NetApp, Nutanix, Pure Storage, VAST Data and WEKA, all appear in this list.
Recent Developments
- In January 2025, Blackstone invested USD 300 million in DDN, valuing the company at USD 5 billion (Source: Blocks and Files news report).
- In April 2025, Hammerspace announced USD 100 million of funding at a valuation of over USD 500 million, with backers including Altimeter Capital and ARK Invest (Source: TechCrunch news report).
- In October 2025, NetApp introduced AFX, a disaggregated all-flash storage system for AI workloads, and the NetApp AI Data Engine at NetApp INSIGHT 2025 (Source: NetApp press release).
- In November 2025, VAST Data signed a commercial agreement valued at USD 1.17 billion with CoreWeave (Source: VAST Data press release).
- In February 2026, Pure Storage announced it was changing its name to Everpure and agreed to acquire 1touch, a data intelligence and orchestration company (Source: World Wide Technology news report).
- In April 2026, VAST Data closed a Series F round of about USD 1 billion at a valuation of USD 30 billion, led by Drive Capital (Source: ChannelLife news report).
We follow these deals, launches and funding rounds as they happen in our data center industry updates.
Methodology: How We Built the AI-Powered Storage Market Model
DC Market Insights built this market from 16 annual cohorts of accelerated AI compute spend (2020 to 2035), each multiplied by a storage attach ratio that falls from 10.47% in 2020 to 8.70% in 2025 and rises to 10.28% by 2035. The compute series is anchored to disclosed accelerator and AI server revenues, including NVIDIA’s data center revenue and Dell’s AI server shipments, and the 2025 total of USD 21.60 billion was checked top-down against the disclosed revenues of NetApp, Pure Storage and VAST Data and the data center revenue of Sandisk. The total was split by 3 components, 4 storage architectures, 4 media types, 4 workloads, 4 end-user groups and 5 regions, and every split sums to the market total. Country values allocate each regional total by country weights for installed and new AI compute capacity. The analyst named on this page built the model, and the reviewer checked the arithmetic, the sources and the dates before publication.
Table of contents
- 01Introduction
- 1.1Market Definition and Scope
- 1.2Components, Architectures, Media and Buyers Covered
- 1.3Currency, Base Year and Forecast Period
- 1.4Key Questions Answered
- 02Research Methodology
- 2.1Storage Attach Model
- 2.2Accelerated Compute Spend Cohorts, 2020-2035
- 2.3Top-Down Check Against Supplier Disclosures
- 2.4Assumptions and Limitations
- 03Executive Summary
- 3.1Market at a Glance, 2020-2035
- 3.2Key Findings
- 3.3Analyst Recommendations by Buyer Type
- 04Market Dynamics
- 4.1Drivers
- 4.2Challenges and Restraints
- 4.3Opportunities
- 4.4Trends
- 4.5Impact Analysis of Drivers and Challenges, 2025-2035
- 05Pricing and Cost Analysis
- 5.1Storage Attach Ratio, 2020-2035
- 5.2Storage Spend per USD of Accelerated Compute
- 5.3Media Supply and Price Outlook, 2026-2027
- 06Standards and Regulation
- 6.1NVMe 2.3 Specifications
- 6.2EU Data Center Rating Scheme (Delegated Regulation 2024/1364)
- 6.3AI Reference Design Certification
- 07Supply Chain and Value Chain Analysis
- 7.1Flash and Hard Disk Drive Supply
- 7.2Storage Systems and Software Suppliers
- 7.3Hyperscale Operator-Built Storage
- 7.4Channels, Integrators and GPU Cloud Partnerships
- 08Global AI-Powered Storage Market Size and Forecast
- 8.1Market Size, 2020-2024
- 8.2Market Size, 2025
- 8.3Market Forecast, 2026-2035
- 09Market by Component
- 9.1Hardware
- 9.2Software
- 9.3Services
- 10Market by Storage Architecture
- 10.1Parallel and Scale-Out File Storage
- 10.2Object Storage
- 10.3Block Storage (NVMe-oF)
- 10.4Unified and Hybrid Storage
- 11Market by Media
- 11.1Performance Flash (TLC)
- 11.2High-Capacity Flash (QLC)
- 11.3Hard Disk Drives
- 11.4Other Media
- 12Market by Workload
- 12.1AI Training
- 12.2AI Inference and RAG
- 12.3Data Ingestion and Preparation
- 12.4Checkpoint and Archive Retention
- 13Market by End-user
- 13.1Hyperscale Cloud Providers
- 13.2GPU and Neocloud Providers
- 13.3Enterprises
- 13.4Government and Research
- 14DC Exclusive: Workload × Buyer Matrix
- 14.1Workload × End-user Matrix, 2025
- 14.2Implications for Suppliers
- 15Market by Region
- 15.1North America (United States, Canada)
- 15.2Europe (United Kingdom, Germany, France, Rest of Europe)
- 15.3Asia Pacific (China, Japan, India, South Korea, Australia, Singapore, Rest of Asia Pacific)
- 15.4Latin America
- 15.5Middle East and Africa (Saudi Arabia, Rest of Middle East and Africa)
- 15.6Top 12 Countries, 2025 and 2035
- 16Regional Cross-Sections
- 16.1Region Shares, 2025 and 2035
- 16.2Region Growth Rates, 2025-2035
- 17Forecast Scenarios
- 17.1Base, Low and High Cases to 2035
- 17.2Sensitivity to Accelerated Compute Spend
- 17.3Sensitivity to the Storage Attach Ratio
- 18Competitive Landscape
- 18.1Top-Five Concentration, 2025
- 18.2Funding Rounds, Acquisitions and Supply Agreements, 2025-2026
- 18.3Product Launches
- 19Company Profiles
- 19.1Dell Technologies
- 19.2NetApp
- 19.3Everpure (formerly Pure Storage)
- 19.4Hewlett Packard Enterprise (HPE)
- 19.5IBM
- 19.6DDN
- 19.7VAST Data
- 19.8WEKA
- 19.9Hitachi Vantara
- 19.10Nutanix
- 19.11Cloudian
- 19.12Cohesity
- 19.13Hammerspace
- 19.14Seagate Technology
- 19.15Western Digital
- 19.16Sandisk
- 20Analyst Recommendations
- 20.1For Storage Systems and Software Suppliers
- 20.2For Hyperscale, GPU Cloud and Enterprise Buyers
- 20.3For Investors
- Fig. 1AI-Powered Storage Market Size, 2020-2035
- Fig. 2Accelerated Compute Spend and Storage Attach Ratio, 2020-2035
- Fig. 3Market Share by Component, 2025 and 2035
- Fig. 4Market Share by Storage Architecture, 2025 and 2035
- Fig. 5Market Share by Media, 2025 and 2035
- Fig. 6Market Share by Workload, 2025 and 2035
- Fig. 7Market Share by End-user, 2025 and 2035
- Fig. 8Workload × End-user Matrix, 2025
- Fig. 9Market by Region, 2025 and 2035
- Fig. 10Top 12 Countries, 2025
- Fig. 11Forecast Scenarios, 2035
- Table 1Report Attributes
- Table 2Storage Attach Model, 2020, 2025, 2030 and 2035
- Table 3Market Size, 2020-2035
- Table 4Market by Component, 2025 and 2035
- Table 5Market by Storage Architecture, 2025 and 2035
- Table 6Market by Media, 2025 and 2035
- Table 7Market by Workload, 2025 and 2035
- Table 8Market by End-user, 2025 and 2035
- Table 9Workload × End-user Matrix, 2025
- Table 10Market by Region, 2025 and 2035
- Table 11Top 12 Countries, 2025 and 2035
- Table 12Forecast Scenarios, 2035
- Table 13Funding Rounds, Acquisitions and Supply Agreements, 2025-2026
- Table 14Company Profiles: Products and AI Storage Focus
About this report
Written by Amit Jain and reviewed by Deepti Agrawal, Senior Editor, Research. Figures are built top-down and bottom-up and reconciled before publication, with 2025 as the base year.
Read our methodologyHow we built this
- Historical period2020-2024
- Base year2025
- Forecast period2026-2035
- Sizing approachTop-down + bottom-up
Need more than the report?
Advisory on this market
Due diligence, site selection and market entry work, by the analysts who wrote this report.
See consulting servicesFrequently asked questions
USD 21.60 billion in 2025, rising to USD 82.40 billion by 2035. DC Market Insights estimates the market at USD 4.22 billion in 2020.
14.33% a year from 2025 to 2035. Growth was faster, at 38.63% a year, between 2020 and 2025 as GPU clusters scaled from pilots to campus-scale fleets.
High-capacity QLC flash, at 21.01% a year from USD 4.60 billion in 2025 to USD 30.98 billion by 2035, as read-heavy AI data moves off hard disk drives and performance flash.
About USD 8.70 for every USD 100 of accelerated compute in 2025, according to DC Market Insights estimates. The attach ratio is forecast to rise to 10.28% by 2035 as inference keeps more data online.
North America, with USD 10.11 billion or 46.8% of 2025 value. The Middle East and Africa grows fastest at 18.88% a year.
AI training, with USD 9.46 billion or 43.8% of 2025 spending. Inference and RAG grow at 20.60% a year to USD 34.03 billion by 2035 and become the largest workload.
Dell Technologies, NetApp, Everpure (formerly Pure Storage), DDN and VAST Data together hold about 30% of the market (DC Market Insights estimate). HPE, IBM, WEKA, Hitachi Vantara, Nutanix, Cloudian, Cohesity and Hammerspace also compete.
USD 9.12 billion in the United States, or 42.2% of 2025 spending, followed by China at USD 2.12 billion. India grows fastest among large country markets at 20.79% a year (DC Market Insights estimate).
Licences, delivery and payment
Which licence should I choose?
Single User is a view-only PDF for one person. Multi User adds a printable PDF and the Excel data for unlimited users at one location. Enterprise covers your whole company and includes 100 free analyst hours.
How and when will I receive the report?
By email, within 24–48 business hours of payment, in the formats of your licence.
How can I pay?
Securely through PayPal: with a PayPal account, a debit or credit card, or PayPal Pay Later where available. Prices are in US dollars.
Can I see a sample first?
Yes. Request a free sample and we will email it to you.
Can the report be tailored to my needs?
Yes. We can add countries, segments or data cuts. Talk to an analyst about the scope you need.
Can I get an invoice or pay against a purchase order?
Write to sales@dcmarketinsights.com and our team will help.