
Norway Data Center Colocation Market Size, Share & Forecast to 2035
Market at a glance
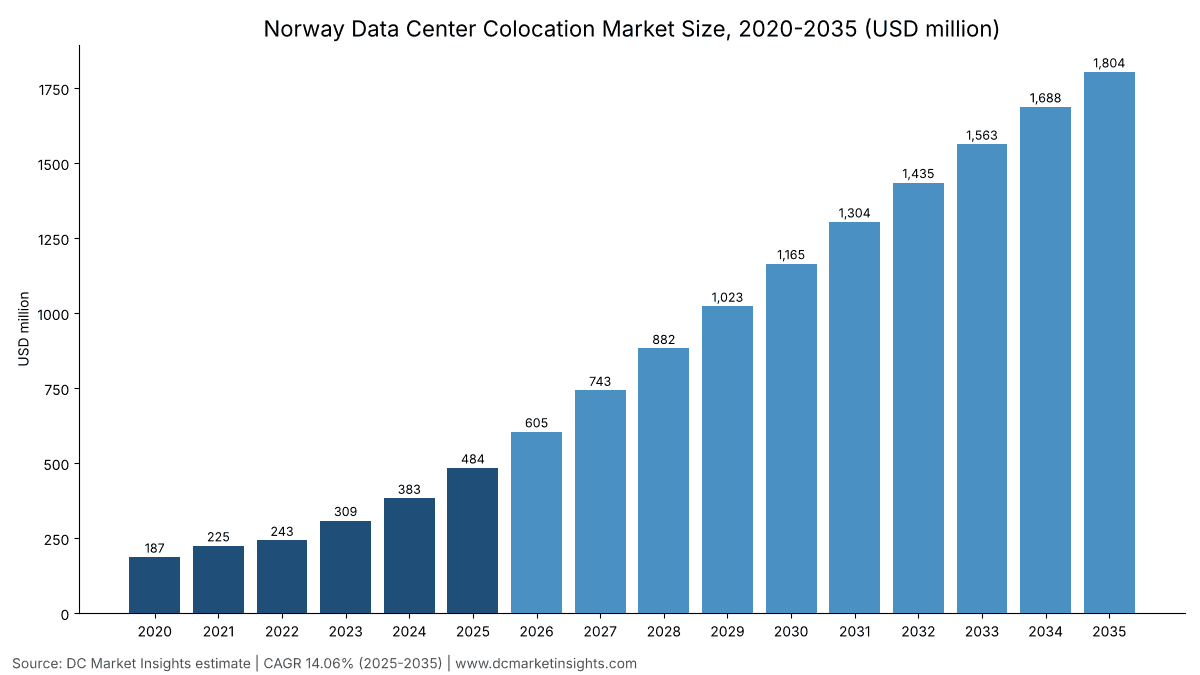
The Norway Data Center Colocation market was worth USD 484.2 million in 2025 and is forecast to reach USD 1,800.0 million by 2035, growing at a 14.06% CAGR.
 By Amit Jain, Senior Consultant, ICT & Emerging Technologies
 Reviewed by Deepti Agrawal
Last updated 5 Nov 2026
Base year 2025 PDF + Excel
Key findings
Built-to-Suit Platform Deals: 223 MW Contracted at Green Mountain
Infrastructure Funds Buy Mine and Fjord Sites: EUR 300 Million for Lefdal
A 6,833 MW Grid Queue at Statnett
Liquid-Cooled Halls for AI Training
What is inside the report
- 01Key Market Statistics: How Big Is the Norway Data Center Colocation Market in 2026?
- 02Key Takeaways: What Should a Tenant Know Before Leasing a Norwegian Data Hall?
- 03Norway Colocation Summary: What Did Norwegian Colocation Operators Earn in 2025?
- 04What Does Norway Data Center Colocation Cover, and Where Does It Stop?
- 05Why Do Norway Data Center Colocation Market Estimates Differ?
- 06Market Drivers: Why Are Tenants Moving Into Norwegian Colocation?
- 07Market Trends: How Is Norwegian Colocation Ownership and Design Changing?
- 08Market Challenges: What Slows Norwegian Colocation Growth?
- 09Market Opportunities: Where Can Norwegian Colocation Operators Win New Revenue?
- 10Pricing: What Does a kW of Colocation Cost in Norway?
- 19chapters
- 2020-2024Historical period
- 2026-2035Forecast period
- 12Companies profiled
Segmentation
Companies profiled
- Green Mountain (Azrieli Group)
- Bulk Infrastructure
- STACK Infrastructure
- Lefdal Mine Datacenter (3i Infrastructure)
- Skygard (Telenor, Hafslund and HitecVision)
- Polar
- Orange Business (former Basefarm sites)
- Telia
- GlobalConnect
- Digiplex sites under STACK
- Nscale (outside scope, GPU cloud)
- Gigahost
Recent developments
Nscale and Aker announced Stargate Norway near Narvik, 230 MW planned with OpenAI as first offtaker (Source: Nscale).
the Ministry of Digitalisation and Public Governance published its data-centre strategy with curtailable grid connections (Source: Norwegian Government).
Bulk Infrastructure closed a EUR 410 million loan for its N01 campus (Source: Oslo Børs).
3i Infrastructure agreed to invest about EUR 300 million in Lefdal Mine Datacenter (Source: 3i Infrastructure).
Statnett paused new large industrial reservations north of Svartisen (Source: Statnett).
Polar's 12 MW DRA01 hall at Tørdal went live for Crusoe (Source: Crusoe).
Full analysis
The Norway Data Center Colocation Market is valued at USD 604.59 million in 2026 and is projected to reach USD 1.80 billion by 2035, up from USD 484.20 million in 2025, a CAGR of 14.06% from 2025 to 2035 (DC Market Insights estimate). Norwegian colocation is a business of grid reservations: data centres held 4,350 MW of grid capacity in April 2026 but used only 794 MW of it, while another 6,833 MW waited for Statnett, the transmission operator (Source: Statistics Norway). Demand behind those reservations is real: Norwegian data centres used 3.3 TWh of electricity in 2025, and the Norwegian Water Resources and Energy Directorate (NVE) projects about 8 TWh in 2030 (Source: NVE, August 2026). Norway Data Center Colocation covers the rent, power and services that third-party operators bill tenants in shared Norwegian data centres; DC Market Insights builds 2025 from 295.00 MW of average live colocation IT load, 88.00% sold, at about EUR 210 per kW per month for retail and EUR 105 for wholesale, all-in with power. Wholesale Colocation grows fastest by type at 15.68% a year as single-tenant halls such as Green Mountain’s 80 MW Undheim build come online, and Western Norway is the fastest-growing region at 18.57% a year because Rogaland and Nordfjord have contracted capacity under construction.
Key Market Statistics: How Big Is the Norway Data Center Colocation Market in 2026?
DC Market Insights values the Norway data center colocation market at USD 604.59 million in 2026, 24.86% above 2025, as live colocation capacity rises from about 320 MW to 400 MW with Lefdal’s contracted 43 MW, Bulk’s N01 phase 2 and Polar’s Tørdal site.
- Market size 2025: USD 484.20 million
- Market size 2026: USD 604.59 million
- Market size 2030: USD 1.17 billion
- Market size 2035: USD 1.80 billion
- CAGR 2025-2035: 14.06% (low case 11.80%, high case 16.07%)
- Largest segment: Wholesale Colocation, 57.25% of 2025 revenue (USD 277.21 million)
- Fastest segment: racks above 30 kW, 25.61% a year; artificial intelligence (AI) and high-performance computing (HPC) tenants grow 25.49% a year
- Leading region: Eastern Norway, 58.00% of 2025 revenue; fastest-growing region: Western Norway, 18.57% a year
- Largest location: Hamar, USD 106.52 million in 2025
- Market leader: Green Mountain, about 31% of 2025 revenue (DC Market Insights estimate)
Key Takeaways: What Should a Tenant Know Before Leasing a Norwegian Data Hall?
DC Market Insights draws four takeaways from a Norway data center colocation market that grows from USD 484.20 million in 2025 to USD 1.80 billion in 2035.
- Grid reservations, not land, decide who can sell capacity: only 794 MW of the 4,350 MW reserved by Norwegian data centres was in use in April 2026, because operators book grid years before halls are built (Source: Statistics Norway).
- Power stays cheap but jumped in 2026: Norwegian industrial users in the 20 to 70 GWh band paid EUR 0.0664 per kWh in the second half of 2025 and EUR 0.0965 in the first half of 2026, still below the EU average of EUR 0.1346 (Source: Eurostat).
- Single-tenant wholesale deals carry the market: Green Mountain had 223 MW contracted in Norway at the end of March 2026, including 90 MW at Hamar and 80 MW at Undheim built for named hyperscale tenants (Source: Azrieli Group).
- Crypto mining is being pushed out: a Storting majority asked the government in February 2026 to propose a ban on new crypto data centres, because 8 of 88 registered data centres sent 30% to 100% of their power to mining (Source: Stortinget).
Norway Colocation Summary: What Did Norwegian Colocation Operators Earn in 2025?
Norwegian colocation operators earned USD 484.20 million in 2025. The Norway Data Center Colocation Market size was valued at USD 187.03 million in 2020, reached USD 484.20 million in 2025, and is anticipated to reach USD 1.80 billion by 2035, at a CAGR of 14.06% during the forecast period. From 2020 to 2025 revenue grew 20.95% a year as live colocation capacity rose from about 120 MW to 320 MW, led by TikTok’s 90 MW contract at Green Mountain’s Hamar campus, signed in March 2023 (Source: Green Mountain).
| Report attribute | Details |
|---|---|
| Historical period | 2020-2024 |
| Base year | 2025 |
| Forecast period | 2026-2035 |
| Market size 2025 | USD 484.20 million |
| Market size 2026 | USD 604.59 million |
| CAGR 2025-2035 | 14.06% |
| Market size 2035 | USD 1.80 billion |
| Segments covered | Colocation Type, Enterprise Size, End User, Rack Density |
| Regions covered | Eastern Norway, Southern Norway, Western Norway, Central Norway, Northern Norway |
Norway data center colocation keeps growing after 2026 because contracted capacity runs ahead of live capacity: Green Mountain’s Norwegian sites can sell up to 365 MW against 223 MW contracted, Lefdal Mine Datacenter has 43 MW contracted on top of 37 MW operating, and Bulk Infrastructure says its N01 campus could pass 1 GW. DC Market Insights expects live colocation capacity of about 720 MW by 2030 and 1,060 MW by 2035.
What Does Norway Data Center Colocation Cover, and Where Does It Stop?
Norway data center colocation, at USD 484.20 million in 2025, counts only revenue that third-party operators bill tenants for space, power, cross-connects and on-site services in Norwegian data centres.
Included
- Retail colocation: racks, cages and private suites under about 1 MW, billed per kW or per rack with power.
- Wholesale colocation: whole halls, built-to-suit buildings and powered shells of 1 MW or more leased to platform, cloud, AI and HPC tenants.
- Interconnection and managed services: cross-connects, remote hands and managed hosting sold by the colocation operator, 12% of retail revenue.
Excluded
- Hyperscale self-builds run by their owners, such as Google’s EUR 600 million Skien site with 240 MW allocated for its first phase, and Microsoft’s Oslo and Stavanger cloud regions.
- Graphics processing unit (GPU) cloud capacity sold by the hour, such as Nscale’s Glomfjord site and the Stargate Norway campus near Narvik, where the operator sells compute, not space.
- Crypto-mining halls, enterprise-owned server rooms, construction spend and land sales.
How the Segments Fit Together
Every segment table, region and location in this Norway data center colocation analysis sums to the same USD 484.20 million in 2025 and USD 1.80 billion in 2035 (the 12 named locations cover 98.5% of 2025 revenue). Colocation type follows the model build; enterprise size, end user and rack density split the same total.
Why Do Norway Data Center Colocation Market Estimates Differ?
DC Market Insights puts the Norway data center colocation market at USD 604.59 million in 2026; estimates that count hyperscale self-builds, GPU cloud campuses or crypto halls are larger, and estimates built top-down from older capacity data are smaller. Our earlier edition valued 2025 at USD 249.96 million on a top-down basis; this edition rebuilds the market from megawatts sold and prices per kW, which gives USD 484.20 million. Small and medium enterprises are in scope at 20.00% of 2025 revenue, mostly retail racks in Oslo, Stavanger, Bergen and Trondheim. The Norway Data Center Market report covers total data-centre spending including self-builds, and the Oslo Data Center Market report covers construction and operating spend in the capital region.
| Element | Counted by DC Market Insights | Why |
|---|---|---|
| Retail and wholesale colocation | Yes, USD 462.02 million in 2025 | Revenue billed by third-party operators |
| Interconnection and managed services | Yes, USD 22.18 million in 2025 | Sold by the same operators in the same halls |
| Hyperscale self-builds (Google Skien, Microsoft regions) | No | Owner-operated; no colocation contract |
| GPU cloud campuses (Stargate Norway, Glomfjord) | No | Compute sold by the hour, not space and power |
| Crypto-mining halls | No | Mining revenue, not tenant rent |
Market Drivers: Why Are Tenants Moving Into Norwegian Colocation?
Three Norway-specific drivers add about USD 1.32 billion to Norwegian colocation revenue between 2025 and 2035.
Built-to-Suit Platform Deals: 223 MW Contracted at Green Mountain
Green Mountain had 223 MW contracted across five Norwegian sites at the end of March 2026, including 90 MW at Hamar for TikTok and 80 MW at Undheim near Stavanger, against a maximum sellable 365 MW (Source: Azrieli Group Q1 2026 presentation). In the Norway colocation model, hyperscale and social media platforms buy 34.00% of 2025 revenue, USD 164.63 million. The 109 MW that Green Mountain has booked but not yet billed turns into rent as buildings are handed over, which lifts Wholesale Colocation from 57.25% of Norway colocation revenue in 2025 to about 66% in 2035 (DC Market Insights estimate).
Data Centre Load Rising From 3.3 TWh to About 8 TWh
NVE counted 3.3 TWh of data-centre electricity use in 2025 from Elhub meter data and projects about 8 TWh in 2030, while Statistics Norway puts data centres at about 2% of Norwegian power use in 2025, up from 0.5% in 2022 (Source: NVE; Statistics Norway). DC Market Insights estimates that colocation halls drew about 1.70 TWh, roughly 52% of the 2025 total. Each extra TWh of colocation load equals about 150 MW of billed IT capacity at 65% load and a power usage effectiveness (PUE) of 1.15, or about USD 285 million of yearly revenue at 2025 prices (DC Market Insights estimate).
AI and HPC Tenants Choose Telemark and Agder
Polar’s 12 MW DRA01 hall at Tørdal went live for Crusoe in October 2026, with a 40 MW liquid-cooled second phase due in late 2027 (Source: Crusoe). AI and HPC tenants rise from 10.00% of Norway colocation revenue in 2025 to 26.00% in 2035, growing 25.49% a year.
Market Trends: How Is Norwegian Colocation Ownership and Design Changing?
Norwegian colocation is moving to infrastructure-fund ownership and denser halls: racks above 30 kW rise from 16.00% of 2025 revenue to 42.00% in 2035.
Infrastructure Funds Buy Mine and Fjord Sites: EUR 300 Million for Lefdal
3i Infrastructure agreed in March 2026 to invest about EUR 300 million for a majority stake in Lefdal Mine Datacenter, which has 37 MW operating and 43 MW more contracted with only one of six mine levels in use (Source: 3i Infrastructure). Nordfjord grows 16.63% a year in the Norway colocation model.
Bond and Bank Debt Funds the Agder Campus
Bulk Infrastructure closed a EUR 410 million senior secured loan for its N01 campus in Vennesla in November 2025 and issued a NOK 1,000 million bond in August 2026; its data center services revenue rose from NOK 225.4 million in 2024 to NOK 415.6 million in 2025 (Source: Bulk Infrastructure; Oslo Børs). Vennesla and Kristiansand is the second-largest Norwegian colocation location at USD 72.63 million in 2025.
Waste-Heat Plans Become a Permit Step
Since 1 April 2025, new Norwegian data centres above 2 MW must carry out a cost-benefit analysis of using their excess heat, under the Energy Act regulation that NVE supervises (Source: NVE). Oslo city halls such as STACK Infrastructure’s Ulven site, which heats about 5,000 homes according to the government strategy, set the model for metro colocation.
Market Challenges: What Slows Norwegian Colocation Growth?
Two constraints hold Norwegian colocation additions to about 68 MW of new live capacity a year from 2030 to 2035.
A 6,833 MW Grid Queue at Statnett
Statistics Norway reported 6,833 MW of data-centre connection requests under processing at Statnett in April 2026, and Statnett paused new reservations for large industrial loads north of Svartisen on 22 April 2026, with 1,150 MW already reserved there (Source: Statistics Norway; Statnett). Northern Norway therefore stays at 1.50% of Norway colocation revenue in 2025 and 2.00% in 2035.
Power Costs Up 45% in One Year
Eurostat’s price for Norwegian industrial users in the 20 to 70 GWh band rose from EUR 0.0664 per kWh in the second half of 2025 to EUR 0.0965 in the first half of 2026, and data centres pay the general electricity tax, 7.13 øre per kWh in 2026, since their reduced rate was abolished (Source: Eurostat; Norwegian Tax Administration). DC Market Insights raises retail prices 1.5% and wholesale prices 1.0% a year from 2026 to pass this through.
Market Opportunities: Where Can Norwegian Colocation Operators Win New Revenue?
Two openings add about USD 0.83 billion of Norwegian colocation revenue between 2025 and 2035.
Liquid-Cooled Halls for AI Training
Racks above 30 kW rise from 16.00% of Norway colocation revenue in 2025 to 42.00% in 2035, a 25.61% annual rate, as Tørdal, Herøya and Undheim halls are designed for direct liquid cooling (DC Market Insights estimate).
Regulated Buyers and the Nkom Register
Commercial data centres have had to register with the Norwegian Communications Authority (Nkom) since 1 January 2025, and the register listed 113 data centres and 61 commercial operators on 5 November 2026 (Source: Nkom). BFSI and government tenants that must show where their data sits buy USD 82.32 million of Norway colocation in 2025, rising to USD 234.54 million in 2035.
Pricing: What Does a kW of Colocation Cost in Norway?
Norwegian colocation cost about EUR 210 per kW per month for retail and EUR 105 for wholesale in 2025, or USD 237.30 and USD 118.65 per kW per month, all-in with power (DC Market Insights estimate); no Norwegian operator publishes a per-kW price.
| Year | Retail (EUR per kW-month) | Wholesale (EUR per kW-month) | Retail (USD) | Wholesale (USD) |
|---|---|---|---|---|
| 2020 | EUR 180.00 | EUR 95.00 | USD 205.20 | USD 108.30 |
| 2025 | EUR 210.00 | EUR 105.00 | USD 237.30 | USD 118.65 |
| 2030 | EUR 226.23 | EUR 110.36 | USD 260.16 | USD 126.91 |
| 2035 | EUR 243.71 | EUR 115.99 | USD 280.27 | USD 133.38 |
Public anchors behind the Norway colocation price model: industrial power at EUR 0.0664 per kWh in the second half of 2025 (Eurostat), so one sold kW at 65% load and a PUE of 1.15 uses about 546 kWh a month, EUR 36 of power and about EUR 3 of 2026 electricity tax; Green Mountain’s contracted net operating income of 1.0 billion Israeli new shekels (NIS) (EUR 278 million) on 257 MW, about EUR 90 per kW per month before power (Source: Azrieli Group). Wholesale tenants that sign 15-year built-to-suit leases, such as Green Mountain’s 5 MW Norwegian contract of August 2026, pay close to that level plus power.
Standards and Regulation: Which Norwegian Rules Apply to a Colocation Hall?
Five rules shape a Norwegian colocation hall in 2026, led by the general electricity tax of 7.13 øre per kWh that data centres now pay.
- Electricity tax: the reduced data-centre rate introduced in 2016 (0.546 øre per kWh in 2022) was abolished after the 2023 budget proposal; the general rate is 7.13 øre per kWh in 2026 after 9.79 to 16.93 øre in 2025 (Source: Stortinget; Norwegian Tax Administration).
- Registration duty: commercial data centres register with Nkom under the Electronic Communications Act since January 2025; 58 data centres from 38 operators had registered by the 1 July 2025 deadline (Source: Nkom).
- Waste-heat analysis: data centres above 2 MW must assess excess-heat use when planning, since 1 April 2025 (Source: NVE).
- National strategy: the Ministry of Digitalisation and Public Governance’s strategy of October 2025 promotes curtailable grid connections and will study a temporary ban on crypto-mining data centres (Source: Norwegian Government).
- Design standards: EN 50600 / ISO/IEC 22237 for facility design and ISO/IEC 27001 for information security are the certifications Norwegian tenants ask for in tenders.
Market Segmentation: Which Colocation Type Earns the Most in Norway?
Wholesale Colocation earns the most in Norway at USD 277.21 million in 2025, 57.25% of revenue, and grows fastest by type at 15.68% a year.
By Colocation Type
| Colocation type | 2025 (USD million) | Share 2025 | 2035 (USD million) | CAGR 2025-2035 |
|---|---|---|---|---|
| Retail Colocation | 184.81 | 38.17% | 548.72 | 11.50% |
| Wholesale Colocation | 277.21 | 57.25% | 1,189.64 | 15.68% |
| Interconnection and Managed Services | 22.18 | 4.58% | 65.85 | 11.50% |
By Enterprise Size
| Enterprise size | 2025 (USD million) | Share 2025 | 2035 (USD million) | CAGR 2025-2035 |
|---|---|---|---|---|
| Large Enterprises | 387.36 | 80.00% | 1,479.45 | 14.34% |
| Small and Medium Enterprises | 96.84 | 20.00% | 324.76 | 12.86% |
By End User
| End user | 2025 (USD million) | Share 2025 | 2035 (USD million) | CAGR 2025-2035 |
|---|---|---|---|---|
| Hyperscale and Social Media Platforms | 164.63 | 34.00% | 505.18 | 11.86% |
| AI and HPC Tenants | 48.42 | 10.00% | 469.09 | 25.49% |
| Cloud and IT Service Providers | 96.84 | 20.00% | 306.72 | 12.22% |
| BFSI | 43.58 | 9.00% | 126.29 | 11.23% |
| Government and Public Sector | 38.74 | 8.00% | 108.25 | 10.82% |
| Energy and Industry | 43.58 | 9.00% | 144.34 | 12.72% |
| Others | 48.42 | 10.00% | 144.34 | 11.54% |
By Rack Density
| Rack density | 2025 (USD million) | Share 2025 | 2035 (USD million) | CAGR 2025-2035 |
|---|---|---|---|---|
| Up to 10 kW per Rack | 222.73 | 46.00% | 324.76 | 3.84% |
| 10 to 30 kW per Rack | 184.00 | 38.00% | 721.68 | 14.64% |
| Above 30 kW per Rack | 77.47 | 16.00% | 757.77 | 25.61% |
DC Exclusive: Norway Colocation Contract Ledger, 6 Operators and About 666 MW Stated
The Norway Colocation Contract Ledger is a DC Market Insights model built on 12 inputs: the six operators below state about 666 MW of live, contracted and sellable capacity, and the Norway colocation forecast counts 720 MW live by 2030, so most of the 2030 base is already named.
| Operator and site | Region | Capacity stated | Status |
|---|---|---|---|
| Green Mountain Hamar (OSL2) | Eastern Norway | 90 MW contracted (TikTok), 150 MW sellable | Live since 2024 |
| Green Mountain Undheim | Western Norway | 80 MW built-to-suit | Under construction |
| Green Mountain Enebakk, Rennesøy, Rjukan | Eastern, Western, Southern Norway | 53 MW contracted, 135 MW sellable | Live |
| Bulk Infrastructure N01 Vennesla | Southern Norway | 12 MW plus 42 MW (2024); campus up to 1 GW | Phase 2 full in Q1 2026 |
| Lefdal Mine Datacenter | Western Norway | 37 MW operating, 43 MW contracted | 3i stake, 2026 |
| STACK OSL04 Holtskogen and Fetsund | Eastern Norway | 18 MW and 16 MW | Live and building |
| Polar DRA Tørdal and HER Herøya | Southern Norway | 12 MW live, 52 MW and 41 MW in development | DRA02 late 2027 |
| Skygard Oslo (OSL1, OSL3, OSL5) | Eastern Norway | 40 MW planned, NOK 2.4 billion | First hall 2025 |
How to read the ledger: Green Mountain’s 365 MW sellable figure alone exceeds the 320 MW of total live Norwegian colocation at the end of 2025, so the market’s limit is tenant contracts and grid timing, not buildings; DC Market Insights excludes Kolos and the Stargate Norway GPU campus from the count.
Regional Insights: Which Norwegian Region Leads Colocation Revenue?
Eastern Norway leads Norwegian colocation with 58.00% of 2025 revenue, and Western Norway grows fastest at 18.57% a year.
Eastern Norway
Eastern Norway earns USD 280.84 million in 2025 and grows 11.44% a year, from Green Mountain’s Hamar and Enebakk campuses, STACK’s Oslo-area sites and Skygard’s Hovinbyen hall.
Southern Norway
Southern Norway earns USD 96.84 million in 2025 and grows 15.15% a year, led by Bulk’s N01 campus in Vennesla and Polar’s Tørdal and Herøya sites in Telemark.
Western Norway
Western Norway earns USD 92.00 million in 2025 and grows fastest at 18.57% a year, because Green Mountain’s 80 MW Undheim building and Lefdal’s 43 MW of contracted capacity are both under way.
Central Norway
Central Norway earns USD 7.26 million in 2025 and grows 17.39% a year from Trondheim retail and research-computing halls.
Northern Norway
Northern Norway earns USD 7.26 million in 2025 and grows 17.39% a year; most northern capacity is GPU cloud or crypto, outside colocation, and Statnett’s April 2026 pause on new large reservations north of Svartisen limits new halls (Source: Statnett).
Location Analysis: Which Norwegian Locations Earn the Most Colocation Revenue?
Hamar earns the most Norwegian colocation revenue at USD 106.52 million in 2025, and Tørdal and Herøya grow fastest at 25.00% a year.
| Rank | Location | Region | 2025 (USD million) | 2035 (USD million) | CAGR 2025-2035 |
|---|---|---|---|---|---|
| 1 | Hamar | Eastern Norway | 106.52 | 252.59 | 9.02% |
| 2 | Vennesla and Kristiansand | Southern Norway | 72.63 | 252.59 | 13.27% |
| 3 | Oslo City (Ulven, Hovinbyen and Grorud) | Eastern Norway | 58.10 | 180.42 | 12.00% |
| 4 | Enebakk | Eastern Norway | 48.42 | 162.38 | 12.86% |
| 5 | Stavanger Area (Rennesøy and Undheim) | Western Norway | 43.58 | 288.67 | 20.81% |
| 6 | Nordfjord (Lefdal) | Western Norway | 38.74 | 180.42 | 16.63% |
| 7 | Fetsund and Lørenskog | Eastern Norway | 38.74 | 108.25 | 10.82% |
| 8 | Vestby (Holtskogen) | Eastern Norway | 29.05 | 126.29 | 15.83% |
| 9 | Rjukan | Southern Norway | 14.53 | 54.13 | 14.06% |
| 10 | Tørdal and Herøya | Southern Norway | 9.68 | 90.21 | 25.00% |
| 11 | Bergen | Western Norway | 9.68 | 36.08 | 14.06% |
| 12 | Trondheim | Central Norway | 7.26 | 36.08 | 17.39% |
The Stavanger area grows 20.81% a year as Undheim opens, and Hamar’s growth slows to 9.02% because its first 90 MW is already contracted.
Forecast Scenarios: How Could Norwegian Colocation Revenue Look in 2035?
Norwegian colocation revenue reaches between USD 1.48 billion and USD 2.15 billion in 2035, with USD 1.80 billion as the DC Market Insights base case.
| Scenario | 2035 (USD million) | CAGR 2025-2035 | Assumption |
|---|---|---|---|
| Low | 1,477.70 | 11.80% | Grid delays cut new capacity after 2025 by 20%; prices 5% lower by 2035 |
| Base | 1,804.21 | 14.06% | 1,060 MW live by 2035, 88% sold |
| High | 2,149.76 | 16.07% | Undheim, Tørdal and N01 run ahead: new capacity +18%, prices 6% higher |
Competitive Insights: Who Leads Norway Data Center Colocation?
Green Mountain leads Norwegian colocation with about 31% of 2025 revenue, and the top five operators hold about 78% (DC Market Insights estimate, based on contracted MW and reported revenue).
- Green Mountain (Azrieli Group)
- Bulk Infrastructure
- STACK Infrastructure
- Lefdal Mine Datacenter (3i Infrastructure)
- Skygard (Telenor, Hafslund and HitecVision)
- Polar
- Orange Business (former Basefarm sites)
- Telia
- GlobalConnect
- Digiplex sites under STACK
- Nscale (outside scope, GPU cloud)
- Gigahost
Company facts: Azrieli Group reported Green Mountain net operating income of NIS 449 million in 2025 against NIS 230 million in 2024, with 148 MW billed and 109 MW booked but not billed across seven sites (Source: Azrieli Group). Bulk Infrastructure Group’s 2025 revenue was NOK 907.2 million, of which NOK 415.6 million came from data center services, and signed contracts should give more than NOK 1,100 million of annual recurring revenue once running (Source: Bulk Infrastructure annual report 2025). Telenor, Hafslund and HitecVision committed NOK 2.4 billion to Skygard for 40 MW in Oslo (Source: HitecVision, March 2024). For the Nordic comparison see the Sweden Data Center Colocation Market and the global Data Center Colocation Market.
Recent Developments: What Changed in Norwegian Colocation Since 2025?
Six dated events since mid-2025 moved about 1 GW of Norwegian data-centre capacity into construction, financing or new rules.
- In July 2025, Nscale and Aker announced Stargate Norway near Narvik, 230 MW planned with OpenAI as first offtaker (Source: Nscale).
- In October 2025, the Ministry of Digitalisation and Public Governance published its data-centre strategy with curtailable grid connections (Source: Norwegian Government).
- In November 2025, Bulk Infrastructure closed a EUR 410 million loan for its N01 campus (Source: Oslo Børs).
- In March 2026, 3i Infrastructure agreed to invest about EUR 300 million in Lefdal Mine Datacenter (Source: 3i Infrastructure).
- In April 2026, Statnett paused new large industrial reservations north of Svartisen (Source: Statnett).
- In October 2026, Polar’s 12 MW DRA01 hall at Tørdal went live for Crusoe (Source: Crusoe).
Methodology: How DC Market Insights Built the Norway Colocation Model
DC Market Insights built the Norway data center colocation model from 320 MW of live colocation IT capacity at the end of 2025, rising to 1,060 MW in 2035, with 85% to 88% sold, a wholesale share of 55% to 82% and prices of EUR 95 to EUR 244 per kW per month, converted at USD 1.13 per EUR in 2025 and USD 1.15 from 2026.
The 2025 receipt: 295.00 MW average live load × 88.00% sold = 259.60 MW billed; 75% wholesale at EUR 105 and 25% retail at EUR 210 per kW per month gives USD 277.21 million and USD 184.81 million, plus USD 22.18 million of services, for USD 484.20 million. Three bound checks hold the result:
- Ceiling 1: 259.60 MW billed at 65% load and PUE 1.15 uses about 1.70 TWh, 52% of the 3.3 TWh NVE counted for all Norwegian data centres in 2025.
- Ceiling 2: 1,060 MW live in 2035 equals 24% of the 4,350 MW of grid capacity that Norwegian data centres held in April 2026 (Source: Statistics Norway).
- Floor: Green Mountain’s 2025 net operating income of NIS 449 million (about USD 125 million) plus Bulk’s NOK 415.6 million of data center services (about USD 39 million) is USD 164 million, 34% of the modelled market, before power pass-through and the other operators.
The full approach is set out in the DC Market Insights research methodology.
Table of contents
- 01Key Market Statistics: How Big Is the Norway Data Center Colocation Market in 2026?
- 1.1Market Size 2025, 2026, 2030 and 2035
- 1.2Largest and Fastest Segments
- 1.3Leading Region and Market Leader
- 02Key Takeaways: What Should a Tenant Know Before Leasing a Norwegian Data Hall?
- 2.1Grid Reservations
- 2.2Power Prices
- 2.3Wholesale Contracts
- 2.4Crypto Rules
- 03Norway Colocation Summary: What Did Norwegian Colocation Operators Earn in 2025?
- 3.1Market Snapshot, 2025, 2026 and 2035
- 3.2Market Size Chart, 2020-2035
- 04What Does Norway Data Center Colocation Cover, and Where Does It Stop?
- 4.1Included
- 4.2Excluded
- 4.3How the Segments Fit Together
- 05Why Do Norway Data Center Colocation Market Estimates Differ?
- 5.1Scope Table
- 5.2Earlier Edition Compared
- 06Market Drivers: Why Are Tenants Moving Into Norwegian Colocation?
- 6.1Built-to-Suit Platform Deals: 223 MW Contracted at Green Mountain
- 6.2Data Centre Load Rising From 3.3 TWh to About 8 TWh
- 6.3AI and HPC Tenants Choose Telemark and Agder
- 07Market Trends: How Is Norwegian Colocation Ownership and Design Changing?
- 7.1Infrastructure Funds Buy Mine and Fjord Sites: EUR 300 Million for Lefdal
- 7.2Bond and Bank Debt Funds the Agder Campus
- 7.3Waste-Heat Plans Become a Permit Step
- 08Market Challenges: What Slows Norwegian Colocation Growth?
- 8.1A 6,833 MW Grid Queue at Statnett
- 8.2Power Costs Up 45% in One Year
- 09Market Opportunities: Where Can Norwegian Colocation Operators Win New Revenue?
- 9.1Liquid-Cooled Halls for AI Training
- 9.2Regulated Buyers and the Nkom Register
- 10Pricing: What Does a kW of Colocation Cost in Norway?
- 10.1Price per kW, 2020-2035
- 10.2Public Price Anchors
- 11Standards and Regulation: Which Norwegian Rules Apply to a Colocation Hall?
- 11.1Electricity Tax
- 11.2Nkom Registration Duty
- 11.3Waste-Heat Analysis
- 11.4National Strategy
- 11.5Design Standards
- 12Market Segmentation: Which Colocation Type Earns the Most in Norway?
- 12.1By Colocation Type
- 12.2By Enterprise Size
- 12.3By End User
- 12.4By Rack Density
- 13DC Exclusive: Norway Colocation Contract Ledger, 6 Operators and About 666 MW Stated
- 13.1Operator and Site Ledger
- 13.2How to Read the Ledger
- 14Regional Insights: Which Norwegian Region Leads Colocation Revenue?
- 14.1Eastern Norway
- 14.2Southern Norway
- 14.3Western Norway
- 14.4Central Norway
- 14.5Northern Norway
- 15Location Analysis: Which Norwegian Locations Earn the Most Colocation Revenue?
- 15.1Hamar
- 15.2Vennesla and Kristiansand
- 15.3Oslo City (Ulven, Hovinbyen and Grorud)
- 15.4Enebakk
- 15.5Stavanger Area (Rennesøy and Undheim)
- 15.6Nordfjord (Lefdal)
- 15.7Fetsund and Lørenskog
- 15.8Vestby (Holtskogen)
- 15.9Rjukan
- 15.10Tørdal and Herøya
- 15.11Bergen
- 15.12Trondheim
- 16Forecast Scenarios: How Could Norwegian Colocation Revenue Look in 2035?
- 16.1Low Scenario
- 16.2Base Scenario
- 16.3High Scenario
- 17Competitive Insights: Who Leads Norway Data Center Colocation?
- 17.1Green Mountain
- 17.2Bulk Infrastructure
- 17.3STACK Infrastructure
- 17.4Lefdal Mine Datacenter
- 17.5Skygard
- 17.6Polar
- 18Recent Developments: What Changed in Norwegian Colocation Since 2025?
- 18.1July 2025 to October 2026 Events
- 19Methodology: How DC Market Insights Built the Norway Colocation Model
- 19.1Model Receipt, 2025
- 19.2Bound Checks
- Fig. 1Norway Data Center Colocation Market Size, 2020-2035
- Table 1Report Attributes
- Table 2Scope Comparison
- Table 3Colocation Price per kW, 2020-2035
- Table 4Market by Colocation Type
- Table 5Market by Enterprise Size
- Table 6Market by End User
- Table 7Market by Rack Density
- Table 8Norway Colocation Contract Ledger
- Table 9Top 12 Locations
- Table 10Forecast Scenarios, 2035
About this report
Written by Amit Jain and reviewed by Deepti Agrawal, Senior Editor, Research. Figures are built top-down and bottom-up and reconciled before publication, with 2025 as the base year.
Read our methodologyHow we built this
- Historical period2020-2024
- Base year2025
- Forecast period2026-2035
- Sizing approachTop-down + bottom-up
Need more than the report?
Advisory on this market
Due diligence, site selection and market entry work, by the analysts who wrote this report.
See consulting servicesFrequently asked questions
USD 604.59 million in 2026, up 24.86% from USD 484.20 million in 2025 (DC Market Insights estimate). The market reaches USD 1.80 billion by 2035, a CAGR of 14.06% from 2025, as live colocation capacity rises from about 320 MW to 1,060 MW.
14.06% a year from 2025 to 2035, after 20.95% a year from 2020 to 2025, because contracted halls at Undheim, Lefdal, Vennesla and Tørdal come online while power prices rose in 2026 (DC Market Insights estimate).
About EUR 210 per kW per month for retail and EUR 105 for wholesale in 2025, all-in with power (DC Market Insights estimate). No Norwegian operator publishes a per-kW price; industrial power cost EUR 0.0664 per kWh in late 2025 (Eurostat).
USD 277.21 million, or 57.25% of 2025 revenue, came from Wholesale Colocation, because platform and cloud tenants lease whole buildings such as TikTok’s 90 MW at Hamar. It grows 15.68% a year to 2035.
25.61% a year from 2025 to 2035 for racks above 30 kW, and 25.49% for AI and HPC tenants, because new halls at Tørdal, Herøya and Undheim are built for liquid cooling (DC Market Insights estimate).
58.00% of 2025 revenue sits in Eastern Norway, led by Hamar (USD 106.52 million) and Oslo-area sites. Western Norway grows fastest at 18.57% a year as Green Mountain’s 80 MW Undheim building and Lefdal’s contracted 43 MW open.
About 31% of 2025 revenue goes to Green Mountain; the top five, with Bulk Infrastructure, STACK Infrastructure, Lefdal Mine Datacenter and Skygard, hold about 78% (DC Market Insights estimate).
794 MW of grid capacity was in use by data centres in April 2026, out of 4,350 MW reserved, with 6,833 MW more under processing at Statnett (Statistics Norway). Colocation was about 320 MW live at end-2025 (DC Market Insights estimate).
7.13 øre per kWh in 2026, the general rate: the reduced data-centre rate introduced in 2016 was abolished after the 2023 budget, so data centres get no discount (Norwegian Tax Administration).
USD 604.59 million in 2026 is the DC Market Insights figure for third-party colocation only. Larger estimates add Google’s Skien self-build, GPU cloud campuses such as Stargate Norway, or crypto halls; our earlier edition said USD 249.96 million for 2025.
Get this report
How do I get the full report?
Request a quote; we reply by email within one business day.
How and when will I receive the report?
By email, within 24-48 business hours of payment.
How can I pay?
Once you accept the quote, we email you a secure payment link.
Can I see a sample first?
Yes. Request a free sample and we will email it to you.
Can the report be tailored to my needs?
Yes. We can add countries, segments or data cuts. Talk to an analyst about the scope you need.
Can I get an invoice or pay against a purchase order?
Write to sales@dcmarketinsights.com and our team will help.