
China Data Center Cooling Market Size, Share & Forecast to 2035
Market at a glance
The China Data Center Cooling market was worth USD 3,402.5 million in 2025 and is forecast to reach USD 10.67 billion by 2035, growing at a 12.11% CAGR.
 By Amit Jain, Senior Consultant, ICT & Emerging Technologies
 Reviewed by Deepti Agrawal
Last updated 29 Oct 2026
Base year 2025 PDF + Excel
Key findings
Beijing's PUE Surcharge Puts a Price on Every 0.1 of PUE From 2026
Immersion Sales Jumped 370.58% at Sugon Shuchuang in 2025
Rack Utilization of 71.4% Leaves Built Halls Unfilled
A USD 455 Million Retrofit Pool in 2026
What is inside the report
- 01Introduction
- 02Executive Summary
- 03Market Dynamics
- 04Market Trends
- 05Pricing Analysis
- 06Standards and Regulation
- 07China Data Center Cooling Market, By Component
- 08China Data Center Cooling Market, By Cooling Approach
- 09China Data Center Cooling Market, By Data Center Type
- 10China Data Center Cooling Market, By Rack Density
- 17chapters
- 2020-2024Historical period
- 2026-2035Forecast period
- —Companies profiled
Segmentation
Full analysis
The China Data Center Cooling Market is valued at USD 4.26 billion in 2026 and is projected to reach USD 10.67 billion by 2035, up from USD 3.40 billion in 2025, a CAGR of 12.11% from 2025 to 2035 (DC Market Insights estimate). What moves the money in China is an electricity bill, not a building count: from 2026 Beijing charges data centers whose power usage effectiveness (PUE) sits above 1.35 an extra RMB 0.2 or 0.5 per kWh (Beijing Municipal Government, November 2024), and national rules cap new large halls at PUE 1.25. That turns every 0.1 of PUE into a cash decision, so operators buy chillers, evaporative units and liquid loops to stay under the line. The 2025 receipt is 2,600 MW of new IT capacity × USD 1.04 million of cooling equipment per MW = USD 2.70 billion, plus 900 MW of PUE retrofits × USD 0.45 million = USD 405.00 million, plus maintenance on 18,343 MW in service = USD 293.49 million. Immersion liquid cooling grows fastest at 23.09% a year because AI racks above 40 kW cannot be cooled by air, and the Western Hub Provinces grow fastest at 18.56% a year because the East Data West Computing plan sends new capacity to Inner Mongolia, Guizhou and Ningxia.
Key Market Statistics: How Big Is the China Data Center Cooling Market in 2026?
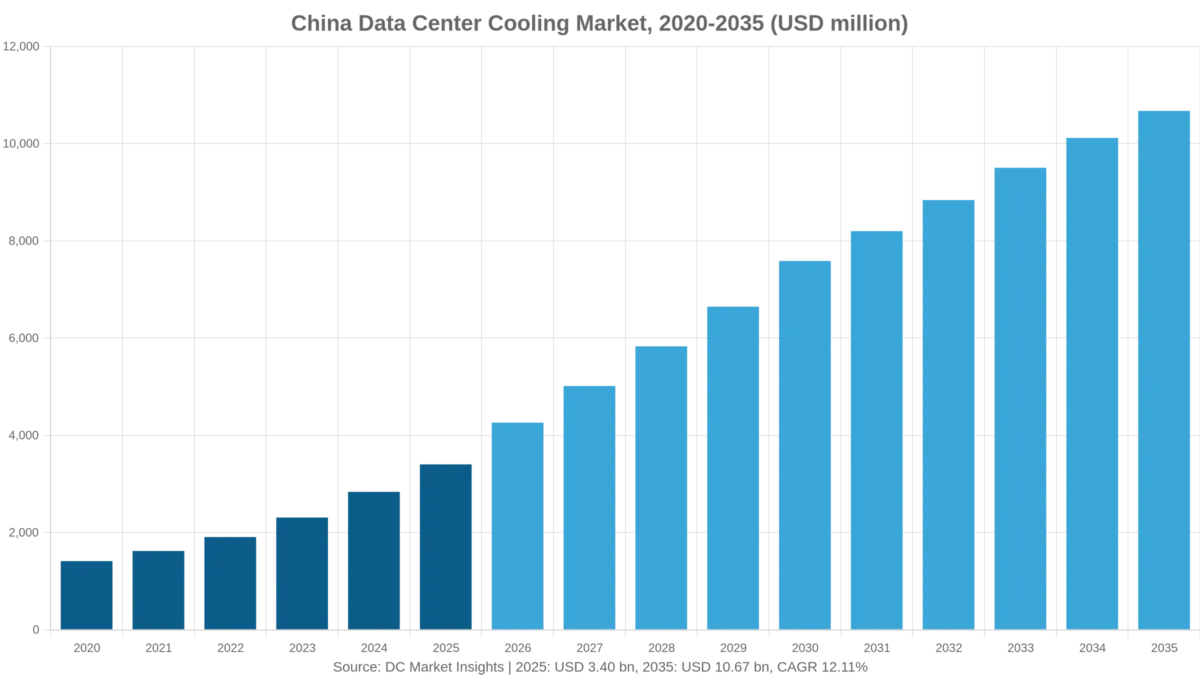
DC Market Insights values the China Data Center Cooling Market at USD 4.26 billion in 2026, 25.25% above the USD 3.40 billion of 2025.
- Market size 2025: USD 3.40 billion
- Market size 2026: USD 4.26 billion
- Market size 2030: USD 7.59 billion
- Market size 2035: USD 10.67 billion
- CAGR 2025-2035: 12.11% (low case 8.49%, high case 15.09%)
- Largest component: Cooling Equipment for New Halls, USD 2.70 billion (79.47% of 2025)
- Fastest cooling approach: Immersion Liquid Cooling, 23.09% a year to 2035
- Leading region: Yangtze River Delta, 30% of 2025 value (USD 1.02 billion)
- Fastest region: Western Hub Provinces, 18.56% a year
- Largest province: Guangdong, USD 578.42 million in 2025
- Largest listed domestic supplier line: Shenzhen Envicool Technology, RMB 3.45 billion of room-level cooling sales in 2025
How Much Did China Spend on Data Center Cooling From 2020 to 2025, and What Comes Next?
The China Data Center Cooling Market size was valued at USD 1.41 billion in 2020, reached USD 3.40 billion in 2025, and is anticipated to reach USD 10.67 billion by 2035, at a CAGR of 12.11% during the forecast period.
| Attribute | Detail |
|---|---|
| Historical period | 2020-2024 |
| Base year | 2025 |
| Forecast period | 2026-2035 |
| Market size 2025 | USD 3.40 billion |
| Market size 2026 | USD 4.26 billion |
| CAGR 2025-2035 | 12.11% |
| Market size 2035 | USD 10.67 billion |
Spending grew 19.22% a year from 2020 to 2025 as new IT capacity climbed from 1,400 MW to 2,600 MW a year and PUE retrofits rose from 200 MW to 900 MW. The China Data Center Cooling Market adds USD 859.20 million in 2026 alone, the largest single-year gain of the decade, because 3,150 MW of new halls are fitted out while the retrofit wave peaks at 1,000 MW. After 2030 growth slows to 7.07% a year as new capacity levels off near 6,000 MW and retrofits fall to 600 MW.
What Does the China Data Center Cooling Market Include?
The China Data Center Cooling Market covers USD 3.40 billion of 2025 spending on the equipment and services that remove heat from data halls in mainland China.
Included: chillers, cooling towers and dry coolers; computer-room air handlers and precision air units; indirect evaporative and free-cooling units; cold-plate liquid loops with coolant distribution units; immersion tanks and fluids; PUE retrofit projects that replace or upgrade cooling plant; and scheduled maintenance and service of cooling plant.
Excluded: hot- and cold-aisle containment, temperature sensors and thermal control software (these sit in the China Data Center Thermal Management Market, of which cooling is 90.9%); server-level heat sinks and fans; cooling electricity; and buildings.
How the segments fit together: the component split (new-hall equipment, retrofits, maintenance) adds up to the total; the cooling-approach, data-center-type and rack-density splits each divide the same total a different way. The cooling-equipment line equals the cooling systems line inside the China Data Center Market, so the two reports agree.
Why Do China Data Center Cooling Market Estimates Differ?
Estimates differ because of scope: DC Market Insights counts USD 4.26 billion of China cooling spend in 2026, while narrower editions count only new-hall equipment and broader ones add containment, controls software or the cooling share of the power bill.
An earlier DC Market Insights edition put the 2025 market at USD 1.36 billion; it counted solution and service sales by product category and missed the PUE retrofit wave and the full fit-out of hyperscale halls. The bottom-up model in this edition multiplies 2,600 MW of new 2025 IT capacity by USD 1.04 million per MW, which alone gives USD 2.70 billion. Broader definitions add aisle containment, sensors and thermal software (about USD 340 million more in 2025) and sometimes the cooling share of the RMB electricity bill, which this report leaves out because it is an operating cost, not a cooling purchase. Enterprise and government server rooms are in scope and worth USD 612.45 million in 2025.
| Element | In this report | Why |
|---|---|---|
| Cooling equipment for new halls | Yes, USD 2.70 billion (2025) | Core purchase for every new MW |
| PUE retrofit projects | Yes, USD 405.00 million | Rules force upgrades of existing halls |
| Cooling maintenance and service | Yes, USD 293.49 million | Recurring spend on installed plant |
| Containment, sensors and thermal software | No | Counted in Thermal Management |
| Cooling electricity | No | Operating cost, not equipment |
Market Drivers: Why Are Chinese Operators Buying More Cooling in 2026?
Three rules and one compute surge add about USD 859.20 million of China data center cooling demand between 2025 and 2026.
Beijing’s PUE Surcharge Puts a Price on Every 0.1 of PUE From 2026
The Beijing Municipal Government said in November 2024 that data centers with PUE above 1.35 pay a differential electricity price from 2026, and that the city’s average must fall below 1.35 by 2027 (Beijing Municipal Government). GDS Holdings repeated the rule in its 2025 annual report filed with the U.S. Securities and Exchange Commission in April 2026. For a 10 MW hall at PUE 1.60 the surcharge reaches about USD 6.8 million a year at RMB 0.5 per kWh (DC Market Insights estimate), so a cooling retrofit costing USD 4.5 million pays back in under a year. Beijing municipality accounts for USD 408.30 million of 2025 cooling spend.
The National 1.25 PUE Cap for New Large Halls Sets the Equipment Bill
The Special Action Plan for green and low-carbon data centers, issued in July 2024 by the National Development and Reform Commission (NDRC), the Ministry of Industry and Information Technology (MIIT), the National Energy Administration (NEA) and the National Data Administration, set a national average PUE below 1.5 by end-2025 and PUE 1.25 or lower for new and expanded large data centers, with hub-node projects at 1.2 (NDRC). Air cooling alone rarely reaches 1.2, so cooling equipment per new MW rises from USD 0.85 million in 2020 to USD 1.04 million in 2025 and USD 1.55 million by 2035.
Intelligent Compute of 2,185 EFLOPS Pushes Racks Above 40 kW
China’s intelligent computing capacity reached 2,185 EFLOPS at end-June 2026, up 177%, according to a State Council release of July 2026. Graphics processing unit (GPU) racks run at 40 to 130 kW, beyond what air handlers remove, so cooling spend on racks above 40 kW grows from USD 612.45 million in 2025 to USD 5.12 billion in 2035, 23.67% a year. Demand from AI halls is sized in the China AI Data Center Market.
Market Trends: Which Cooling Technologies Are Chinese Data Centers Switching To?
Liquid cooling rises from 25% of China data center cooling spend in 2025 to 51% in 2035, worth USD 5.44 billion by then.
Immersion Sales Jumped 370.58% at Sugon Shuchuang in 2025
According to its 2025 annual report, Sugon Shuchuang (Sugon Data Energy) earned 2025 immersion cooling revenue of RMB 457.93 million, up 370.58%, and cold-plate revenue of RMB 298.64 million, up 40.01% (Source: Sugon Shuchuang annual report, April 2026). Immersion is the smallest approach in this market at USD 187.14 million in 2025 but the fastest, at 23.09% a year.
Chinese Cooling Makers Are Selling Abroad as Home Growth Cools
Shenzhen Envicool Technology said in its 2025 annual report that data-center cooling growth slowed in the second half of 2025 while overseas revenue rose, and Guangdong Shenling Environmental Systems reported data-service new orders up about 72% in 2025 with progress overseas and in liquid cooling. Export orders lift factory scale and cut the domestic cost per MW for cold-plate loops, which this model keeps at USD 1.04 million per new MW in 2025.
Indirect Evaporative Cooling Holds 22% in the Dry North
Indirect evaporative and free cooling is worth USD 748.55 million in 2025, because sites in Hebei, Inner Mongolia and Ningxia get several thousand free-cooling hours a year; its share eases to 18% by 2035 as liquid loops take the AI halls.
Market Challenges: What Holds Back China Data Center Cooling Spend?
Idle racks and slower vendor growth are the two brakes, together holding 2027-2030 growth to 15.51% a year against 25.25% in 2026.
Rack Utilization of 71.4% Leaves Built Halls Unfilled
National rack utilization stood at 71.4% at end-June 2026 (State Council, July 2026), and 15.56 million standard racks were in use (Digital China, October 2026). Almost three in ten racks are empty, so operators delay new cooling plant in eastern cities and buy only for AI halls. The model holds new IT capacity at 3,150 MW in 2026 and 3,600 MW in 2027 instead of extending the 2024-2026 pace.
Vendor Growth Halved From 41% to 26% in a Year
Envicool’s room-level cooling sales rose 41.28% in 2025 to RMB 3.45 billion but only 25.84% in the first half of 2026 to RMB 1.70 billion (Envicool 2025 annual report; 2026 interim report). Price competition among domestic chiller and air-handler makers keeps air-cooling equipment growth at 6.26% a year to 2035.
Market Opportunities: Where Can Cooling Suppliers Win New Orders in China?
The PUE retrofit pool and western liquid-cooled campuses are worth a combined USD 0.81 billion in 2025.
A USD 455 Million Retrofit Pool in 2026
PUE retrofit projects peak at 1,000 MW and USD 455.00 million in 2026, as halls built before 2020 at PUE 1.5 to 1.7 must reach the 1.5 national average and Shanghai pushes sites above PUE 1.7 to exit (Shanghai Municipal Commission of Economy and Informatization, June 2022). Suppliers that bundle evaporative units, variable-speed chillers and controls win these jobs.
Western Hub Campuses Grow From USD 408 Million to USD 2.24 Billion
Cooling spend in the Western Hub Provinces grows from USD 408.30 million in 2025 to USD 2.24 billion in 2035, 18.56% a year, because hub-node rules require PUE below 1.2 at Gui’an and new hub halls must exceed 80% green power (NDRC, July 2024). Cold-plate loops with dry coolers fit these sites.
What Do Chinese Operators Pay for Data Center Cooling per MW?
A new Chinese data hall paid USD 1.04 million of cooling equipment per MW of IT load in 2025, up from USD 0.85 million in 2020 (DC Market Insights estimate).
| Price point | 2020 | 2025 | 2030 | 2035 |
|---|---|---|---|---|
| Cooling equipment per new MW (USD million) | 0.85 | 1.04 | 1.35 | 1.55 |
| PUE retrofit per MW (USD million) | 0.40 | 0.45 | 0.48 | 0.50 |
| Cooling maintenance per installed MW-year (USD) | 13,000 | 16,000 | 17,500 | 19,000 |
Public anchors: according to their annual reports of April 2026, Envicool sold RMB 3.45 billion of room-level cooling products in 2025, and Shenling’s data-service segment earned RMB 2.34 billion. Huawei Digital Power markets its FusionModule2000 at 50 kW per rack with air cooling (Huawei, October 2025), which shows that air can still serve mid-density halls at a lower cost per MW than liquid. The price per MW rises because liquid-cooled halls need coolant distribution units, manifolds and dry coolers on top of a smaller chilled-water plant.
Standards and Regulation: Which PUE Rules Set Cooling Demand in Chinese Data Centers?
Six regulations set PUE limits between 1.15 and 1.5 for Chinese data halls and steer the USD 2.70 billion of 2025 cooling equipment spend, by DC Market Insights estimates.
- GB 40879-2021, the mandatory national standard on data center energy efficiency, released October 2021 and in force from 1 November 2022 (State Administration for Market Regulation).
- Special Action Plan for green and low-carbon data centers, July 2024: national average PUE below 1.5 by end-2025; new large halls at 1.25; hub nodes at 1.2; above 80% green power in new hub halls (State Council information office; NDRC).
- East Data West Computing plan, March 2022: hub nodes below PUE 1.25, Gui’an below 1.2, western utilization raised from 30% to above 50% (NDRC).
- Beijing PUE entry levels of 1.3, 1.25, 1.2 and 1.15 by scale (Beijing Municipal Government, July 2021).
- Beijing differential electricity price above PUE 1.35 from 2026 (Beijing Municipal Government, November 2024).
- Shanghai: new large halls in clusters at PUE about 1.25, about 280,000 racks by 2025, sites above PUE 1.7 to exit (Shanghai Municipal Commission of Economy and Informatization, June 2022).
Which Cooling Segments Carry the Most Value in China?
Cooling equipment for new halls carries USD 2.70 billion, 79.47% of the 2025 China Data Center Cooling Market, and rises to 87.13% by 2035.
By Component
| Component | 2025 (USD million) | Share 2025 | 2035 (USD million) | CAGR 2025-2035 |
|---|---|---|---|---|
| Cooling Equipment for New Halls | 2,704.00 | 79.47% | 9,300.00 | 13.15% |
| PUE Retrofit Projects | 405.00 | 11.90% | 300.00 | -2.96% |
| Cooling Maintenance and Service | 293.49 | 8.63% | 1,073.70 | 13.85% |
PUE retrofits shrink by 2.96% a year after 2026 as the old stock is upgraded; maintenance grows 13.85% a year with the installed base.
By Cooling Approach
| Cooling Approach | 2025 (USD million) | Share 2025 | 2035 (USD million) | CAGR 2025-2035 |
|---|---|---|---|---|
| Precision Air and Chilled-Water Cooling | 1,803.32 | 53.00% | 3,308.85 | 6.26% |
| Indirect Evaporative and Free Cooling | 748.55 | 22.00% | 1,921.27 | 9.88% |
| Cold-Plate Liquid Cooling | 663.49 | 19.50% | 3,949.27 | 19.53% |
| Immersion Liquid Cooling | 187.14 | 5.50% | 1,494.32 | 23.09% |
Precision air and chilled water keeps the largest 2035 share of air cooling at 31%, but cold-plate liquid cooling overtakes it by 2035 at USD 3.95 billion.
By Data Center Type
| Data Center Type | 2025 (USD million) | Share 2025 | 2035 (USD million) | CAGR 2025-2035 |
|---|---|---|---|---|
| Hyperscale and Cloud Self-Build | 1,156.85 | 34.00% | 4,376.22 | 14.23% |
| Telecom Operator IDC | 918.67 | 27.00% | 2,561.69 | 10.80% |
| Third-Party Colocation and Wholesale | 714.52 | 21.00% | 2,454.95 | 13.14% |
| Enterprise and Government | 612.45 | 18.00% | 1,280.84 | 7.66% |
Hyperscale and cloud self-builds by Alibaba, Tencent, ByteDance and Baidu lead at 34% and grow 14.23% a year; telecom operator IDCs hold 27% in 2025.
By Rack Density
| Rack Density | 2025 (USD million) | Share 2025 | 2035 (USD million) | CAGR 2025-2035 |
|---|---|---|---|---|
| Below 15 kW | 1,633.20 | 48.00% | 2,348.21 | 3.70% |
| 15 to 40 kW | 1,156.85 | 34.00% | 3,202.11 | 10.72% |
| Above 40 kW | 612.45 | 18.00% | 5,123.38 | 23.67% |
Racks above 40 kW go from 18% to 48% of cooling spend, the clearest sign that AI halls drive the China Data Center Cooling Market.
DC Exclusive: China Cooling Supplier Revenue Map, Four Listed Makers Hold 31.28%
Four Chinese listed cooling makers disclosed data-center-related revenue of USD 1.06 billion in 2025, equal to 31.28% of the China Data Center Cooling Market (DC Market Insights model built on 6 inputs: four filed revenue lines, the RMB 7.2 per USD rate and the 2025 market size).
| Company | Disclosed line | RMB million | USD million | Share of 2025 market |
|---|---|---|---|---|
| Shenzhen Envicool Technology | room-level cooling products, 2025 | 3,448.48 | 478.96 | 14.08% |
| Guangdong Shenling Environmental Systems | data-service segment, 2025 | 2,343.26 | 325.45 | 9.57% |
| Guangzhou Goaland Energy Conservation Technology | total revenue, 2025 | 989.12 | 137.38 | 4.04% |
| Sugon Shuchuang (Sugon Data Energy) | total revenue, 2025 | 882.34 | 122.55 | 3.60% |
| Total | Four listed makers | 7,663.20 | 1,064.34 | 31.28% |
The map is a floor, not a ranking: Envicool’s and Shenling’s lines include overseas sales, while Huawei Digital Power, Vertiv, Schneider Electric, Gree, Midea and Daikin do not disclose China data-center cooling revenue. Vertiv’s whole Asia Pacific segment sold USD 2.02 billion in 2025, up 17.5% (Vertiv 2025 annual report). Buyers can read the map as a supplier shortlist: the four listed makers grew 32% to 74% in 2025, so their delivery slots for cold-plate and immersion systems fill fastest.
Which Region of China Spends Most on Data Center Cooling?
The Yangtze River Delta leads with USD 1.02 billion in 2025, and the Western Hub Provinces grow fastest at 18.56% a year to 2035.
Yangtze River Delta: USD 1.02 billion in 2025
Yangtze River Delta holds 30% of 2025 China data center cooling spend and reaches USD 2.78 billion by 2035 at 10.52% a year. Shanghai requires new large cluster halls at PUE about 1.25 and planned about 280,000 racks by 2025 (Shanghai Municipal Commission of Economy and Informatization, June 2022), so Shanghai, Jiangsu, Zhejiang and Anhui buy high-efficiency chillers and liquid loops.
Beijing-Tianjin-Hebei and North China: USD 918.67 million in 2025
Beijing-Tianjin-Hebei and North China holds 27% of 2025 China data center cooling spend and reaches USD 2.56 billion by 2035 at 10.80% a year. Beijing’s surcharge above PUE 1.35 from 2026 pushes retrofits in the city and new free-cooled builds in Zhangjiakou and Langfang, where Hebei grows 13.19% a year.
Guangdong-Hong Kong-Macao Greater Bay Area: USD 646.47 million in 2025
Guangdong-Hong Kong-Macao Greater Bay Area holds 19% of 2025 China data center cooling spend and reaches USD 1.71 billion by 2035 at 10.20% a year. Hot, humid summers keep chilled-water plants large in Guangdong, home to Envicool (Shenzhen) and Shenling (Foshan), the two largest listed cooling makers.
Western Hub Provinces: USD 408.30 million in 2025
Western Hub Provinces holds 12% of 2025 China data center cooling spend and reaches USD 2.24 billion by 2035 at 18.56% a year. Gui’an must stay below PUE 1.2 (NDRC, March 2022), and Inner Mongolia and Ningxia get long free-cooling seasons; Ningxia (Zhongwei) grows fastest of all provinces at 21.58% a year.
Chengdu-Chongqing and Central China: USD 408.30 million in 2025
Chengdu-Chongqing and Central China holds 12% of 2025 China data center cooling spend and reaches USD 1.39 billion by 2035 at 13.01% a year. The Chengdu-Chongqing hub node targets western utilization above 50% under the East Data West Computing plan, with Sichuan and Chongqing growing 13.30% and 13.85% a year.
Which Chinese Provinces Lead Data Center Cooling Spend?
Guangdong leads the China Data Center Cooling Market with USD 578.42 million in 2025, and Ningxia (Zhongwei) is the fastest-growing province at 21.58% a year.
| Rank | Province | Region | 2025 (USD million) | 2035 (USD million) | CAGR |
|---|---|---|---|---|---|
| 1 | Guangdong | Guangdong-Hong Kong-Macao Greater Bay Area | 578.42 | 1,494.32 | 9.96% |
| 2 | Beijing | Beijing-Tianjin-Hebei and North China | 408.30 | 853.90 | 7.66% |
| 3 | Hebei (Zhangjiakou and Langfang) | Beijing-Tianjin-Hebei and North China | 340.25 | 1,174.11 | 13.19% |
| 4 | Shanghai | Yangtze River Delta | 323.24 | 800.53 | 9.49% |
| 5 | Jiangsu | Yangtze River Delta | 289.21 | 747.16 | 9.96% |
| 6 | Zhejiang | Yangtze River Delta | 221.16 | 587.05 | 10.25% |
| 7 | Sichuan | Chengdu-Chongqing and Central China | 153.11 | 533.68 | 13.30% |
| 8 | Inner Mongolia (Horinger) | Western Hub Provinces | 153.11 | 907.26 | 19.47% |
| 9 | Guizhou (Gui’an) | Western Hub Provinces | 136.10 | 587.05 | 15.74% |
| 10 | Chongqing | Chengdu-Chongqing and Central China | 102.07 | 373.58 | 13.85% |
| 11 | Anhui (Wuhu) | Yangtze River Delta | 68.05 | 426.95 | 20.16% |
| 12 | Ningxia (Zhongwei) | Western Hub Provinces | 68.05 | 480.32 | 21.58% |
Inner Mongolia (Horinger) is the fastest large province, growing 19.47% a year from USD 153.11 million to USD 907.26 million, as Horinger hosts the hub-node AI campuses. The 12 provinces hold 83.5% of 2025 value; the rest is spread over smaller provinces.
Forecast Scenarios: How Big Could China Data Center Cooling Get by 2035?
The China Data Center Cooling Market reaches USD 10.67 billion in 2035 in the base case, with a range of USD 7.69 billion to USD 13.88 billion.
| Scenario | 2035 (USD million) | CAGR 2025-2035 | Assumption |
|---|---|---|---|
| Low | 7,685.06 | 8.49% | Rack utilization stays near 70%, AI chip supply limits new halls, liquid share 40% |
| Base | 10,673.70 | 12.11% | New IT capacity 6,000 MW a year by 2035, liquid share 51% |
| High | 13,875.81 | 15.09% | Faster AI build-out, PUE caps tighten to 1.15, liquid share above 60% |
Key Players and Market Share: Who Supplies Cooling to Chinese Data Centers?
Four listed domestic makers disclosed USD 1.06 billion of 2025 data-center-related revenue, 31.28% of the China Data Center Cooling Market; DC Market Insights estimates the top five suppliers hold about 45%.
- Shenzhen Envicool Technology
- Huawei Digital Power
- Guangdong Shenling Environmental Systems
- Vertiv
- Sugon Shuchuang (Sugon Data Energy)
- Schneider Electric
- Gree Electric Appliances
- Midea Group (Midea Building Technologies)
- Daikin (McQuay)
- Johnson Controls
- Guangzhou Goaland Energy Conservation Technology
- Inspur Information
- Delta Electronics
- STULZ
- Trane Technologies
- Carrier
Shenzhen Envicool Technology had 2025 revenue of RMB 6.07 billion, up 32.23%, with room-level cooling at 56.83% of sales (Envicool annual report, April 2026). Guangdong Shenling Environmental Systems earned RMB 2.34 billion in its data-service segment, up 51.42%, and its new orders in the first half of 2026 were about 2.3 times a year earlier (Shenling interim report, August 2026). Guangzhou Goaland Energy Conservation Technology reported RMB 989.12 million of 2025 revenue, up 43.09%. VNET holds 249 patents in China with liquid cooling as a focus area (VNET 2025 annual report). Foreign makers Vertiv, Schneider Electric, Johnson Controls, Daikin (McQuay), STULZ and Trane compete for hyperscale chiller and air-handler orders.
What Changed in China Data Center Cooling in 2026?
Six dated events in 2026 point to 25.25% growth in the China Data Center Cooling Market this year.
- In February 2026, Vertiv reported Asia Pacific net sales of USD 2.02 billion for 2025, up 17.5% (Source: Vertiv annual report).
- In April 2026, Envicool reported 2025 revenue of RMB 6.07 billion, up 32.23% (Source: Envicool annual report).
- In April 2026, Sugon Shuchuang reported 2025 revenue of RMB 882.34 million, up 74.29%, led by immersion cooling (Source: Sugon Shuchuang annual report).
- In May 2026, the National Energy Administration said computing centers used 170 billion kWh in 2025, 1.6% of national electricity (Source: NEA).
- In July 2026, the State Council reported intelligent compute of 2,185 EFLOPS, up 177%, and rack utilization of 71.4% at end-June (Source: State Council).
- In August 2026, Shenling reported first-half data-service revenue up 30.68% and new orders about 2.3 times a year earlier (Source: Shenling interim report).
Research Methodology: How Was the China Data Center Cooling Market Sized?
DC Market Insights sized the market at USD 3.40 billion for 2025 from 8 inputs: new IT MW, in-service MW, cooling cost per MW, retrofit MW, retrofit cost, maintenance per MW-year, the 1.42 national PUE and the RMB 7.2 per USD rate.
Formula: market = new IT MW × cooling equipment per MW + retrofit MW × retrofit cost per MW + prior-year in-service MW × maintenance per MW-year. For 2025: 2,600 × USD 1.04 million = USD 2.70 billion; 900 × USD 0.45 million = USD 405.00 million; 18,343 MW × USD 16,000 = USD 293.49 million; total USD 3.40 billion. Every segment, region and province split sums to the total in every year.
Three bound checks: (1) ceiling, the market is 4.68% of the USD 72.77 billion China Data Center Market in 2025; (2) ceiling, it is 90.9% of the USD 3.74 billion China Data Center Thermal Management Market, which adds containment and software; (3) floor, four listed domestic makers alone sold USD 1.06 billion, 31.28% of the estimate. NEA’s 170 billion kWh at PUE 1.42 implies about 13.7 GW of average IT load, consistent with the 20.6 GW in service at end-2025. Full method: research methodology. Global context: Data Center Cooling Market.
Table of contents
- 01Introduction
- 1.1Report Description
- 1.2Market Definition and Scope
- 1.3Research Assumptions
- 02Executive Summary
- 2.1Market Snapshot, 2025, 2026 and 2035
- 2.2Key Market Statistics
- 2.3Why China Data Center Cooling Market Estimates Differ
- 03Market Dynamics
- 3.1Beijing's PUE Surcharge From 2026
- 3.2The National 1.25 PUE Cap for New Large Halls
- 3.3Intelligent Compute of 2,185 EFLOPS and Racks Above 40 kW
- 3.4Rack Utilization of 71.4%
- 3.5Vendor Growth Slowdown
- 3.6USD 455 Million Retrofit Pool in 2026
- 3.7Western Hub Campuses
- 04Market Trends
- 4.1Immersion Cooling Growth at Sugon Shuchuang
- 4.2Overseas Sales by Chinese Cooling Makers
- 4.3Indirect Evaporative Cooling in the Dry North
- 05Pricing Analysis
- 5.1Cooling Equipment per New MW, 2020-2035
- 5.2PUE Retrofit Cost per MW
- 5.3Cooling Maintenance per MW-Year
- 06Standards and Regulation
- 6.1GB 40879-2021
- 6.2Special Action Plan for Green and Low-Carbon Data Centers
- 6.3East Data West Computing Plan
- 6.4Beijing PUE Entry Levels and Differential Electricity Price
- 6.5Shanghai Data Center Rules
- 07China Data Center Cooling Market, By Component
- 7.1Cooling Equipment for New Halls
- 7.2PUE Retrofit Projects
- 7.3Cooling Maintenance and Service
- 08China Data Center Cooling Market, By Cooling Approach
- 8.1Precision Air and Chilled-Water Cooling
- 8.2Indirect Evaporative and Free Cooling
- 8.3Cold-Plate Liquid Cooling
- 8.4Immersion Liquid Cooling
- 09China Data Center Cooling Market, By Data Center Type
- 9.1Hyperscale and Cloud Self-Build
- 9.2Telecom Operator IDC
- 9.3Third-Party Colocation and Wholesale
- 9.4Enterprise and Government
- 10China Data Center Cooling Market, By Rack Density
- 10.1Below 15 kW
- 10.215 to 40 kW
- 10.3Above 40 kW
- 11DC Exclusive: China Cooling Supplier Revenue Map
- 11.1Shenzhen Envicool Technology
- 11.2Guangdong Shenling Environmental Systems
- 11.3Guangzhou Goaland Energy Conservation Technology
- 11.4Sugon Shuchuang (Sugon Data Energy)
- 12China Data Center Cooling Market, By Region
- 12.1Yangtze River Delta
- 12.2Beijing-Tianjin-Hebei and North China
- 12.3Guangdong-Hong Kong-Macao Greater Bay Area
- 12.4Western Hub Provinces
- 12.5Chengdu-Chongqing and Central China
- 13China Data Center Cooling Market, By Province
- 13.1Guangdong
- 13.2Beijing
- 13.3Hebei (Zhangjiakou and Langfang)
- 13.4Shanghai
- 13.5Jiangsu
- 13.6Zhejiang
- 13.7Sichuan
- 13.8Inner Mongolia (Horinger)
- 13.9Guizhou (Gui'an)
- 13.10Chongqing
- 13.11Anhui (Wuhu)
- 13.12Ningxia (Zhongwei)
- 14Forecast Scenarios, 2035
- 14.1Low Scenario
- 14.2Base Scenario
- 14.3High Scenario
- 15Competitive Landscape
- 15.1Shenzhen Envicool Technology
- 15.2Huawei Digital Power
- 15.3Guangdong Shenling Environmental Systems
- 15.4Vertiv
- 15.5Sugon Shuchuang (Sugon Data Energy)
- 15.6Schneider Electric
- 15.7Gree Electric Appliances
- 15.8Midea Group (Midea Building Technologies)
- 15.9Daikin (McQuay)
- 15.10Johnson Controls
- 15.11Guangzhou Goaland Energy Conservation Technology
- 15.12Inspur Information
- 15.13Delta Electronics
- 15.14STULZ
- 15.15Trane Technologies
- 15.16Carrier
- 16Recent Developments
- 16.1Vertiv Asia Pacific Results, February 2026
- 16.2Envicool 2025 Results, April 2026
- 16.3Sugon Shuchuang 2025 Results, April 2026
- 16.4NEA Data Center Electricity, May 2026
- 16.5State Council Compute Release, July 2026
- 16.6Shenling Interim Results, August 2026
- 17Research Methodology
- 17.1Bottom-Up Model
- 17.2Bound Checks
- 17.3Data Sources
- Fig. 1China Data Center Cooling Market Size, 2020-2035 (USD Million)
- Table 1Executive Summary Attributes
- Table 2Scope of the China Data Center Cooling Market
- Table 3Cooling Price Points, 2020-2035
- Table 4Market by Component, 2025 and 2035
- Table 5Market by Cooling Approach, 2025 and 2035
- Table 6Market by Data Center Type, 2025 and 2035
- Table 7Market by Rack Density, 2025 and 2035
- Table 8China Cooling Supplier Revenue Map, 2025
- Table 9Top 12 Provinces, 2025 and 2035
- Table 10Forecast Scenarios, 2035
About this report
Written by Amit Jain and reviewed by Deepti Agrawal, Senior Editor, Research. Figures are built top-down and bottom-up and reconciled before publication, with 2025 as the base year.
Read our methodologyHow we built this
- Historical period2020-2024
- Base year2025
- Forecast period2026-2035
- Sizing approachTop-down + bottom-up
Need more than the report?
Advisory on this market
Due diligence, site selection and market entry work, by the analysts who wrote this report.
See consulting servicesFrequently asked questions
USD 4.26 billion in 2026, up 25.25% from USD 3.40 billion in 2025, according to DC Market Insights estimates. The market is projected to reach USD 10.67 billion by 2035, a CAGR of 12.11% from 2025.
12.11% a year from 2025 to 2035, after 19.22% a year from 2020 to 2025. Growth peaks at 25.25% in 2026 as 3,150 MW of new halls are fitted out and PUE retrofits reach 1,000 MW.
From 2026 Beijing charges data centers above PUE 1.35 an extra RMB 0.2 or 0.5 per kWh. For a 10 MW hall at PUE 1.60 that is about USD 6.8 million a year, so a USD 4.5 million cooling retrofit pays back in under a year.
Immersion liquid cooling, at 23.09% a year from USD 187.14 million in 2025 to USD 1.49 billion in 2035. Cold-plate liquid cooling grows 19.53% a year and overtakes air cooling by 2035.
USD 1.04 million of cooling equipment per MW of IT load in 2025, up from USD 0.85 million in 2020 and rising to USD 1.55 million by 2035 as liquid loops replace air handlers (DC Market Insights estimate).
The Yangtze River Delta, with USD 1.02 billion or 30% of 2025 spend. The Western Hub Provinces grow fastest at 18.56% a year, and Ningxia (Zhongwei) is the fastest province at 21.58%.
Guangdong, with USD 578.42 million in 2025, ahead of Beijing at USD 408.30 million and Hebei at USD 340.25 million. Guangdong is also home to Envicool and Shenling.
Shenzhen Envicool Technology sold RMB 3,448.48 million of room-level cooling in 2025, followed by Shenling, Goaland and Sugon Shuchuang; together these four disclosed USD 1.06 billion, 31.28% of the market. Huawei Digital Power and Vertiv also compete.
1.25 or lower for new and expanded large data centers and 1.2 at hub nodes, under the July 2024 Special Action Plan. The national average had to fall below 1.5 by end-2025; it was 1.42 in June 2025.
USD 4.26 billion for 2026 counts cooling equipment, PUE retrofits and maintenance only. Estimates that add containment, sensors and thermal software are about 10% higher; those counting only new-hall equipment are about 20% lower.
Get this report
How do I get the full report?
Request a quote; we reply by email within one business day.
How and when will I receive the report?
By email, within 24–48 business hours of payment.
How can I pay?
Once you accept the quote, we email you a secure payment link.
Can I see a sample first?
Yes. Request a free sample and we will email it to you.
Can the report be tailored to my needs?
Yes. We can add countries, segments or data cuts. Talk to an analyst about the scope you need.
Can I get an invoice or pay against a purchase order?
Write to sales@dcmarketinsights.com and our team will help.