
China Data Center Market Size, Share & Forecast to 2035
Market at a glance
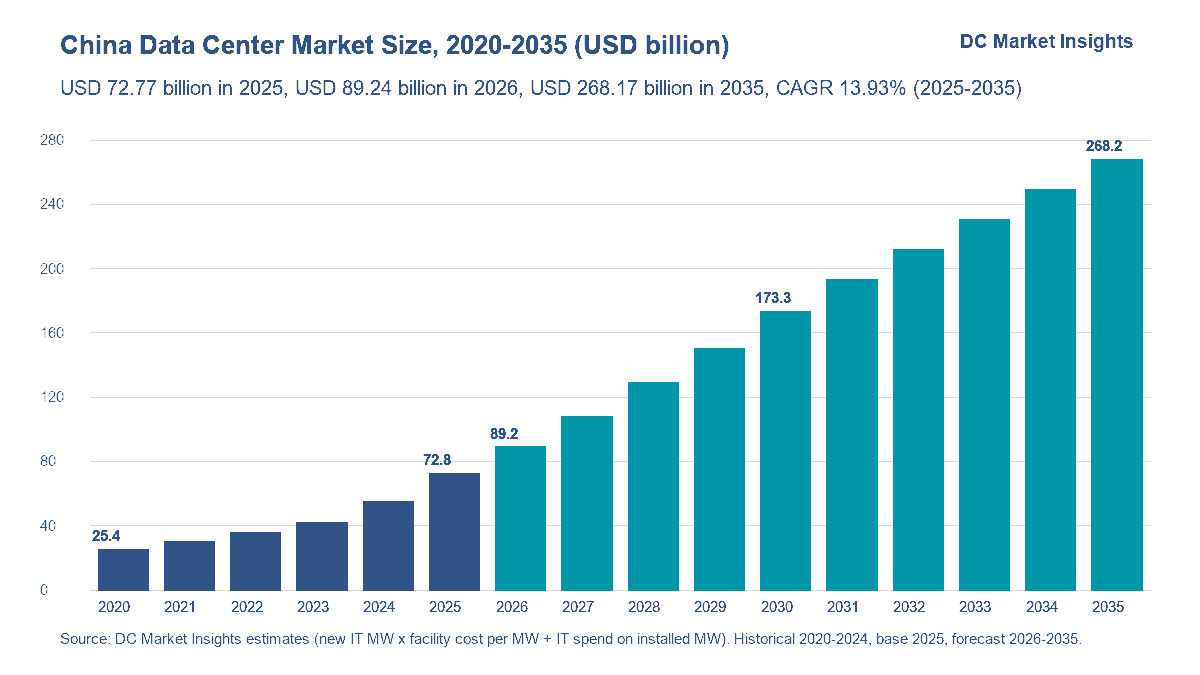
The China Data Center market was worth USD 72.77 billion in 2025 and is forecast to reach USD 268.17 billion by 2035, growing at a 13.93% CAGR.
 By Amit Jain, Senior Consultant, ICT & Emerging Technologies
 Reviewed by Deepti Agrawal
Last updated 26 Oct 2026
Base year 2025 PDF + Excel
Key findings
Alibaba's RMB 380 Billion Plan and Tencent's 176% Capex Jump
Telecom Operators Rebuild Their IDC Business Around Intelligent Computing
US Export Controls Limit the Supply of AI Accelerators
Liquid Cooling to Meet the 1.2 PUE Cap
What is inside the report
- 01Introduction
- 02Executive Summary
- 03Market Scope
- 04Why China Data Center Market Estimates Differ
- 05Market Drivers
- 06Market Trends
- 07Market Challenges
- 08Market Opportunities
- 09Pricing Analysis
- 10Standards and Regulation
- 21chapters
- 2020-2024Historical period
- 2026-2035Forecast period
- —Companies profiled
Segmentation
Recent developments
Alibaba Group announced at least RMB 380 billion of cloud and AI infrastructure investment over three years (Source: Alibaba Group).
the US government required a licence for NVIDIA H20 exports to China, leading to a USD 4.5 billion charge (Source: NVIDIA).
GDS Holdings' data center C-REIT started trading on the Shanghai Stock Exchange (Source: GDS Holdings).
China's legislature adopted the amended Cybersecurity Law, in force from 1 January 2026 (Source: National People's Congress Standing Committee).
the National Data Administration reported more than 13.73 million standard racks and 42 clusters of 10,000 or more cards at the end of 2025 (Source: NDA).
VNET Group passed 1 GW of wholesale capacity in service and won a 345 MW cloud order (Source: VNET Group).
Full analysis
The China Data Center Market is valued at USD 89.24 billion in 2026 and is projected to reach USD 268.17 billion by 2035, up from USD 72.77 billion in 2025, a CAGR of 13.93% from 2025 to 2035 (DC Market Insights estimate). China’s data center spending rises 22.62% in 2026 because racks in use jumped from 8.10 million at the end of 2023 to more than 13.73 million at the end of 2025, according to the National Data Administration (NDA), while the country’s intelligent computing reached 1.59 million PFLOPS (FP16) in 42 clusters of 10,000 or more accelerator cards. Beijing’s East Data West Computing programme decides where that money lands: the 8 national hub regions took more than 80% of new computing power in 2025 (Source: NDA), and a new hub project may not exceed a power usage effectiveness (PUE) of 1.2 under the July 2024 green data center action plan (Source: National Development and Reform Commission). The 2025 receipt is 2,600 MW of new IT capacity × USD 5.20 million of facility cost per MW = USD 13.52 billion of power, cooling and construction work, plus USD 29.48 billion of AI servers and USD 29.77 billion of conventional IT for about 18,481 MW already in service (DC Market Insights estimate). AI workloads grow fastest at 18.66% a year, and the Western Hub Provinces are the fastest region at 20.49% a year because Inner Mongolia and Ningxia sell data center power at about CNY 0.35-0.36 per kWh.
Key Market Statistics: How Big Is the China Data Center Market in 2026?
The China data center market is worth USD 89.24 billion in 2026, 22.62% more than the USD 72.77 billion of 2025, according to DC Market Insights.
- China data center market size 2025: USD 72.77 billion; 2026: USD 89.24 billion; 2030: USD 173.30 billion; 2035: USD 268.17 billion.
- CAGR 2025-2035: 13.93% in the base case, 9.82% in the low case and 17.24% in the high case.
- Racks in use: more than 13.73 million standard racks at the end of 2025 (Source: NDA), about 34.33 GW of rated capacity at 2.5 kW per rack.
- IT capacity in service: about 20.74 GW at the end of 2025, rising to about 63.88 GW by 2035 (DC Market Insights estimate).
- Largest component: IT infrastructure, 81.42% of 2025 value.
- Fastest workload: AI workloads, 18.66% a year, from 47.57% to 71.47% of value.
- Largest data center type: hyperscale and cloud self-build, 34.00% of 2025 value, also the fastest at 16.08% a year.
- Leading region: Yangtze River Delta, 30.00% of 2025 value; fastest region: Western Hub Provinces, 20.49% a year.
- Largest province: Guangdong with USD 12.37 billion in 2025; fastest large province: Inner Mongolia at 21.41% a year.
- Market leaders: the three state telecom operators (China Telecom, China Mobile and China Unicom) together hold the 27.00% Telecom Operator IDC segment (DC Market Insights estimate).
Key Takeaways: What Should Investors Know About China’s Data Center Build-Out?
Four facts frame the China data center market to 2035, each with its reason.
- Spending grows 13.93% a year because new IT capacity rises from 2,600 MW in 2025 to 4,900 MW a year by 2030 as AI clusters replace general-purpose halls.
- AI workloads take 71.47% of China data center value by 2035 because each AI MW carries about USD 23 million of servers in 2025 against USD 1.75 million a year for a conventional MW.
- The Western Hub Provinces’ share rises from 12.00% to 21.00% because hub rules withhold land and tax incentives from large projects outside the 8 hubs.
- Accelerator supply is the main forecast risk because US export rules decide which chips Chinese buyers can install; the low case of USD 185.66 billion for 2035 reflects slower AI capacity.
China Data Center Market Summary: How Much Did China Spend on Data Centers in 2025?
The China Data Center Market size was valued at USD 25.38 billion in 2020, reached USD 72.77 billion in 2025, and is anticipated to reach USD 268.17 billion by 2035, at a CAGR of 13.93% during the forecast period.
| Report Attribute | Details |
|---|---|
| Historical Period | 2020-2024 |
| Base Year | 2025 |
| Forecast Period | 2026-2035 |
| China Data Center Market Size 2025 | USD 72.77 billion |
| China Data Center Market Size 2026 | USD 89.24 billion |
| China Data Center Market, CAGR 2025-2035 | 13.93% |
| China Data Center Market Size 2035 | USD 268.17 billion |
The China data center market grew 23.45% a year from 2020 to 2025 as IT capacity in service rose from about 11.00 GW to about 20.74 GW and the AI share of new capacity climbed from 5% to 38%. DC Market Insights expects growth of 13.93% a year to 2035 as about 48.20 GW of new IT capacity comes online. China is the second-largest country in the global Data Center Market, and this page models it bottom-up from Chinese capacity data.
What Does the China Data Center Market Include?
The China data center market includes USD 72.77 billion of 2025 spending on the facilities and IT equipment of data centers located in mainland China.
Included
Servers, storage arrays and network equipment installed in Chinese data centers, including graphics processing unit (GPU) and domestic accelerator servers for artificial intelligence (AI), digital storage devices such as storage arrays used for big data analytics, micro and mobile (containerised) data centers, edge data centers, data center life cycle services that replace equipment (refresh and upgrade work), and on-site data center interconnect (DCI) optical equipment; uninterruptible power supplies (UPS), switchgear, transformers and power distribution; chillers, air handlers and liquid cooling; shell, core and fit-out construction. All owner types count: cloud and internet companies, the three state telecom operators, third-party colocation and wholesale operators, banks, government agencies and enterprise server rooms.
Excluded
Cloud service revenue (infrastructure as a service), bandwidth and telecom connectivity fees, software licences (including enterprise data management and data virtualization software), land purchases, long-haul fibre between cities, financing costs and the valuation of data center real estate investment trusts (REITs) are excluded, as are data centers in Hong Kong, Macao and Taiwan.
How the Segments Fit Together
Component is the spending view (IT infrastructure, power, cooling, construction); workload, data center type and end user are ownership and use views of the same USD 72.77 billion. Small edge sites are covered in more detail in the China Edge Data Center Market report, and the China Data Center Colocation Market report covers the rental revenue of colocation operators, a different measure from the build-out spending counted here.
Why Do China Data Center Market Estimates Differ?
China data center market estimates differ mainly because of scope: DC Market Insights counts USD 89.24 billion of 2026 spending on IT equipment and facilities, while narrower estimates count only rented capacity or internet data center (IDC) service revenue.
Broader definitions add cloud service revenue, bandwidth and software, which this China data center model leaves out to avoid counting the same server twice (once as equipment, once as a rented service). Narrower definitions count only colocation rent, which leaves out the 34.00% of value spent by hyperscale and cloud companies on their own campuses. Earlier editions of this page also used a smaller installed base before the NDA published the 13.73 million rack figure for the end of 2025. Buyers in scope include small and medium-sized enterprises (SMEs) with on-premise server rooms, provincial government clouds and state-owned banks.
| Element | In this report | Why |
|---|---|---|
| IT infrastructure (servers, storage, network) | Yes, USD 59.25 billion in 2025 | Largest spend line in Chinese data centers |
| Power, cooling and construction | Yes, USD 13.52 billion in 2025 | Facility cost of new capacity |
| Cloud service and IDC rental revenue | No | Revenue on the same assets, counted in the colocation report |
| Bandwidth, software, land | No | Not data center equipment or construction |
| Hong Kong, Macao and Taiwan | No | Separate country reports |
Market Drivers: Why Is China’s Data Center Spending Rising?
Three China-specific forces drive the China data center market from USD 72.77 billion in 2025 to USD 173.30 billion in 2030: hyperscaler capital spending, the rack build-out and the hub programme.
Alibaba’s RMB 380 Billion Plan and Tencent’s 176% Capex Jump
Alibaba Group said in February 2025 that it would invest at least RMB 380 billion over three years in cloud computing and AI infrastructure (Source: Alibaba Group), about USD 17.59 billion a year at CNY 7.20 per USD. Tencent’s capital expenditure was RMB 79.2 billion in 2025 and RMB 52.8 billion in the second quarter of 2026 alone, up 176% (Source: Tencent), while Alibaba spent RMB 67.68 billion in the June 2026 quarter (Source: Alibaba Group). These two groups fund most of the hyperscale and cloud self-build segment, 34.00% of China data center value in 2025 (DC Market Insights estimate).
Racks in Use Rose From 8.10 Million to 13.73 Million in Two Years
China had 8.10 million standard racks in use at the end of 2023 (Source: Cyberspace Administration of China), more than 9 million at the end of 2024 and more than 13.73 million at the end of 2025 (Source: NDA). At 2.5 kW per standard rack, 13.73 million racks equal about 34.33 GW of rated capacity; the China data center model counts about 20.74 GW of IT load in service, about 60% of that rating, in line with the 60% occupancy floor in the national plan.
East Data West Computing Sends Over 80% of New Computing Power to 8 Hubs
The National Development and Reform Commission (NDRC) approved 8 national hub regions and 10 data center clusters in 2022. By June 2024 the hubs had drawn more than CNY 43.5 billion of direct investment and more than CNY 200 billion of related investment, with more than 1.95 million racks at about 63% occupancy (Source: NDA, via the State Council portal at gov.cn). In 2025 the hubs took more than 80% of new computing power, so the China data center model sends 21.00% of 2035 value to the Western Hub Provinces, up from 12.00%.
Market Trends: How Is China’s Data Center Industry Changing?
Three trends reshape who builds China’s data centers, and they lift the third-party colocation and wholesale share of China data center value from 21.00% in 2025 to 23.00% by 2035 (DC Market Insights estimate).
Telecom Operators Rebuild Their IDC Business Around Intelligent Computing
China Mobile reported intelligent computing capacity of 112,700 PFLOPS (FP16) in the first half of 2026, with AI data center (AIDC) revenue up 486.1% and data center revenue of RMB 19.0 billion (Source: China Mobile). China Telecom reported nearly 8 GW of data center power capacity and 16 campuses at the 100 MW level (Source: China Telecom), and China Unicom more than 1.15 million standard cabinets at above 74% utilisation (Source: China Unicom).
Wholesale Campuses Pass 1 GW: VNET’s 345 MW Cloud Order
VNET Group’s wholesale capacity in service reached 1,007 MW at the end of June 2026, with 585 MW under construction and a 345 MW order from a leading cloud provider in the second quarter (Source: VNET Group filing). Cloud companies now rent whole campuses instead of building every hall themselves, which is why third-party colocation and wholesale grows 14.97% a year in the China data center model.
Data Center Assets Move Into China’s REIT Market
GDS Holdings’ data center C-REIT began trading on the Shanghai Stock Exchange on 8 August 2025 under fund code 508060, and GDS is preparing a second asset injection (Source: GDS Holdings). Recycling finished campuses into REITs frees capital for new builds; GDS raised its 2026 capital expenditure guidance to about RMB 10 billion (Source: GDS Holdings).
Market Challenges: What Slows Data Center Projects in China?
Two challenges cap the China data center market, and together they explain the gap between the USD 185.66 billion low case and the USD 268.17 billion base case for 2035.
US Export Controls Limit the Supply of AI Accelerators
US rules on advanced computing chips took effect in October 2022, were widened in November 2023 and extended to high-bandwidth memory on 2 December 2024 (Source: US Bureau of Industry and Security, Federal Register). On 9 April 2025 the US government required a licence for NVIDIA’s H20 chip, and NVIDIA recorded a USD 4.5 billion charge (Source: NVIDIA). Chinese buyers have shifted toward domestic accelerators, which is why the China data center model holds AI IT cost at USD 23 million per AI MW in 2025, below the global level.
PUE Caps, Occupancy Gates and Power Surcharges
The NDRC’s July 2024 action plan set an average PUE below 1.5 by the end of 2025, a cap of 1.25 for new large data centers and 1.2 for hub projects, and no new large projects in cities where data centers are less than 50% occupied (Source: NDRC). Beijing adds CNY 0.2 per kWh to the over-limit power of data centers above their PUE limit (Source: Beijing Municipal Government). These rules slow projects in eastern cities, where Beijing grows only 9.40% a year in the China data center model.
Market Opportunities: Where Can Suppliers Win in China’s Data Center Market?
The two largest openings in the China data center market are cooling for the PUE caps and campuses in the western hubs, which together rise from 15.72% to 24.47% of China data center value by 2035 before overlap (DC Market Insights estimate).
Liquid Cooling to Meet the 1.2 PUE Cap
Hyperscale facilities averaged a PUE of 1.34 at the end of 2025 (Source: NDA), above the 1.2 cap for hub projects. Cooling systems in China grow 13.15% a year to 2035 in the DC Market Insights model, as liquid cooling becomes standard in AI halls; the China Data Center Cooling Market report covers suppliers in detail.
Western Hub Campuses With Power at CNY 0.35 per kWh
Data centers in Hohhot buy power at about CNY 0.35 per kWh with more than 80% green power (Source: National Energy Administration), and Zhongwei targets CNY 0.36 per kWh backed by 2 GW of renewables (Source: Zhongwei Municipal Government). The Western Hub Provinces’ share of China data center value rises from 12.00% in 2025 to 21.00% by 2035 in the DC Market Insights model.
Pricing: How Much Does a Data Center MW Cost in China?
A new data center in China costs about USD 5.20 million per MW of IT capacity for building, power and cooling in 2025, rising to about USD 6.20 million by 2035, according to DC Market Insights.
| Year | Facility cost per new MW (USD million) | AI IT equipment per AI MW (USD million) | Conventional IT spend per installed MW a year (USD million) |
|---|---|---|---|
| 2020 | 4.60 | 20.00 | 1.55 |
| 2025 | 5.20 | 23.00 | 1.75 |
| 2030 | 5.70 | 20.75 | 1.85 |
| 2035 | 6.20 | 18.50 | 1.95 |
The facility cost splits 44% power, about 20% cooling and 36% construction in 2025. Power is the largest running cost of a China data center: the official demand charge for 1-10 kV two-part users from 1 August 2026 is CNY 52.0 per kW a month in Beijing against CNY 28.8 in Ningxia (Source: NDRC), a gap of CNY 23.2 per kW a month or about CNY 278 per kW a year.
| Province | Demand charge from 1 August 2026 (CNY per kW a month) |
|---|---|
| Beijing | 52.0 |
| Shanghai | 44.8 |
| Guangdong | 36.1 |
| Guizhou | 35.0 |
| Inner Mongolia West | 32.8 |
| Ningxia | 28.8 |
Standards and Regulation: Which Rules Apply to Data Centers in China?
Eight rules shape the China data center market, and the PUE caps alone apply to every new large project in the 8 hubs, which DC Market Insights values at USD 53.13 billion of 2025 spending.
- Data Security Law, in force 1 September 2021 (Source: National People’s Congress).
- Personal Information Protection Law (PIPL), in force 1 November 2021 (Source: National People’s Congress).
- Amended Cybersecurity Law, adopted 28 October 2025 and in force 1 January 2026 (Source: National People’s Congress Standing Committee).
- Provisions on Promoting and Regulating Cross-Border Data Flows, 22 March 2024: a security assessment is needed above 1 million people’s personal information, or 10,000 people’s sensitive information, sent abroad in a year (Source: Cyberspace Administration of China).
- Multi-Level Protection Scheme (MLPS 2.0) baseline standard GB/T 22239-2019, in force 1 December 2019 (Source: State Administration for Market Regulation).
- GB 40879-2021 mandatory data center energy efficiency standard, in force 1 November 2022 (Source: State Administration for Market Regulation).
- Special Action Plan for Green and Low-Carbon Development of Data Centers, July 2024: PUE caps of 1.25 and 1.2 and more than 80% green power for new hub data centers (Source: NDRC).
- Ministry of Industry and Information Technology (MIIT) pilot of 8 April 2024 removing foreign equity caps on IDC services in approved pilot areas (Source: MIIT).
Market Segmentation: Which China Data Center Market Segment Leads?
IT infrastructure leads the China data center market with 81.42% of 2025 value, while AI workloads grow fastest at 18.66% a year.
By Component
IT equipment leads because Chinese servers are refreshed across a 20.74 GW base every year; cooling grows faster than power (13.15% against 10.65%) as liquid cooling enters AI halls.
| Component | 2025 (USD million) | Share 2025 | 2035 (USD million) | CAGR 2025-2035 |
|---|---|---|---|---|
| IT Infrastructure | 59,254.43 | 81.42% | 230,973.16 | 14.57% |
| Power Solutions | 5,948.80 | 8.17% | 16,368.00 | 10.65% |
| Cooling Systems | 2,704.00 | 3.72% | 9,300.00 | 13.15% |
| General Construction | 4,867.20 | 6.69% | 11,532.00 | 9.01% |
By Workload
AI workloads in China already make up 47.57% of 2025 value and reach 71.47% by 2035.
| Workload | 2025 (USD million) | Share 2025 | 2035 (USD million) | CAGR 2025-2035 |
|---|---|---|---|---|
| AI Workloads | 34,622.07 | 47.57% | 191,675.77 | 18.66% |
| Conventional Workloads | 38,152.37 | 52.43% | 76,497.39 | 7.20% |
By Data Center Type
China’s hyperscale data center segment, the campuses that cloud and internet companies build for themselves, is the largest and fastest type at USD 24.74 billion in 2025 and 16.08% a year.
| Data Center Type | 2025 (USD million) | Share 2025 | 2035 (USD million) | CAGR 2025-2035 |
|---|---|---|---|---|
| Hyperscale and Cloud Self-Build | 24,743.31 | 34.00% | 109,951.00 | 16.08% |
| Telecom Operator IDC | 19,649.10 | 27.00% | 64,361.56 | 12.60% |
| Third-Party Colocation and Wholesale | 15,282.63 | 21.00% | 61,679.83 | 14.97% |
| Enterprise and Government | 13,099.40 | 18.00% | 32,180.78 | 9.40% |
By End User
Internet and cloud services buy 44.00% of China data center value; manufacturing grows fastest at 17.26% a year as factories add AI inspection and design workloads.
| End User | 2025 (USD million) | Share 2025 | 2035 (USD million) | CAGR 2025-2035 |
|---|---|---|---|---|
| Internet and Cloud Services | 32,020.75 | 44.00% | 128,723.12 | 14.93% |
| Telecom | 8,732.93 | 12.00% | 26,817.32 | 11.87% |
| BFSI | 9,460.68 | 13.00% | 29,499.05 | 12.04% |
| Government and Public Sector | 8,732.93 | 12.00% | 29,499.05 | 12.94% |
| Manufacturing | 6,549.70 | 9.00% | 32,180.78 | 17.26% |
| Others | 7,277.44 | 10.00% | 21,453.85 | 11.42% |
DC Exclusive: The East Data West Computing Hub Ledger, 8 Hubs, 10 Clusters and the Power-Price Gap
The East Data West Computing Hub Ledger is a DC Market Insights model built on 24 inputs (8 hub values for 2025 and 2035 from the provincial split, and 8 official power-price points), and it shows the 8 hubs holding USD 53.13 billion of China data center spending in 2025, 73.00% of the market, rising to USD 210.52 billion by 2035.
The four western hubs grow from USD 14.19 billion to USD 79.11 billion, 18.75% a year, while the four eastern hubs grow 12.93% a year. The difference follows the demand charge: CNY 28.8 to 35.0 per kW a month in the western hubs that publish it, against CNY 36.1 to 52.0 in the eastern ones.
| Hub | Clusters | East or West | 2025 (USD million) | 2035 (USD million) | CAGR 2025-2035 | Demand charge (CNY per kW a month) |
|---|---|---|---|---|---|---|
| Beijing-Tianjin-Hebei | Zhangjiakou | East | 7,277.44 | 29,499.05 | 15.02% | 52.0 (Beijing) |
| Yangtze River Delta | Eco-Green Integration Demonstration Zone; Wuhu | East | 19,285.23 | 64,361.56 | 12.81% | 44.8 (Shanghai) |
| Guangdong-Hong Kong-Macao Greater Bay Area | Shaoguan | East | 12,371.65 | 37,544.24 | 11.74% | 36.1 (Guangdong) |
| Chengdu-Chongqing | Tianfu; Chongqing | West | 5,458.08 | 22,794.72 | 15.37% | not published in the table read |
| Inner Mongolia | Horinger | West | 3,274.85 | 22,794.72 | 21.41% | 32.8 (Inner Mongolia West) |
| Guizhou | Gui’an | West | 2,910.98 | 14,749.52 | 17.62% | 35.0 (Guizhou) |
| Gansu | Qingyang | West | 1,091.61 | 6,704.33 | 19.90% | not published in the table read |
| Ningxia | Zhongwei | West | 1,455.49 | 12,067.79 | 23.56% | 28.8 (Ningxia) |
Gansu (Qingyang) is the smallest hub at USD 1.09 billion in 2025; Chengdu-Chongqing is the largest western hub at USD 5.46 billion. Hub values are DC Market Insights estimates from the provincial split; spending outside the hub provinces (for example Beijing city, Fujian or Hubei) makes up the rest of the market.
Regional Insights: Where Are China’s Data Centers?
The Yangtze River Delta leads the China data center market with USD 21.83 billion in 2025, 30.00% of value, and the Western Hub Provinces grow fastest at 20.49% a year. For vendors, the Western Hub Provinces are the most attractive region in China because their share of value rises from 12.00% to 21.00%, while the Yangtze River Delta stays the largest buyer.
| Region | 2025 (USD million) | Share 2025 | 2035 (USD million) | CAGR 2025-2035 |
|---|---|---|---|---|
| Beijing-Tianjin-Hebei and North China | 19,649.10 | 27.00% | 64,361.56 | 12.60% |
| Yangtze River Delta | 21,832.33 | 30.00% | 69,725.02 | 12.31% |
| Guangdong-Hong Kong-Macao Greater Bay Area | 13,827.14 | 19.00% | 42,907.71 | 11.99% |
| Chengdu-Chongqing and Central China | 8,732.93 | 12.00% | 34,862.51 | 14.85% |
| Western Hub Provinces | 8,732.93 | 12.00% | 56,316.36 | 20.49% |
Beijing-Tianjin-Hebei and North China
Beijing-Tianjin-Hebei and North China hold USD 19.65 billion of China data center value in 2025; growth shifts from Beijing city, where the PUE surcharge applies, to the Zhangjiakou cluster in Hebei at 15.02% a year.
Yangtze River Delta
The Yangtze River Delta spends USD 21.83 billion in 2025 across Shanghai, Jiangsu, Zhejiang and the Wuhu cluster in Anhui, which grows 22.11% a year as Shanghai’s demand charge of CNY 44.8 per kW a month pushes new halls inland.
Guangdong-Hong Kong-Macao Greater Bay Area
The Greater Bay Area holds USD 13.83 billion in 2025; Guangdong’s CNY 36.1 demand charge and the Shaoguan cluster keep it the largest single province at USD 12.37 billion.
Chengdu-Chongqing and Central China
Chengdu-Chongqing and Central China grow from USD 8.73 billion to USD 34.86 billion, 14.85% a year; central and western China already held 41% of computing facilities at the end of 2023 (Source: Cyberspace Administration of China).
Western Hub Provinces
The Western Hub Provinces (Inner Mongolia, Guizhou, Gansu and Ningxia) grow from USD 8.73 billion to USD 56.32 billion, 20.49% a year, on power at about CNY 0.35 per kWh in Hohhot and green power shares above 80%.
Province Analysis: Which Chinese Provinces Spend the Most on Data Centers?
Guangdong is the largest province in the China data center market with USD 12.37 billion in 2025, and Inner Mongolia is the fastest large province at 21.41% a year.
| Rank | Province | Region | 2025 (USD million) | Share 2025 | 2035 (USD million) | CAGR 2025-2035 |
|---|---|---|---|---|---|---|
| 1 | Guangdong | Guangdong-Hong Kong-Macao Greater Bay Area | 12,371.65 | 17.00% | 37,544.24 | 11.74% |
| 2 | Beijing | Beijing-Tianjin-Hebei and North China | 8,732.93 | 12.00% | 21,453.85 | 9.40% |
| 3 | Hebei (Zhangjiakou and Langfang) | Beijing-Tianjin-Hebei and North China | 7,277.44 | 10.00% | 29,499.05 | 15.02% |
| 4 | Shanghai | Yangtze River Delta | 6,913.57 | 9.50% | 20,112.99 | 11.27% |
| 5 | Jiangsu | Yangtze River Delta | 6,185.83 | 8.50% | 18,772.12 | 11.74% |
| 6 | Zhejiang | Yangtze River Delta | 4,730.34 | 6.50% | 14,749.52 | 12.04% |
| 7 | Sichuan | Chengdu-Chongqing and Central China | 3,274.85 | 4.50% | 13,408.66 | 15.14% |
| 8 | Inner Mongolia (Horinger) | Western Hub Provinces | 3,274.85 | 4.50% | 22,794.72 | 21.41% |
| 9 | Guizhou (Gui’an) | Western Hub Provinces | 2,910.98 | 4.00% | 14,749.52 | 17.62% |
| 10 | Chongqing | Chengdu-Chongqing and Central China | 2,183.23 | 3.00% | 9,386.06 | 15.70% |
| 11 | Anhui (Wuhu) | Yangtze River Delta | 1,455.49 | 2.00% | 10,726.93 | 22.11% |
| 12 | Ningxia (Zhongwei) | Western Hub Provinces | 1,455.49 | 2.00% | 12,067.79 | 23.56% |
Ningxia grows fastest of all at 23.56% a year from a small base of USD 1.46 billion; the 12 provinces hold 83.50% of 2025 value.
Forecast Scenarios: How Big Could the China Data Center Market Be in 2035?
The China data center market reaches USD 268.17 billion in 2035 in the base case, with a range of USD 185.66 billion to USD 357.00 billion.
| Scenario | 2035 (USD million) | CAGR 2025-2035 | Assumption from 2027 |
|---|---|---|---|
| Low Case | 185,656.35 | 9.82% | 30% less new IT capacity, AI share 8 points lower, unit costs 3% lower (tighter chip supply) |
| Base Case | 268,173.16 | 13.93% | 48.20 GW of new IT capacity in 2026-2035, AI share 64% by 2035 |
| High Case | 357,002.88 | 17.24% | 30% more new IT capacity, AI share 5 points higher, unit costs 3% higher |
Hyperscaler spending in 2026 points toward the high case: Alibaba’s and Tencent’s second-quarter capital expenditure together ran at about USD 66.93 billion a year, against the China data center model’s USD 89.24 billion for the whole market in 2026.
Key Players: Who Builds and Runs China’s Data Centers?
The three state telecom operators hold the 27.00% Telecom Operator IDC segment of the China data center market, and cloud and internet companies spend 34.00% on their own campuses (DC Market Insights estimate based on the data center type split).
- China Telecom
- China Mobile
- China Unicom
- Alibaba Group (Alibaba Cloud)
- Tencent
- ByteDance (Volcano Engine)
- Huawei Cloud
- Baidu AI Cloud
- GDS Holdings
- VNET Group
- Range Intelligent Computing
- Sinnet
- Athub
- Bridge Data Centres (Chindata)
- Princeton Digital Group
Company facts from filings: GDS Holdings had 684,977 square metres in service at 79.2% utilisation at the end of June 2026 (Source: GDS Holdings); VNET Group had 1,007 MW of wholesale capacity in service (Source: VNET Group); China Telecom Corporation Limited reported more than 118.8 EFLOPS of self-owned and accessed intelligent computing (Source: China Telecom); China Unicom’s computing revenue reached RMB 41.9 billion in the first half of 2026 (Source: China Unicom).
Recent Developments: What Changed in China’s Data Center Market Since 2025?
Six events since February 2025 moved the China data center market toward the USD 89.24 billion of 2026.
- In February 2025, Alibaba Group announced at least RMB 380 billion of cloud and AI infrastructure investment over three years (Source: Alibaba Group).
- In April 2025, the US government required a licence for NVIDIA H20 exports to China, leading to a USD 4.5 billion charge (Source: NVIDIA).
- In August 2025, GDS Holdings’ data center C-REIT started trading on the Shanghai Stock Exchange (Source: GDS Holdings).
- In October 2025, China’s legislature adopted the amended Cybersecurity Law, in force from 1 January 2026 (Source: National People’s Congress Standing Committee).
- In April 2026, the National Data Administration reported more than 13.73 million standard racks and 42 clusters of 10,000 or more cards at the end of 2025 (Source: NDA).
- In August 2026, VNET Group passed 1 GW of wholesale capacity in service and won a 345 MW cloud order (Source: VNET Group).
Methodology: How the Model Values the China Data Center Market
DC Market Insights values the China data center market bottom-up from 16 years of new IT capacity, an AI share and four unit costs, then checks the result against 3 bounds.
- New IT capacity: 1,400 MW in 2020, 2,600 MW in 2025, 3,100 MW in 2026, 4,900 MW in 2030 and 6,000 MW in 2035; about 20.74 GW in service at the end of 2025.
- AI share of new capacity: 5% in 2020, 38% in 2025, 58% in 2030 and 64% in 2035.
- Unit costs: facility USD 5.20 million per MW in 2025; AI IT USD 23 million per AI MW (USD 18.5 million by 2035) with a 20% yearly refresh; conventional IT USD 1.75 million per installed MW a year; CNY 7.20 per USD.
- Receipt: 2,600 MW × USD 5.20 million = USD 13.52 billion, plus USD 29.48 billion of AI IT and USD 29.77 billion of conventional IT = USD 72.77 billion.
- Bound 1 (ceiling): 20.74 GW in service is 60.4% of the 34.33 GW rating of 13.73 million standard racks, below full occupancy and close to the 60% national floor.
- Bound 2 (floor): Alibaba’s plan (about USD 17.59 billion a year) and Tencent’s 2025 capital expenditure (about USD 11.00 billion) add up to USD 28.59 billion, 39.29% of the 2025 model, leaving room for telecom operators, colocation and enterprises.
- Bound 3 (ceiling): China’s USD 72.77 billion is 12.77% of the USD 570.04 billion global 2025 total in the Data Center Market report, below China’s 17.88% share of the roughly 116 GW of IT capacity in service worldwide that the same report uses.
The full method is described on the research methodology page.
Table of contents
- 01Introduction
- 1.1Key Market Statistics, 2025, 2026, 2030 and 2035
- 1.2Key Takeaways
- 02Executive Summary
- 2.1Market Snapshot, 2025, 2026 and 2035
- 2.2Market Size Chart, 2020-2035
- 03Market Scope
- 3.1Included
- 3.2Excluded
- 3.3How the Segments Fit Together
- 04Why China Data Center Market Estimates Differ
- 4.1Scope Table: What Is In and Out of This Estimate
- 05Market Drivers
- 5.1Alibaba's RMB 380 Billion Plan and Tencent's 176% Capex Jump
- 5.2Racks in Use Rose From 8.10 Million to 13.73 Million
- 5.3East Data West Computing Sends Over 80% of New Computing Power to 8 Hubs
- 06Market Trends
- 6.1Telecom Operators Rebuild Their IDC Business Around Intelligent Computing
- 6.2Wholesale Campuses Pass 1 GW
- 6.3Data Center Assets Move Into China's REIT Market
- 07Market Challenges
- 7.1US Export Controls Limit the Supply of AI Accelerators
- 7.2PUE Caps, Occupancy Gates and Power Surcharges
- 08Market Opportunities
- 8.1Liquid Cooling to Meet the 1.2 PUE Cap
- 8.2Western Hub Campuses With Power at CNY 0.35 per kWh
- 09Pricing Analysis
- 9.1Facility and IT Cost per MW, 2020-2035
- 9.2Power Demand Charges by Province, 2026
- 10Standards and Regulation
- 10.1Data Security Law
- 10.2Personal Information Protection Law
- 10.3Amended Cybersecurity Law
- 10.4Cross-Border Data Flow Provisions
- 10.5MLPS 2.0 (GB/T 22239-2019)
- 10.6GB 40879-2021 Energy Efficiency Standard
- 10.7Green and Low-Carbon Data Center Action Plan
- 10.8MIIT Foreign Equity Pilot for IDC
- 11Market Segmentation by Component
- 11.1IT Infrastructure
- 11.2Power Solutions
- 11.3Cooling Systems
- 11.4General Construction
- 12Market Segmentation by Workload
- 12.1AI Workloads
- 12.2Conventional Workloads
- 13Market Segmentation by Data Center Type
- 13.1Hyperscale and Cloud Self-Build
- 13.2Telecom Operator IDC
- 13.3Third-Party Colocation and Wholesale
- 13.4Enterprise and Government
- 14Market Segmentation by End User
- 14.1Internet and Cloud Services
- 14.2Telecom
- 14.3BFSI
- 14.4Government and Public Sector
- 14.5Manufacturing
- 14.6Others
- 15DC Exclusive: East Data West Computing Hub Ledger
- 15.1Beijing-Tianjin-Hebei
- 15.2Yangtze River Delta
- 15.3Guangdong-Hong Kong-Macao Greater Bay Area
- 15.4Chengdu-Chongqing
- 15.5Inner Mongolia
- 15.6Guizhou
- 15.7Gansu
- 15.8Ningxia
- 16Regional Analysis
- 16.1Beijing-Tianjin-Hebei and North China
- 16.2Yangtze River Delta
- 16.3Guangdong-Hong Kong-Macao Greater Bay Area
- 16.4Chengdu-Chongqing and Central China
- 16.5Western Hub Provinces
- 17Province Analysis
- 17.1Guangdong
- 17.2Beijing
- 17.3Hebei (Zhangjiakou and Langfang)
- 17.4Shanghai
- 17.5Jiangsu
- 17.6Zhejiang
- 17.7Sichuan
- 17.8Inner Mongolia (Horinger)
- 17.9Guizhou (Gui'an)
- 17.10Chongqing
- 17.11Anhui (Wuhu)
- 17.12Ningxia (Zhongwei)
- 18Forecast Scenarios, 2035
- 18.1Low Case
- 18.2Base Case
- 18.3High Case
- 19Competitive Analysis
- 19.1China Telecom
- 19.2China Mobile
- 19.3China Unicom
- 19.4Alibaba Group (Alibaba Cloud)
- 19.5Tencent
- 19.6ByteDance (Volcano Engine)
- 19.7Huawei Cloud
- 19.8Baidu AI Cloud
- 19.9GDS Holdings
- 19.10VNET Group
- 19.11Range Intelligent Computing
- 19.12Sinnet
- 19.13Athub
- 19.14Bridge Data Centres (Chindata)
- 19.15Princeton Digital Group
- 19.16Telecom Operator and Self-Build Shares
- 20Recent Developments
- 20.1Alibaba Group, February 2025
- 20.2NVIDIA H20 Licence, April 2025
- 20.3GDS Holdings C-REIT, August 2025
- 20.4Cybersecurity Law Amendment, October 2025
- 20.5National Data Administration, April 2026
- 20.6VNET Group, August 2026
- 21Research Methodology
- 21.1Model Inputs
- 21.2Bound Checks
- Fig. 11. China Data Center Market Size, 2020-2035 (USD billion)
- Table 11. Market Snapshot, 2025, 2026 and 2035
- Table 22. Scope Table: What Is In and Out of This Estimate
- Table 33. Facility and IT Cost per MW, 2020-2035
- Table 44. Power Demand Charges by Province, 2026
- Table 55. Market by Component, 2025 and 2035
- Table 66. Market by Workload, 2025 and 2035
- Table 77. Market by Data Center Type, 2025 and 2035
- Table 88. Market by End User, 2025 and 2035
- Table 99. East Data West Computing Hub Ledger
- Table 1010. Market by Region, 2025 and 2035
- Table 1111. Top 12 Provinces, 2025 and 2035
- Table 1212. Forecast Scenarios, 2035
About this report
Written by Amit Jain and reviewed by Deepti Agrawal, Senior Editor, Research. Figures are built top-down and bottom-up and reconciled before publication, with 2025 as the base year.
Read our methodologyHow we built this
- Historical period2020-2024
- Base year2025
- Forecast period2026-2035
- Sizing approachTop-down + bottom-up
Need more than the report?
Advisory on this market
Due diligence, site selection and market entry work, by the analysts who wrote this report.
See consulting servicesFrequently asked questions
USD 89.24 billion in 2026, up 22.62% from USD 72.77 billion in 2025, according to DC Market Insights estimates. The market is projected to reach USD 268.17 billion by 2035, a CAGR of 13.93% from 2025.
13.93% a year from 2025 to 2035 in the base case, after 23.45% a year in 2020-2025. The low case gives 9.82% and the high case 17.24%, depending mainly on AI chip supply.
More than 13.73 million standard racks at the end of 2025, according to the National Data Administration, about 34.33 GW of rated capacity. DC Market Insights estimates about 20.74 GW of IT load in service.
USD 24.74 billion in 2025, 34.00% of the market, rising to USD 109.95 billion by 2035 at 16.08% a year. Alibaba, Tencent, ByteDance, Baidu and Huawei Cloud fund most of it.
USD 13.52 billion on power, cooling and construction in 2025, rising to USD 37.20 billion by 2035 (10.65% a year). IT equipment makes up the other 81.42% of 2025 value (DC Market Insights estimate).
A plan approved in 2022 with 8 national hub regions and 10 data center clusters. The hubs took more than 80% of new computing power in 2025, and the Western Hub Provinces grow 20.49% a year to 2035.
The Yangtze River Delta, with USD 21.83 billion or 30.00% of 2025 value. Guangdong is the largest province at USD 12.37 billion, and Inner Mongolia the fastest large province at 21.41% a year.
China Telecom, China Mobile and China Unicom hold the 27.00% telecom IDC segment; Alibaba and Tencent lead self-build; GDS Holdings and VNET Group lead third-party colocation, with VNET at 1,007 MW of wholesale capacity in service.
They limit AI accelerator supply: a licence became necessary for NVIDIA’s H20 in April 2025. DC Market Insights holds AI IT at USD 23 million per AI MW in 2025, and the low case gives USD 185.66 billion for 2035.
The Western Hub Provinces, whose share of China data center value rises from 12.00% in 2025 to 21.00% by 2035 at 20.49% a year. The Yangtze River Delta remains the largest buyer at 30.00% of 2025 value.
Scope. DC Market Insights counts USD 89.24 billion of 2026 spending on IT equipment and facilities; estimates counting only colocation rent or IDC service revenue are smaller, and those adding cloud revenue and bandwidth are larger.
Get this report
How do I get the full report?
Request a quote; we reply by email within one business day.
How and when will I receive the report?
By email, within 24–48 business hours of payment.
How can I pay?
Once you accept the quote, we email you a secure payment link.
Can I see a sample first?
Yes. Request a free sample and we will email it to you.
Can the report be tailored to my needs?
Yes. We can add countries, segments or data cuts. Talk to an analyst about the scope you need.
Can I get an invoice or pay against a purchase order?
Write to sales@dcmarketinsights.com and our team will help.