
Belgium Data Center Colocation Market Size, Share & Forecast to 2035
Market at a glance
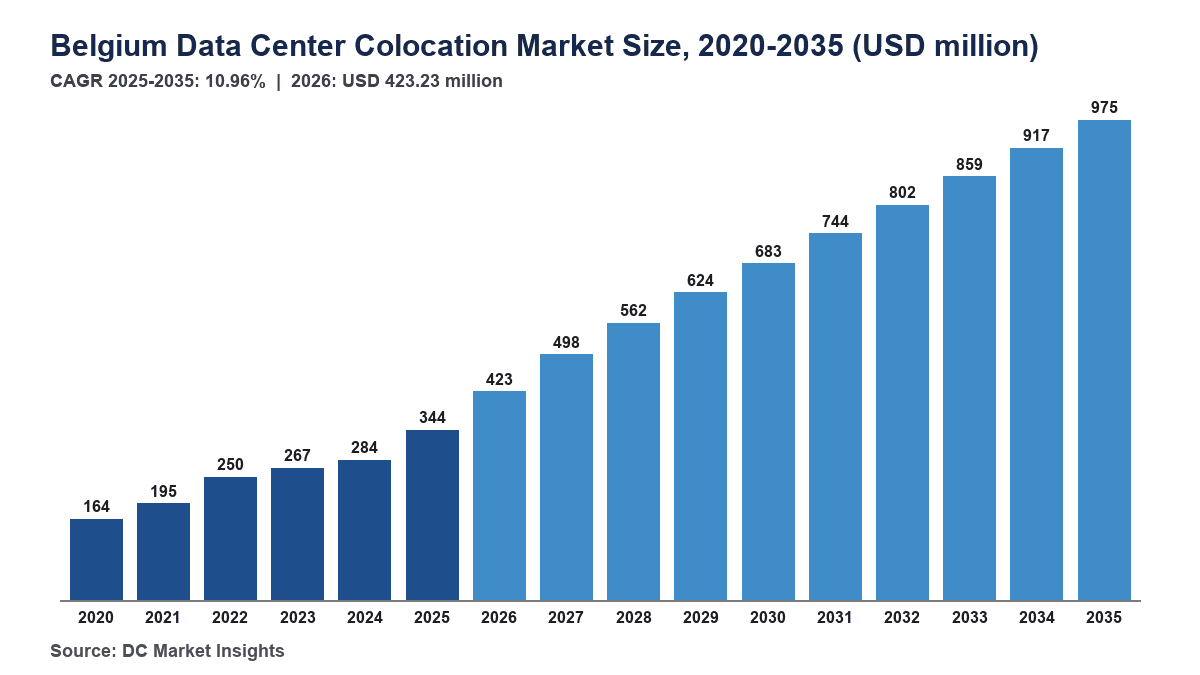
The Belgium Data Center Colocation market was worth USD 344.5 million in 2025 and is forecast to reach USD 974.6 million by 2035, growing at a 10.96% CAGR.
 By Amit Jain, Senior Consultant, ICT & Emerging Technologies
 Reviewed by Deepti Agrawal
Last updated 22 Oct 2026
Base year 2025 PDF + Excel
Key findings
Grid Rationing Makes Connected Halls Worth More: Elia's Capped Data-Centre Category
Liquid-Cooled Suites at KevlinX and EdgeConneX
A Connection Queue of More Than 180 Companies in Flanders
Wallonia's Grid Headroom: Gembloux and Liège
What is inside the report
- 01Introduction
- 02Research Methodology
- 03Executive Summary
- 04Market Dynamics
- 05Pricing Analysis
- 06Standards and Regulation
- 07Market Segmentation by Colocation Type
- 08Market Segmentation by Enterprise Size
- 09Market Segmentation by End User
- 10Market Segmentation by Rack Density
- 16chapters
- 2020-2024Historical period
- 2026-2035Forecast period
- 10Companies profiled
Segmentation
Companies profiled
- EdgeConneX: about 10% (DC Market Insights estimate); 16 MW at Ternat
- Penta Infra: about 5% (DC Market Insights estimate); 7.2 MW at Zellik
- AtlasEdge: about 3% (DC Market Insights estimate); Nossegem site
- NRB: Herstal data center for Walloon public and private clients
- Orange Belgium: Hoboken data center
- Proximus: anchor tenant of Datacenter United under a 10-year contract
- Cordiant Digital Infrastructure: 37.4% economic stake in Datacenter United
- TINC: 47.5% stake in Datacenter United
- Macquarie Capital and PMV: majority owners of KevlinX
- Google: EUR 5 billion Belgian self-build programme, outside this market
Recent developments
Datacenter United completed its purchase of Proximus's data centers at Evere, Mechelen and Machelen (Source: Datacenter United).
LCL Data Centers brought 3.4 MW of rooftop solar online on four farm roofs in East and West Flanders, as LCL and its partners reported.
Datacenter United signed a EUR 120 million five-year debt package (Source: Datacenter United).
Microsoft opened its Belgium Central cloud region (Source: Microsoft).
CREG amended the transmission connection code with "use it or lose it" rules (Source: CREG).
LCL Data Centers opened its largest data center at Diegem on a new 24 MW connection (Source: LCL).
Full analysis
The Belgium Data Center Colocation Market is valued at USD 423.23 million in 2026 and is projected to reach USD 974.61 million by 2035, up from USD 344.49 million in 2025, a CAGR of 10.96% from 2025 to 2035 (DC Market Insights estimate). In Belgium the scarce input is a grid connection, not land or buyers: Elia set up a separate data-centre connection category with a capped allocation in September 2025, and the Commission for Electricity and Gas Regulation (CREG) amended the transmission connection code on 29 January 2026 with binding deadlines and a “use it or lose it” rule for reserved capacity. That is why the operators that already hold power are the ones expanding: LCL Data Centers opened its largest site at Diegem in March 2026 on an extra 24 MW grid connection, and Datacenter United secured 17 MW more for Antwerp (Source: LCL; Cordiant Digital Infrastructure results, June 2026). Belgium Data Center Colocation covers the rent, power and services that third-party operators bill for space in shared Belgian data centers, and DC Market Insights builds it from capacity: 112.00 MW of average live colocation IT load in 2025, 78.00% of it sold, at about EUR 315 per kW per month for retail and EUR 175 for wholesale, all-in with power. Wholesale grows fastest at 16.09% a year as cloud and AI tenants take whole halls, and Wallonia is the fastest-growing region at 16.78% a year because its grid has more headroom than Flanders, where more than 180 companies wait for a connection.
Key Market Statistics: How Big Is the Belgium Data Center Colocation Market in 2026?
DC Market Insights values the Belgium data center colocation market at USD 423.23 million in 2026, 22.86% above 2025, as live colocation capacity rises from 122 MW to 150 MW with the Diegem and Neder-Over-Heembeek halls.
- Market size 2025: USD 344.49 million
- Market size 2026: USD 423.23 million
- Market size 2030: USD 683.09 million
- Market size 2035: USD 974.61 million
- CAGR 2025-2035: 10.96% (low case 8.51%, high case 13.19%)
- Largest segment: Retail Colocation, 69.32% of 2025 revenue (USD 238.81 million)
- Fastest segment: Wholesale Colocation, 16.09% a year; racks above 30 kW grow 26.52% a year
- Leading region: Brussels Metro, 55.00% of 2025 revenue; fastest-growing region: Wallonia, 16.78% a year
- Largest location: Diegem and Machelen, USD 68.92 million in 2025
- Market leader: Digital Realty, about 19% of 2025 revenue (DC Market Insights estimate)
Key Takeaways: What Should a Belgian Colocation Buyer Know Before Signing?
DC Market Insights draws four takeaways from a Belgium data center colocation market that grows from USD 344.49 million in 2025 to USD 974.61 million in 2035.
- Power already connected is the product: Belgian colocation halls with secured grid capacity price firm, because CREG’s January 2026 code change makes new reservations slower and conditional (Source: CREG).
- Electricity is about 44% of a retail bill: at EUR 0.194 per kWh in the first half of 2025, power for one sold kW costs about EUR 139 a month at 70% load (Source: Eurostat; DC Market Insights estimate).
- Belgian demand is broad, not only hyperscale: 61.62% of Belgian enterprises with 10 or more staff used paid cloud services in 2025 against 52.74% in the EU, because local banks, insurers and public bodies outsource early (Source: Eurostat).
- Ownership is consolidating: Datacenter United, now 14 data centers in 12 locations, earned EUR 41.3 million of pro forma revenue in 2025, about 13.55% of the market (Source: Cordiant Digital Infrastructure; DC Market Insights estimate).
Belgium Colocation Summary: What Did Belgian Colocation Earn in 2025?
Belgian colocation operators earned USD 344.49 million in 2025. The Belgium Data Center Colocation Market size was valued at USD 163.53 million in 2020, reached USD 344.49 million in 2025, and is anticipated to reach USD 974.61 million by 2035, at a CAGR of 10.96% during the forecast period. From 2020 to 2025 revenue grew 16.07% a year, helped by the 2022 energy-price spike that lifted all-in retail prices from about EUR 240 to EUR 330 per kW per month before they eased to EUR 315 in 2025.
| Report attribute | Details |
|---|---|
| Historical period | 2020-2024 |
| Base year | 2025 |
| Forecast period | 2026-2035 |
| Market size 2025 | USD 344.49 million |
| Market size 2026 | USD 423.23 million |
| CAGR 2025-2035 | 10.96% |
| Market size 2035 | USD 974.61 million |
| Segments covered | Colocation Type, Enterprise Size, End User, Rack Density |
| Regions covered | Brussels Metro, Antwerp Province, East and West Flanders, Limburg and Leuven, Wallonia; 12 locations |
Growth peaks at 22.86% in 2026 and 17.65% in 2027 as LCL’s Diegem hall, KevlinX’s Brussels campus and Datacenter United’s Antwerp expansion fill, then settles near 6.28% by 2035 as new capacity of about 19 MW a year meets a fuller grid. DC Market Insights estimates that Belgium holds about 1.8% of European colocation revenue in 2025; the European picture is in the Europe Data Center Colocation Market report.
What Does Belgium Data Center Colocation Cover, and Where Does It Stop?
Belgium Data Center Colocation covers USD 344.49 million of 2025 revenue that third-party operators billed for space, power and services in Belgian data centers, counted where the hall stands.
Included
- Retail colocation: racks, cages and suites up to about 1 MW per customer, billed per kW or per rack with power.
- Wholesale colocation: halls or suites above about 1 MW leased to one customer, including cloud and AI tenants.
- Interconnection and managed services: cross-connects, cloud on-ramps, remote hands and managed infrastructure sold by colocation operators.
Excluded
- Self-built hyperscale campuses such as Google’s Saint-Ghislain and Farciennes sites and Microsoft’s Belgium Central region.
- Cloud service revenue, managed hosting by IT firms outside colocation halls, and enterprise-owned data centers.
- Construction spend, which is counted in the Belgium Data Center Infrastructure Market report.
How the Segments Fit Together
Colocation type comes straight from the model (retail MW × retail price, wholesale MW × wholesale price, plus services at 13% of retail in 2025); enterprise size, end user and rack density each split the same total, so every dimension sums to USD 344.49 million in 2025 and USD 974.61 million in 2035. The boundary with the Belgium Data Center Market report is the owner: that report counts every Belgian data center including hyperscale self-builds, while this report counts only space sold by third-party operators.
Why Do Belgium Data Center Colocation Market Estimates Differ?
The USD 423.23 million DC Market Insights figure for 2026 counts only third-party colocation revenue in Belgium, so it sits below estimates that add hyperscale or cloud spend.
Broader definitions add Google’s self-built campuses, Microsoft’s Belgium Central region, cloud services sold from those regions, managed hosting and edge data centers run by telecom operators, and some count construction or equipment spend as “market” value. Those items can double or triple a headline figure because Google alone committed EUR 5 billion to Belgian AI and cloud infrastructure for 2026-2027, as Google announced in October 2025. This report leaves out hyperscale self-builds, cloud services, construction and IT equipment, and keeps small and medium enterprises (SMEs), public bodies, EU institutions and research users in scope when they rent space from a colocation operator.
| Element | In this report | Why |
|---|---|---|
| Retail and wholesale colocation rent with power | Yes, USD 313.44 million in 2025 | Core third-party revenue |
| Interconnection, cross-connects and remote hands | Yes, USD 31.05 million in 2025 | Billed by colocation operators |
| Hyperscale self-built campuses | No | No third-party revenue |
| Cloud services revenue | No | Service revenue, not space |
| Construction and equipment | No | Counted in the infrastructure report |
Market Drivers: Why Is Belgian Colocation Demand Rising?
Three Belgian drivers lift colocation revenue from USD 344.49 million in 2025 to USD 683.09 million in 2030, each tied to a named rule, deal or statistic.
Grid Rationing Makes Connected Halls Worth More: Elia’s Capped Data-Centre Category
Data-centre connection requests to Elia rose about nine-fold from 2022, and the capacity they reserve for 2034 is more than double the 8 TWh of data-centre use assumed in Belgium’s grid plans, as Reuters reported Elia’s figures in October 2025. Elia answered with a separate data-centre category with a maximum allocation and curtailable flexible connections in September 2025, and CREG added “use it or lose it” and reservation limits on 29 January 2026, according to CREG’s decision. DC Market Insights models live colocation capacity rising from 122 MW in 2025 to only 236 MW in 2030 for that reason, so utilisation climbs from 78% to 80% and wholesale prices hold near EUR 175 per kW per month.
Belgian Firms Already Buy Cloud: 61.62% of Enterprises in 2025
Eurostat recorded 61.62% of Belgian enterprises with 10 or more staff using paid cloud services in 2025, up from 51.69% in 2023 and nearly nine points above the EU’s 52.74% (Source: Eurostat). Those firms, along with banks, insurers and public bodies under the Belgian law transposing NIS2, want hybrid set-ups with a Belgian rack next to a cloud on-ramp, which is why Cloud and IT Service Providers grow 13.61% a year, from USD 103.36 million to USD 370.34 million.
Infrastructure Funds Buy the Telco Data Centers: EUR 128 Million for Proximus’s Sites
Datacenter United completed the purchase of Proximus’s data centers at Evere, Mechelen and Machelen on 3 March 2025, about 11 MW at an enterprise value of EUR 128 million with a 10-year contract that keeps Proximus as anchor tenant, as Datacenter United announced and trade press reported. Cordiant Digital Infrastructure paid EUR 92.3 million for 47.5% of the group in October 2024, and the group raised EUR 120 million of five-year debt on 30 September 2025, according to Datacenter United. Macquarie Capital, the Flemish investment company PMV and EPICo2 took majority control of KevlinX in September 2023 to build a 32 MW campus in Brussels (Source: Macquarie). That capital is why live colocation capacity rises by 28 MW in 2026 alone in the DC Market Insights model.
Market Trends: How Are Belgian Colocation Halls Changing?
Racks above 30 kW rise from 7% of Belgian colocation revenue in 2025 to 26.00% in 2035 by DC Market Insights estimates, the biggest design shift in the market.
Liquid-Cooled Suites at KevlinX and EdgeConneX
KevlinX reserves 13.5 MW of its Brussels campus for liquid cooling and fitted its first 4 MW in 2025, and EdgeConneX markets its 16 MW Ternat campus for more than 20 kW per cabinet, according to both companies. The Above 30 kW per Rack segment grows 26.52% a year from USD 24.11 million to USD 253.40 million, while racks up to 10 kW grow only 4.49% a year.
Telecom Operators Become Tenants, Not Owners
Proximus sold its data centers and stayed as a 10-year tenant, and Colt’s former Nossegem site now runs as AtlasEdge Brussels, as trade press reported. DC Market Insights counts this shift in Wholesale Colocation, which rises from 21.66% of 2025 revenue to 34.03% in 2035.
Hyperscale Regions Raise Interconnection Demand
Microsoft opened its Belgium Central cloud region on 18 November 2025 (Source: Microsoft), and Digital Realty’s Brussels campus is the only Belgian site with on-ramps to Azure, Amazon Web Services (AWS) and Google Cloud, according to Digital Realty. Interconnection and Managed Services grow 10.45% a year to USD 83.86 million by 2035 as enterprises link Belgian racks to those regions.
Market Challenges: What Holds Back Belgian Colocation?
Two constraints could cut 2035 Belgian colocation revenue to the USD 779.69 million low case: grid connection delays and high power prices.
A Connection Queue of More Than 180 Companies in Flanders
More than 180 companies were waiting for a grid connection in Flanders in 2025, and the Belgian Data Center Industry Association called the unpredictability of connections the only brake on growth when it forecast more than 260 MW of colocation and hyperscale IT load by the end of 2026, as trade press reported. The federal grid development plan for 2028-2038, expected around May 2027, is the next point at which data-centre demand gets firm transmission capacity. The DC Market Insights low case cuts new capacity by 25% from 2027, giving USD 779.69 million in 2035, a CAGR of 8.51%.
Power at EUR 0.19 per kWh Against an EU Average of EUR 0.184
Belgian non-household electricity in the 500-1,999 MWh band cost EUR 0.1940 per kWh excluding VAT in the first half of 2025 and EUR 0.1866 in the second half, against an EU average of EUR 0.1837 in the second half, according to Eurostat. At a power usage effectiveness (PUE) of 1.4, each EUR 0.01 per kWh adds about EUR 7.15 per sold kW per month at 70% load, roughly 2.3% of the retail price (DC Market Insights estimate), which pushes price-sensitive SMEs toward the public cloud.
Market Opportunities: Where Can Belgian Colocation Operators Win?
Two openings add about USD 344.48 million of combined revenue growth by 2035 in Belgian colocation, by DC Market Insights estimates.
Wallonia’s Grid Headroom: Gembloux and Liège
LCL bought the Gembloux data center from Engie Solutions and expanded its solar park there from 1 MW to 1.6 MW, according to LCL. DC Market Insights models Gembloux growing from USD 13.78 million in 2025 to USD 77.97 million in 2035, 18.92% a year, the fastest location, because Walloon sites face shorter queues than Flemish ones.
AI-Ready Suites for Belgian Research and Enterprise Users
Belgian universities, pharmaceutical firms and banks that will not send sensitive data abroad need 30-80 kW racks near Brussels, and Datacenter United is spending on AI-ready capacity at Machelen, Ghent, Oostkamp and Evere, according to Cordiant’s June 2026 results. Racks above 30 kW add USD 229.29 million of revenue between 2025 and 2035; the AI hall layer is covered in the Belgium AI Data Center Market report.
Pricing: How Much Does Colocation Cost per kW in Belgium?
Belgian retail colocation cost about USD 355.95 (EUR 315) per kW per month all-in with power in 2025, and wholesale about USD 197.75 (EUR 175) per kW per month, by DC Market Insights estimates.
| Year | Retail (EUR per kW per month) | Wholesale (EUR per kW per month) | Retail (USD per kW per month) | Wholesale (USD per kW per month) |
|---|---|---|---|---|
| 2020 | 240 | 130 | 274.08 | 148.46 |
| 2025 | 315 | 175 | 355.95 | 197.75 |
| 2030 | 318 | 175 | 365.70 | 201.25 |
| 2035 | 325 | 178 | 373.75 | 204.70 |
Public anchors support those prices. Datacenter United’s EUR 41.3 million of pro forma 2025 revenue on about 13 MW of IT capacity equals about EUR 265 per installed kW per month, which at 80% sold is about EUR 331 per sold kW, close to the retail estimate (Source: Cordiant Digital Infrastructure). Power for one sold kW at 70% load and a PUE of 1.4 costs about EUR 139 a month at Eurostat’s 2025 price, so space, cooling and services make up the rest. Across all Belgian colocation, revenue per average live MW was about EUR 2.72 million in 2025.
Standards and Regulation: Which Belgian Rules Apply to a Colocation Hall?
Five sets of rules shape the USD 423.23 million Belgian colocation market in 2026, led by grid connection and energy reporting rules.
- Energy Efficiency Directive (EU) 2023/1791, Article 12, and Delegated Regulation (EU) 2024/1364: every data center of 500 kW or more reports energy, water, PUE and waste heat each year to a European database; the Walloon portal set the first report for 15 September 2024 and later reports by 15 May (Source: EUR-Lex; Public Service of Wallonia).
- Transmission connection code: CREG’s amendment of 29 January 2026 adds binding deadlines, filters for non-serious requests and “use it or lose it” for reserved capacity; Elia’s data-centre category caps allocation (Source: CREG; Elia).
- The Belgian NIS2 law of 26 April 2024, in force since 18 October 2024, puts data center service providers in scope with the Centre for Cybersecurity Belgium (CCB) as authority; digital-sector entities had to register by 18 December 2024 (Source: Centre for Cybersecurity Belgium).
- The General Data Protection Regulation (GDPR) and the Belgian Data Protection Authority push public bodies and health users toward Belgian or EU-based hosting.
- Facility standards: EN 50600 for data center design and operation, ISO/IEC 27001 for security and ISO 50001 for energy management, which tender documents from Belgian public bodies typically ask for.
Market Segmentation: Which Colocation Type Earns the Most in Belgium?
Retail Colocation earns the most, 69.32% of 2025 revenue or USD 238.81 million, while Wholesale Colocation grows fastest at 16.09% a year.
By Colocation Type
Belgium is still a retail market because most halls are under 20 MW and serve many enterprise tenants; wholesale rises to 34.03% of revenue by 2035 as KevlinX, LCL Diegem and Datacenter United Antwerp lease suites above 1 MW.
| Colocation Type | 2025 (USD million) | Share 2025 | 2035 (USD million) | CAGR 2025-2035 |
|---|---|---|---|---|
| Retail Colocation | 238.81 | 69.32% | 559.05 | 8.88% |
| Wholesale Colocation | 74.63 | 21.66% | 331.70 | 16.09% |
| Interconnection and Managed Services | 31.05 | 9.01% | 83.86 | 10.45% |
By Enterprise Size
Large Enterprises hold 71% of 2025 revenue; SMEs grow slightly faster, 11.34% a year, because Belgian SMEs buy racks through managed service partners in regional halls such as Aalst, Hasselt and Gembloux.
| Enterprise Size | 2025 (USD million) | Share 2025 | 2035 (USD million) | CAGR 2025-2035 |
|---|---|---|---|---|
| Large Enterprises | 244.59 | 71.00% | 682.23 | 10.80% |
| Small and Medium Enterprises | 99.90 | 29.00% | 292.38 | 11.34% |
By End User
Cloud and IT Service Providers lead with 30% in 2025 and reach 38.00% by 2035; Banking, Financial Services and Insurance (BFSI) keeps 17% in 2025, reflecting Brussels’ banking and clearing firms.
| End User | 2025 (USD million) | Share 2025 | 2035 (USD million) | CAGR 2025-2035 |
|---|---|---|---|---|
| Cloud and IT Service Providers | 103.36 | 30.00% | 370.34 | 13.61% |
| BFSI | 58.56 | 17.00% | 136.45 | 8.83% |
| Telecom and Media | 48.23 | 14.00% | 107.21 | 8.32% |
| Government and EU Institutions | 41.34 | 12.00% | 116.95 | 10.96% |
| Manufacturing and Logistics | 34.45 | 10.00% | 87.72 | 9.80% |
| Healthcare and Life Sciences | 24.11 | 7.00% | 77.97 | 12.45% |
| Energy and Utilities | 17.22 | 5.00% | 48.73 | 10.96% |
| Others | 17.22 | 5.00% | 29.24 | 5.43% |
By Rack Density
Racks up to 10 kW still earn 62% of 2025 revenue, but 10 to 30 kW racks become the largest band before 2035 with USD 389.84 million.
| Rack Density | 2025 (USD million) | Share 2025 | 2035 (USD million) | CAGR 2025-2035 |
|---|---|---|---|---|
| Up to 10 kW per Rack | 213.59 | 62.00% | 331.37 | 4.49% |
| 10 to 30 kW per Rack | 106.79 | 31.00% | 389.84 | 13.82% |
| Above 30 kW per Rack | 24.11 | 7.00% | 253.40 | 26.52% |
DC Exclusive: The Belgian Colocation Capacity Ledger, 8 Operator Groups and About 122 MW Live
DC Market Insights tracks about 122 MW of live colocation IT capacity in Belgium at the end of 2025 across 8 operator groups, with at least 70 MW more secured or under construction. This DC Market Insights model uses 14 inputs: each operator’s published MW, site list and expansion, from company releases, filings and directories, reconciled to the 2025 market model.
| Operator | Main Belgian sites | Live IT MW end-2025 (estimate) | Secured or under way | Basis |
|---|---|---|---|---|
| Digital Realty | Zaventem BRU1-BRU4 | 28 | Campus build-out | BRU1 7.2 MW, BRU4 13.6 MW published |
| LCL Data Centers | Diegem, Aalst, Beersel, Antwerp, Gembloux | 20 | +24 MW grid connection at Diegem (opened Mar 2026) | LCL release, Oct 2023 |
| EdgeConneX | Ternat | 16 | – | Operator campus page |
| Datacenter United | 14 sites incl. Evere, Machelen, Mechelen, Antwerp, Ghent, Oostkamp, Hasselt | 13 | +17 MW power at Antwerp | Cordiant results, Jun 2026 |
| Penta Infra | Zellik | 7.2 | Scalable to about 13 MW | Operator figure, Jun 2024 |
| KevlinX | Neder-Over-Heembeek (Brussels) | 4 | 17.5 MW shell, 32 MW build-out | Macquarie release, Sep 2023 |
| AtlasEdge | Nossegem (ex-Colt) | 4 | – | DC Market Insights estimate |
| Others (NRB, Orange Belgium, about 11 smaller operators) | Herstal, Hoboken and regional sites | 30 | – | DC Market Insights estimate |
The three largest groups hold about 64 MW, 52% of live capacity, and the secured additions of about 70 MW at Diegem, Antwerp, Zellik and KevlinX equal the 2026-2028 capacity growth in the base case, so the DC Market Insights forecast does not rely on any campus that has no grid connection yet.
Regional Insights: Which Belgian Region Leads Colocation Revenue?
Brussels Metro leads with 55.00% of 2025 revenue, USD 189.48 million, and Wallonia grows fastest at 16.78% a year.
| Region | 2025 (USD million) | Share 2025 | 2035 (USD million) | CAGR 2025-2035 |
|---|---|---|---|---|
| Brussels Metro | 189.48 | 55.00% | 458.07 | 9.23% |
| Antwerp Province | 58.56 | 17.00% | 175.43 | 11.60% |
| East and West Flanders | 41.34 | 12.00% | 126.70 | 11.85% |
| Limburg and Leuven | 24.11 | 7.00% | 68.22 | 10.96% |
| Wallonia | 31.00 | 9.00% | 146.19 | 16.78% |
Brussels Metro
The Brussels area, including Diegem, Machelen, Zaventem, Nossegem, Ternat, Zellik and Beersel on the Flemish side of the border, earns USD 189.48 million in 2025 because EU institutions, NATO suppliers, banks and the Digital Realty cloud on-ramps sit there; it grows 9.23% a year, slower than the rest as its grid fills.
Antwerp Province
Antwerp and Mechelen earn USD 58.56 million in 2025, serving port, chemicals and logistics firms, and grow 11.60% a year as Datacenter United adds 17 MW of power in Antwerp.
East and West Flanders
Ghent, Aalst, Bruges and Oostkamp earn USD 41.34 million in 2025 and grow 11.85% a year, led by LCL’s 2,367 m2 Aalst extension and Datacenter United’s AI-ready work at Ghent and Oostkamp.
Limburg and Leuven
Hasselt and Leuven earn USD 24.11 million in 2025, with Datacenter United’s two Hasselt facilities serving Limburg firms and KU Leuven-linked research users; growth is 10.96% a year.
Wallonia
Wallonia earns USD 31.00 million in 2025 and grows 16.78% a year to USD 146.19 million, the fastest region, as Gembloux and Liège take tenants that cannot get power in Flanders; Google’s Saint-Ghislain and Farciennes campuses stay outside this market as self-builds.
Location Analysis: Which Belgian Locations Earn the Most Colocation Revenue?
Diegem and Machelen earn the most, USD 68.92 million in 2025, and Gembloux grows fastest at 18.92% a year.
| Rank | Location | Region | 2025 (USD million) | 2035 (USD million) | CAGR 2025-2035 |
|---|---|---|---|---|---|
| 1 | Diegem and Machelen | Brussels Metro | 68.92 | 155.94 | 8.51% |
| 2 | Zaventem and Nossegem | Brussels Metro | 48.23 | 116.95 | 9.26% |
| 3 | Ternat, Zellik and Beersel | Brussels Metro | 37.89 | 87.72 | 8.76% |
| 4 | Antwerp City and Port | Antwerp Province | 37.89 | 116.95 | 11.93% |
| 5 | Brussels-Capital Region | Brussels Metro | 34.45 | 97.46 | 10.96% |
| 6 | Hasselt and Leuven | Limburg and Leuven | 24.11 | 68.22 | 10.96% |
| 7 | Mechelen | Antwerp Province | 20.67 | 58.48 | 10.96% |
| 8 | Ghent | East and West Flanders | 17.22 | 58.48 | 13.00% |
| 9 | Liège and Herstal | Wallonia | 17.22 | 68.22 | 14.76% |
| 10 | Aalst | East and West Flanders | 13.78 | 38.98 | 10.96% |
| 11 | Gembloux | Wallonia | 13.78 | 77.97 | 18.92% |
| 12 | Bruges and Oostkamp | East and West Flanders | 10.33 | 29.24 | 10.96% |
The four Brussels Metro locations hold 55% of 2025 revenue. Antwerp City and Port grows 11.93% a year to USD 116.95 million, the largest gain outside Brussels, and Liège and Herstal reach USD 68.22 million by 2035.
Forecast Scenarios: How Could Belgian Colocation Revenue Look in 2035?
The Belgium Data Center Colocation Market reaches USD 974.61 million in 2035 in the base case, within a range of USD 779.69 million to USD 1.19 billion.
| Scenario | 2035 size | CAGR 2025-2035 | Assumption from 2027 |
|---|---|---|---|
| Low | USD 779.69 million | 8.51% | New colocation capacity 25% lower as grid connections slip past the 2028-2038 federal grid plan |
| Base | USD 974.61 million | 10.96% | Live capacity 150 MW (2026), 236 MW (2030), 330 MW (2035); prices flat in real terms |
| High | USD 1.19 billion | 13.19% | KevlinX and Diegem fully fitted by 2028, a new Walloon campus of about 40 MW, prices 5% higher |
The swing factor is the timing of firm grid capacity: each year of delay for about 20 MW of new halls removes roughly USD 55 million of annual revenue at 2030 prices.
Competitive Insights: Who Leads Belgian Data Center Colocation?
The top three Belgian colocation operators, Digital Realty, LCL Data Centers and Datacenter United, hold about 48% of 2025 revenue by DC Market Insights estimates, measured by live IT MW and published revenue.
- Digital Realty: about 19% of 2025 revenue (DC Market Insights estimate); Brussels campus BRU1-BRU4 at Zaventem, BRU4 13.6 MW
- LCL Data Centers: about 16% (DC Market Insights estimate); EUR 120 million investment plan, Diegem opened March 2026 (Source: LCL)
- Datacenter United: about 13.55% (DC Market Insights estimate from EUR 41.3 million pro forma revenue); 14 sites (Source: Cordiant Digital Infrastructure)
- EdgeConneX: about 10% (DC Market Insights estimate); 16 MW at Ternat
- Penta Infra: about 5% (DC Market Insights estimate); 7.2 MW at Zellik
- KevlinX: about 3% (DC Market Insights estimate); 32 MW campus in Brussels (Source: Macquarie)
- AtlasEdge: about 3% (DC Market Insights estimate); Nossegem site
- NRB: Herstal data center for Walloon public and private clients
- Orange Belgium: Hoboken data center
- Proximus: anchor tenant of Datacenter United under a 10-year contract
- Cordiant Digital Infrastructure: 37.4% economic stake in Datacenter United
- TINC: 47.5% stake in Datacenter United
- Macquarie Capital and PMV: majority owners of KevlinX
- Microsoft: Belgium Central cloud region, a tenant and interconnection partner rather than a colocation seller
- Google: EUR 5 billion Belgian self-build programme, outside this market
The top three leave about 52% to more than 15 smaller operators, so the Belgian market is less concentrated than Amsterdam or Frankfurt; DC Market Insights expects it to stay that way because no single owner holds enough grid capacity to dominate.
Recent Developments: What Changed in Belgian Colocation Since 2025?
Six dated events between March 2025 and March 2026 moved about 35 MW of Belgian colocation capacity to new owners or onto new power, and changed the grid rules.
- In March 2025, Datacenter United completed its purchase of Proximus’s data centers at Evere, Mechelen and Machelen (Source: Datacenter United).
- In May 2025, LCL Data Centers brought 3.4 MW of rooftop solar online on four farm roofs in East and West Flanders, as LCL and its partners reported.
- In September 2025, Datacenter United signed a EUR 120 million five-year debt package (Source: Datacenter United).
- In November 2025, Microsoft opened its Belgium Central cloud region (Source: Microsoft).
- In January 2026, CREG amended the transmission connection code with “use it or lose it” rules (Source: CREG).
- In March 2026, LCL Data Centers opened its largest data center at Diegem on a new 24 MW connection (Source: LCL).
Methodology: How DC Market Insights Built the Belgian Colocation Model
DC Market Insights built the Belgium Data Center Colocation Market from 16 yearly capacity cohorts (2020-2035), 8 operator groups and 2 price ladders, with every split summing to the total.
The 2025 receipt: 112.00 MW average live capacity × 78% sold = 87.36 MW; 55.91 retail MW × EUR 315 × 12 months = USD 238.81 million, 31.45 wholesale MW × EUR 175 × 12 = USD 74.63 million, and interconnection and managed services at 13% of retail = USD 31.05 million, for USD 344.49 million at USD 1.13 per euro. Three bound checks:
- Ceiling 1: modelled live colocation capacity of 150 MW at the end of 2026 is below the industry association’s forecast of more than 260 MW of colocation plus hyperscale IT load for the same date.
- Ceiling 2: modelled revenue per average live MW of EUR 2.72 million in 2025 is below Datacenter United’s EUR 3.18 million (EUR 41.3 million on about 13 MW), as expected for a market with more wholesale space.
- Floor: published live capacity of five named operators (Digital Realty BRU1 and BRU4 20.8 MW, EdgeConneX 16 MW, Datacenter United 13 MW, Penta Infra 7.2 MW, KevlinX 4 MW) is 61 MW, half of the 122 MW in the model.
Prices are converted at USD 1.13 per euro for 2025 and USD 1.15 from 2026. The full method is on the research methodology page.
Table of contents
- 01Introduction
- 1.1Market Definition and Scope
- 1.2Included and Excluded Elements
- 1.3How the Segments Fit Together
- 1.4Why Belgium Data Center Colocation Market Estimates Differ
- 02Research Methodology
- 2.1Bottom-Up Model: Live MW × Utilisation × Price per kW
- 2.2Bound Checks
- 2.3Source Ledger
- 03Executive Summary
- 3.1Market Snapshot, 2025, 2026 and 2035
- 3.2Key Market Statistics
- 3.3Key Takeaways
- 04Market Dynamics
- 4.1Driver: Elia's Capped Data-Centre Category
- 4.2Driver: Cloud Use by 61.62% of Belgian Enterprises
- 4.3Driver: Infrastructure Funds Buy Telco Data Centers
- 4.4Trend: Liquid-Cooled Suites at KevlinX and EdgeConneX
- 4.5Trend: Telecom Operators Become Tenants
- 4.6Trend: Hyperscale Regions Raise Interconnection Demand
- 4.7Challenge: Connection Queue in Flanders
- 4.8Challenge: Power Prices
- 4.9Opportunity: Wallonia's Grid Headroom
- 4.10Opportunity: AI-Ready Suites
- 05Pricing Analysis
- 5.1Retail and Wholesale Price per kW, 2020-2035
- 5.2Public Price Anchors
- 06Standards and Regulation
- 6.1Energy Efficiency Directive Article 12 and Delegated Regulation 2024/1364
- 6.2CREG Transmission Connection Code
- 6.3Belgian NIS2 Law
- 6.4GDPR
- 6.5EN 50600, ISO/IEC 27001 and ISO 50001
- 07Market Segmentation by Colocation Type
- 7.1Retail Colocation
- 7.2Wholesale Colocation
- 7.3Interconnection and Managed Services
- 08Market Segmentation by Enterprise Size
- 8.1Large Enterprises
- 8.2Small and Medium Enterprises
- 09Market Segmentation by End User
- 9.1Cloud and IT Service Providers
- 9.2BFSI
- 9.3Telecom and Media
- 9.4Government and EU Institutions
- 9.5Manufacturing and Logistics
- 9.6Healthcare and Life Sciences
- 9.7Energy and Utilities
- 9.8Others
- 10Market Segmentation by Rack Density
- 10.1Up to 10 kW per Rack
- 10.210 to 30 kW per Rack
- 10.3Above 30 kW per Rack
- 11DC Exclusive: The Belgian Colocation Capacity Ledger
- 11.18 Operator Groups, About 122 MW Live
- 11.2About 70 MW Secured or Under Way
- 12Regional Analysis
- 12.1Brussels Metro
- 12.2Antwerp Province
- 12.3East and West Flanders
- 12.4Limburg and Leuven
- 12.5Wallonia
- 13Location Analysis
- 13.1Diegem and Machelen
- 13.2Zaventem and Nossegem
- 13.3Ternat, Zellik and Beersel
- 13.4Antwerp City and Port
- 13.5Brussels-Capital Region
- 13.6Hasselt and Leuven
- 13.7Mechelen
- 13.8Ghent
- 13.9Liège and Herstal
- 13.10Aalst
- 13.11Gembloux
- 13.12Bruges and Oostkamp
- 14Forecast Scenarios
- 14.1Low Case
- 14.2Base Case
- 14.3High Case
- 15Competitive Insights
- 15.1Digital Realty
- 15.2LCL Data Centers
- 15.3Datacenter United
- 15.4EdgeConneX
- 15.5Penta Infra
- 15.6KevlinX
- 15.7AtlasEdge
- 15.8NRB
- 15.9Orange Belgium
- 15.10Proximus
- 15.11Cordiant Digital Infrastructure
- 15.12TINC
- 15.13Macquarie Capital and PMV
- 15.14Microsoft
- 15.15Google
- 15.16Market Concentration
- 16Recent Developments
- 16.1March 2025 to March 2026
- Fig. 11. Belgium Data Center Colocation Market Size, 2020-2035 (USD million)
- Table 11. Report Attributes
- Table 22. Scope Comparison
- Table 33. Colocation Price per kW, 2020-2035
- Table 44. Market by Colocation Type, 2025 and 2035
- Table 55. Market by Enterprise Size, 2025 and 2035
- Table 66. Market by End User, 2025 and 2035
- Table 77. Market by Rack Density, 2025 and 2035
- Table 88. Belgian Colocation Capacity Ledger
- Table 99. Market by Region, 2025 and 2035
- Table 1010. Top 12 Locations, 2025 and 2035
- Table 1111. Forecast Scenarios, 2035
About this report
Written by Amit Jain and reviewed by Deepti Agrawal, Senior Editor, Research. Figures are built top-down and bottom-up and reconciled before publication, with 2025 as the base year.
Read our methodologyHow we built this
- Historical period2020-2024
- Base year2025
- Forecast period2026-2035
- Sizing approachTop-down + bottom-up
Need more than the report?
Advisory on this market
Due diligence, site selection and market entry work, by the analysts who wrote this report.
See consulting servicesFrequently asked questions
USD 423.23 million in 2026, up 22.86% from USD 344.49 million in 2025, according to DC Market Insights estimates. The market is projected to reach USD 974.61 million by 2035, a CAGR of 10.96% from 2025.
10.96% a year from 2025 to 2035, after 16.07% a year in 2020-2025, because capacity additions slow to about 19 MW a year as Elia caps data-centre grid allocations.
About EUR 315 per kW per month for retail and EUR 175 for wholesale in 2025, all-in with power (DC Market Insights estimate). Power alone is about EUR 139 per sold kW at EUR 0.194 per kWh.
Wholesale Colocation, at 16.09% a year from USD 74.63 million in 2025 to USD 331.70 million in 2035, as cloud and AI tenants lease suites above 1 MW.
Wallonia, at 16.78% a year to USD 146.19 million by 2035, because Gembloux and Liège have more grid headroom than Flanders, where over 180 companies wait for connections.
Digital Realty, LCL Data Centers and Datacenter United hold about 48% of 2025 revenue (DC Market Insights estimate). EdgeConneX, Penta Infra, KevlinX and AtlasEdge follow.
About 122 MW of live colocation IT capacity at the end of 2025 and 150 MW by the end of 2026, by DC Market Insights estimates, with about 70 MW more secured at Diegem, Antwerp, Zellik and Brussels.
Since 29 January 2026, CREG’s connection code adds binding deadlines and ‘use it or lose it’ for reserved capacity, and Elia caps a separate data-centre category, so halls with power already connected gain pricing power.
USD 344.49 million in 2025 counts only space sold by third-party operators. The Belgium data center market also counts hyperscale self-builds such as Google’s Saint-Ghislain campus and enterprise data centers.
USD 423.23 million in 2026 is the DC Market Insights figure for third-party colocation only. Estimates that add Google’s and Microsoft’s self-built capacity, cloud services or construction spend are several times larger.
Get this report
How do I get the full report?
Request a quote; we reply by email within one business day.
How and when will I receive the report?
By email, within 24–48 business hours of payment.
How can I pay?
Once you accept the quote, we email you a secure payment link.
Can I see a sample first?
Yes. Request a free sample and we will email it to you.
Can the report be tailored to my needs?
Yes. We can add countries, segments or data cuts. Talk to an analyst about the scope you need.
Can I get an invoice or pay against a purchase order?
Write to sales@dcmarketinsights.com and our team will help.