
Containerized Data Center Market Size, Share & Forecast to 2035
Market at a glance
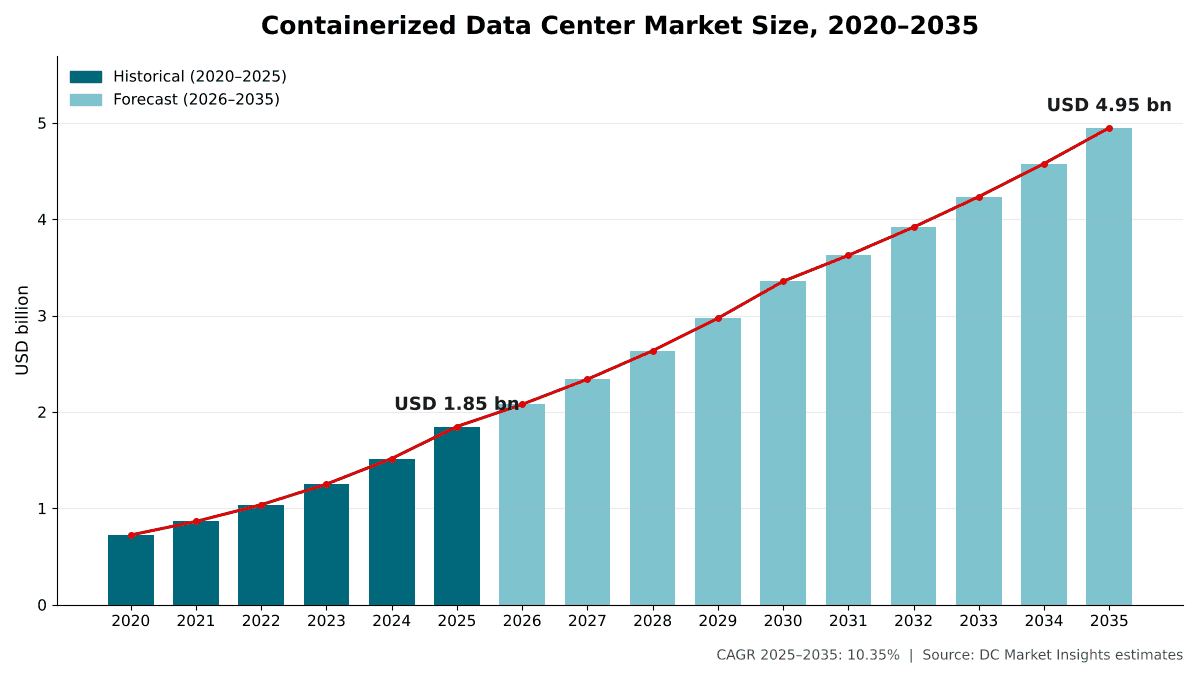
The Containerized Data Center market was worth USD 1,850.0 million in 2025 and is forecast to reach USD 4,950.0 million by 2035, growing at a 10.35% CAGR. North America accounts for 40.2% of the market.
 By Satyabrat Rajawat, Senior Research Analyst, Strategic Advisory
 Reviewed by Deepti Agrawal
Last updated 6 Oct 2026
Base year 2025 PDF + Excel
Reviewed by Deepti Agrawal
Last updated 6 Oct 2026
Base year 2025 PDF + Excel
Source: DC Market Insights analysis
Key findings
AI Containers Reach 1.2 MW and 576 GPUs, Lifting Custom Systems to 13.50% Growth
Liquid Cooling Lifts Rack Density Inside the Box
Container Dimensions Cap Power per Unit
AI and HPC Containers Reach USD 1.69 billion by 2035
What is inside the report
- 01Introduction
- 02Research Methodology
- 03Executive Summary
- 04Market Dynamics
- 05Pricing Analysis
- 06Standards and Regulation
- 07Supply Chain Analysis
- 08Containerized Data Center Market Size and Forecast
- 09Market by Container Size
- 10Market by Component
- 21chapters
- 2020-2024Historical period
- 2026-2035Forecast period
- 11Companies profiled
Regional insights
- North America40.2%
- Asia Pacific29.5%
- Europe17.6%
- Middle East and Africa7.1%
- Latin America5.6%
Segmentation
Companies profiled
- Huawei
- Vertiv
- Schneider Electric
- Hewlett Packard Enterprise (HPE)
- Delta Electronics
- ZTE
- LG CNS
- Crusoe
- Armada
- Bridge DC
- Duos Edge AI
Recent developments
HPE introduced the AI Mod POD, a container-based AI data center in which each module supports up to 1.5 MW, with a PUE of under 1.1 (Source: Data Center Dynamics news report).
Crusoe introduced Crusoe Spark, a turnkey prefabricated modular AI factory with units delivered as fast as three months (Source: Crusoe press release).
ZTE launched an AI data center prefabricated container that supports 40 kW liquid-cooled AI racks with a PUE of 1.15 (Source: Data Center Dynamics news report).
LG CNS announced its AI Box, which houses up to 576 GPUs and 1.2 MW of IT power in a single container (Source: The Investor news report).
Armada raised USD 230.00 million in Series B funding and said it plans to open Galleon Forge One, a plant of up to 400,000 square feet, in partnership with Johnson Controls, that will initially produce its megawatt-scale Leviathan modular data center (Source: Data Center Dynamics news report).
Bridge DC launched PowerCore 5.0, a power module built within a 40 ft ISO container frame and fully assembled and tested off-site (Source: Data Center Dynamics news report).
Full analysis
The Containerized Data Center Market covers data center capacity that is built, wired and tested inside a shipping-container frame in a factory and delivered to site as a finished unit: all-in-one IT containers with racks, power and cooling, separate power and cooling containers, custom and multi-container systems, and the integration and commissioning services sold with them. DC Market Insights values the global Containerized Data Center Market at USD 1.85 billion in 2025 and forecasts USD 4.95 billion by 2035, a CAGR of 10.35%. The 2025 value is built from units and prices: about 1,950 20-foot containers at an average of about USD 210,000 give USD 409.50 million, about 1,600 40-foot containers at about USD 560,000 give USD 896.00 million, and about 330 custom and multi-container systems at about USD 1.65 million each add USD 542.85 million. Containers for racks above 50 kW are the fastest-growing segment at 18.99% a year because AI and liquid-cooled edge deployments now fit a full graphics processing unit (GPU) pod into one box, and the Middle East and Africa is the fastest-growing region at 13.00% a year as energy, defense and sovereign cloud buyers need capacity at remote and fast-track sites.
Executive Summary
The Global Containerized Data Center Market size was valued at USD 722.84 million in 2020, reached USD 1.85 billion in 2025, and is anticipated to reach USD 4.95 billion by 2035, at a CAGR of 10.35% during the forecast period.
| Report attribute | Details |
|---|---|
| Historical Period | 2020-2024 |
| Base Year | 2025 |
| Forecast Period | 2026-2035 |
| Containerized Data Center Market Size 2025 | USD 1.85 Billion |
| Containerized Data Center Market, CAGR | 10.35% |
| Containerized Data Center Market Size 2035 | USD 4.95 Billion |
The market grew at 20.66% a year between 2020 and 2025, and 2025 alone added 21.9% over 2024. DC Market Insights attributes most of that growth to two shifts: container shipments rose from about 2,435 units in 2020 to about 3,880 in 2025, and the average container price rose from about USD 296,900 to about USD 476,400 as buyers moved from low-density edge boxes to liquid-cooled AI containers and megawatt-scale custom systems. Growth slows to 10.35% a year from 2025 to 2035 because large AI campuses increasingly buy prefabricated data halls and skids instead of containers, while container volumes still rise to about 7,035 units a year by 2035.
Market Scope: What Does the Containerized Data Center Market Cover?
The Containerized Data Center Market covers data center units built inside an ISO-style shipping-container frame, or a set of linked container frames, that are assembled and tested in a factory and shipped as a finished product, valued at first sale in current US dollars with 2025 as the base year. DC Market Insights sizes it at USD 1.85 billion in 2025.
Included. All-in-one IT containers with racks, power distribution, uninterruptible power supply (UPS), cooling, fire suppression and monitoring; power containers that house transformers, switchgear and UPS; cooling containers such as chiller and coolant distribution units; custom and multi-container systems of up to several megawatts; and the design, integration, commissioning and maintenance services sold with the containers. The value of the power and cooling equipment fitted in the factory is counted as part of the container.
Excluded. Servers, storage, network gear and GPUs installed in the container, prefabricated modular data halls and open skids that do not use a container frame, conventional site-built data centers, land, foundations, grid connections and on-site generation. The wider prefabricated market, including data halls and skids, is covered in the Modular Data Center Market report, where ISO containerized modules are one form factor.
How the segments fit together. The container size, component, rack density, application and end-user splits each re-cut the same USD 1.85 billion total. Size classes are counted in units times average price; the other splits are value shares applied to that total.
Market Drivers: What Drives the Containerized Data Center Market?
Three drivers add USD 3.10 billion of annual Containerized Data Center Market spending between 2025 and 2035 in the DC Market Insights model. They are AI containers that now carry more than 1 MW of IT load, edge operators that need capacity in Tier 2 to Tier 4 towns, and buyers who will pay a premium to cut a two-year build to a few months.
AI Containers Reach 1.2 MW and 576 GPUs, Lifting Custom Systems to 13.50% Growth
LG CNS describes its AI Box as a modular micro data center designed to house up to 576 GPUs with an IT power capacity of 1.2 megawatts in a single container. Hewlett Packard Enterprise (HPE) launched its AI Mod POD as a fully integrated, container-based AI data center in which each module supports up to 1.5 MW, with a power usage effectiveness (PUE) of under 1.1. Units of this size are a different product from the small edge containers that defined the category a few years ago: in 2019, Vertiv’s SmartMod held up to twelve server racks and up to 90 kW of power capacity. DC Market Insights estimates that custom and multi-container systems sold for about USD 1.65 million each in 2025 and grow from USD 542.85 million to USD 1.93 billion by 2035, a CAGR of 13.50%, the fastest of the three size classes.
Edge Operators Push Containers into Tier 2 to Tier 4 Towns at 10.97% a Year
Edge computing is the largest application for containers, worth USD 580.38 million in 2025. Duos Technologies states in its annual report for fiscal 2025 that it is deploying modular, rapidly deployable Edge Data Centers intended to bring enterprise-grade computing capacity closer to end users, in Tier 2 to Tier 4 and underserved markets (Source: Duos Technologies Form 10-K filed with the US Securities and Exchange Commission). Its Abilene, Texas unit is a containerized facility rated at 100 kW per rack, following modules in Amarillo, Victoria, Waco, Dumas and Corpus Christi. Crusoe says it has more than 400 modular units already deployed globally. In the DC Market Insights model, edge computing container spend reaches USD 1.64 billion in 2035. The Edge Computing Market report covers the services and platforms that run on this capacity.
Factory Builds Cut Delivery from About Two Years to Months
Speed to power is the reason buyers pay for factory integration. LG CNS says its AI Box can be deployed in about six months, compared with roughly two years required to build a traditional data center. ZTE estimates that delivery of its AI data center prefabricated container can be completed in as little as seven months, and Crusoe says its Spark units can be delivered as fast as three months. Builders are adding factory capacity to hold these lead times, as Armada’s planned Galleon Forge One plant shows. Demand for capacity keeps that premium in place: the International Energy Agency (IEA) estimates that data centres used around 415 TWh of electricity in 2024, about 1.5% of world consumption, and expects consumption to more than double to around 945 TWh by 2030. DC Market Insights models average container prices rising from about USD 476,400 in 2025 to about USD 703,400 in 2035.
Market Trends: How Is Containerized Data Center Design Changing?
Containerized data center design is moving from low-density boxes toward liquid-cooled AI units and dedicated power and cooling containers, and DC Market Insights expects racks above 50 kW to rise from 18.3% to 38.9% of market value by 2035.
Liquid Cooling Lifts Rack Density Inside the Box
ZTE’s AI data center prefabricated container supports 8 kW air-cooled general computing cabinets or 40 kW liquid-cooled AI computing racks, with a PUE of 1.15 from chilled water, aisle separation and cold plate liquid cooling with free cooling. Duos rates its Abilene container at 100 kW per rack. Containers for racks above 50 kW were worth USD 338.25 million in 2025 and reach USD 1.93 billion by 2035, a CAGR of 18.99%, while containers for racks up to 20 kW grow only 2.54% a year.
Power and Cooling Move into Their Own Containers
Suppliers now ship the power train as a container in its own right. Bridge DC says its PowerCore 5.0 is built within a 40 ft ISO container frame and integrates transformers, power distribution, UPS, cooling, fire suppression and monitoring systems into a single module, fully assembled and tested off-site. Huawei showed its containerized FusionPower9000, which combines power, cooling and control systems. Power containers grow from USD 445.45 million in 2025 to USD 1.37 billion by 2035 (11.86% a year) and cooling containers from USD 243.98 million to USD 846.22 million (13.24% a year).
Venture Capital Funds Container Factories
Armada has raised USD 230.00 million in Series B funding, bringing its total funding to nearly USD 500.00 million, after an earlier USD 131.00 million round to scale production of Leviathan, a modular megawatt-scale data center. Armada plans to open Galleon Forge One, a plant of up to 400,000 square feet, in partnership with Johnson Controls, and will initially produce Leviathan there. Data Center Dynamics describes Armada’s containerized data centers as designed to operate in challenging environments and able to be custom-configured with CPUs, GPUs and XPUs.
Market Challenges: What Holds the Containerized Data Center Market Back?
Fixed container dimensions and stricter safety certification are the two constraints that hold 20-foot containers to 6.67% annual growth, the slowest size class in the Containerized Data Center Market.
Container Dimensions Cap Power per Unit
The ISO 668 standard establishes a classification of series 1 freight containers based on external dimensions and specifies the associated ratings. A container that must ship by road, rail and sea has a fixed footprint, so heavier power and cooling plant for AI racks either needs a second container or a non-standard frame. DC Market Insights expects the 20-foot share of market value to fall from 22.2% in 2025 to 15.8% in 2035 for this reason.
Certification Requirements Are Tightening
UL Solutions (UL) withdrew the second edition of UL 2755, the Outline of Investigation for Modular Data Centers, because its evaluation requirements were outdated, no longer adequately addressed current safety concerns and did not align with current installation code requirements, and published a third edition in 2025.
Cryptocurrency Mining Demand Is Cyclical
The International Association of Electrical Inspectors (IAEI) describes crypto mining modular data centers as shipping-type containers that incorporate power distribution equipment to power racks of crypto-mining servers. DC Market Insights values cryptocurrency mining at USD 275.40 million, or 14.9% of 2025 value, and expects the slowest growth of any application, 5.16% a year, because DC Market Insights assumes mining spend follows coin prices and that some miners convert sites to AI hosting.
Market Opportunities: Where Are the New Revenue Pools?
AI and high-performance computing (HPC) containers are the largest new revenue pool in the Containerized Data Center Market, adding USD 1.27 billion of annual spend by 2035. Defense and energy sites that need capacity in harsh conditions and Middle East buyers growing at 13.00% a year follow.
AI and HPC Containers Reach USD 1.69 billion by 2035
AI and HPC applications were worth USD 417.73 million in 2025 and reach USD 1.69 billion by 2035, a CAGR of 14.98%, overtaking edge computing as the largest application. Cloud and AI providers are the fastest-growing buyer group at 13.65% a year.
Defense and Energy Sites Need Harsh-Environment Units
Armada lists Aramco, Aker BP, TampNet and the US Navy among its customers. Government and defense buyers spent USD 317.92 million on containerized data centers in 2025 and reach USD 762.09 million by 2035, while energy and resources companies grow from USD 234.74 million to USD 554.25 million. Mobile and very small units at the edge of this range are covered in the Micro-mobile Data Center Market report.
Saudi Arabia and the United Arab Emirates Lead Gulf Demand
Saudi Arabia accounts for USD 44.36 million of containerized data center spending in 2025 and the United Arab Emirates for USD 33.27 million in the DC Market Insights model, the only two countries from the region in the global top 12.
Pricing: How Much Does a Containerized Data Center Cost?
A containerized data center sold for an average of about USD 476,400 in 2025, ranging from about USD 210,000 for a 20-foot unit to about USD 1.65 million for a custom or multi-container system. These are DC Market Insights estimates covering the container, the power and cooling equipment fitted in the factory and the services sold with it, excluding IT equipment, land and site works.
| Pricing indicator | 2020 | 2025 | 2030 | 2035 |
|---|---|---|---|---|
| 20-foot container (USD thousand) | 168 | 210 | 238 | 256 |
| 40-foot container (USD thousand) | 410 | 560 | 655 | 735 |
| Custom and multi-container system (USD million) | 1.28 | 1.65 | 1.90 | 2.06 |
| Average across all units (USD thousand) | 297 | 476 | 609 | 703 |
| Units shipped | 2,435 | 3,880 | 5,510 | 7,035 |
The average price rose about 9.9% a year between 2020 and 2025 as liquid cooling, higher-rated UPS and megawatt-scale systems entered the mix, and DC Market Insights expects it to rise about 4.0% a year after 2025 as the mix keeps shifting toward AI units while factory volumes grow.
Standards and Regulation: Which Rules Apply to Containerized Data Centers?
Three sets of rules decide how a containerized data center is built, certified and installed: ISO 668 for the container frame, UL 2755 for the data center unit and Article 646 of the US National Electrical Code (NEC) for installation.
ISO 668:2020. The International Organization for Standardization (ISO) standard ISO 668:2020 establishes a classification of series 1 freight containers based on external dimensions and specifies the associated ratings.
UL 2755. UL Solutions certifies modular data centers to UL 2755, and the current edition, UL 2755:2025, replaced UL 2755:2018.
NEC Article 646. UL 2755 is referenced in Article 646 of NFPA 70, the National Electrical Code. NEC 646.4 requires all modular data centers to be listed (certified) and labeled, and field-installed electrical connections must still comply with the rest of the code.
Market Segmentation: Which Segment Leads the Containerized Data Center Market?
40-foot containers lead the Containerized Data Center Market with 48.5% of 2025 value, IT containers lead components with 46.8%, and racks up to 20 kW still lead rack density with 47.5%. Containers for racks above 50 kW are the fastest-growing segment at 18.99% a year, against 11.61% for 20 kW to 50 kW and 2.54% for up to 20 kW, because AI and liquid-cooled edge buyers now order containers built around GPU racks.
By Container Size: 40-Foot Units Lead with 48.5%
| Container size | 2025 (USD billion) | Share 2025 | 2035 (USD billion) | CAGR 2025-2035 |
|---|---|---|---|---|
| 20-Foot Containers | 0.41 | 22.2% | 0.78 | 6.67% |
| 40-Foot Containers | 0.90 | 48.5% | 2.24 | 9.60% |
| Custom and Multi-Container Systems | 0.54 | 29.4% | 1.93 | 13.50% |
DC Market Insights attributes the 40-foot lead to the room these units offer for a full row of racks with in-row cooling. Custom and multi-container systems gain 9.5 points of share by 2035 as AI buyers move to megawatt-scale units.
By Component: IT Containers Lead with 46.8%
| Component | 2025 (USD billion) | Share 2025 | 2035 (USD billion) | CAGR 2025-2035 |
|---|---|---|---|---|
| IT Containers | 0.87 | 46.8% | 2.02 | 8.87% |
| Power Containers | 0.45 | 24.1% | 1.37 | 11.86% |
| Cooling Containers | 0.24 | 13.2% | 0.85 | 13.24% |
| Integration and Services | 0.29 | 15.9% | 0.71 | 9.26% |
IT containers lose 5.9 points of share by 2035 as larger deployments split power and cooling into dedicated containers next to the IT units.
By Rack Density: Up to 20 kW Leads with 47.5%
| Rack density | 2025 (USD billion) | Share 2025 | 2035 (USD billion) | CAGR 2025-2035 |
|---|---|---|---|---|
| Up to 20 kW | 0.88 | 47.5% | 1.13 | 2.54% |
| 20 kW to 50 kW | 0.63 | 34.2% | 1.90 | 11.61% |
| Above 50 kW | 0.34 | 18.3% | 1.93 | 18.99% |
By Application: Edge Computing Leads with 31.4%
| Application | 2025 (USD billion) | Share 2025 | 2035 (USD billion) | CAGR 2025-2035 |
|---|---|---|---|---|
| Edge Computing | 0.58 | 31.4% | 1.64 | 10.97% |
| AI and HPC | 0.42 | 22.6% | 1.69 | 14.98% |
| Disaster Recovery and Temporary Capacity | 0.27 | 14.8% | 0.48 | 5.67% |
| Military and Remote Sites | 0.30 | 16.3% | 0.69 | 8.61% |
| Cryptocurrency Mining | 0.28 | 14.9% | 0.46 | 5.16% |
By End-user: Cloud and AI Providers Lead with 27.4%
Cloud and AI providers account for USD 506.45 million (27.4%) of 2025 demand and grow at 13.65% a year to USD 1.82 billion by 2035. Telecom operators follow with USD 423.27 million (22.9%), then enterprises with 19.8%, government and defense with 17.2% and energy and resources companies with 12.7%. Enterprises grow slowest at 7.40% a year because DC Market Insights expects more enterprise workloads to move to cloud and colocation capacity rather than owned containers.
DC Exclusive: The Units × Price Model and Application × Container Size Matrix
At USD 264.76 million in 2025, 40-foot containers for edge computing are the single largest cell of the matrix and 14.3% of all containerized data center spending. The matrix below cross-tabulates what is bought and what it is used for. It is a DC Market Insights model, not a shipment count, built from 49 inputs: 24 unit and price anchors (3 container sizes, 2 measures, 4 anchor years), 15 matrix seed weights (5 applications by 3 container sizes) and 10 application shares (5 applications in 2025 and 2035).
| 2025, USD million | 20-Foot Containers | 40-Foot Containers | Custom and Multi-Container Systems | Total |
|---|---|---|---|---|
| Edge Computing | 221.83 | 264.76 | 93.79 | 580.38 |
| AI and HPC | 16.46 | 162.07 | 239.20 | 417.73 |
| Disaster Recovery and Temporary Capacity | 69.29 | 155.94 | 48.33 | 273.56 |
| Military and Remote Sites | 87.53 | 145.91 | 67.84 | 301.28 |
| Cryptocurrency Mining | 14.39 | 167.32 | 93.69 | 275.40 |
| Total | 409.50 | 896.00 | 542.85 | – |
AI and HPC buyers spend 57.3% of their container budget on custom and multi-container systems, while edge computing buyers spend 38.2% on 20-foot units. Builders of megawatt-scale systems are therefore aligned with the fastest-growing application.
The units × price model behind these figures has two inputs per size class that any reader can check against supplier disclosures: units shipped (3,880 in total in 2025) and average price per unit. Multiplying the two and adding the three size classes gives the market. The model and its assumptions are explained on our research methodology page.
Regional Insights: Which Region Leads the Containerized Data Center Market?
North America leads the Containerized Data Center Market with 40.2% of 2025 value. The Middle East and Africa is the fastest-growing region at 13.00% a year, because energy, defense and sovereign cloud projects there need factory-tested capacity at remote and high-temperature sites.
North America Leads with 40.2% Share
North American buyers spent USD 743.04 million on containerized data centers in 2025, and the region grows at 9.56% a year to 2035. The IEA attributes 45% of global data centre electricity consumption in 2024 to the United States. North America loses 2.8 points of share by 2035 as other regions grow faster.
Asia Pacific Holds 29.5% Share
Asia Pacific is worth USD 545.26 million in 2025 and USD 1.59 billion by 2035, a CAGR of 11.29%. China is the largest market in the region at USD 251.38 million, and India grows fastest at 14.79% a year. LG CNS plans its first AI Box unit in Busan before expanding to Southeast Asia and North America. Asia Pacific gains 2.6 points of share, the largest gain of any region.
Europe Holds 17.6% Share
Europe is worth USD 325.31 million in 2025 and USD 752.19 million by 2035, a CAGR of 8.74%, the slowest of the five regions. Germany, the United Kingdom and France account for more than half of European spending in the DC Market Insights model.
Middle East and Africa Holds 7.1% Share
The Middle East and Africa is worth USD 131.23 million in 2025 and USD 445.38 million by 2035, the fastest growth of any region at 13.00% a year. Saudi Arabia and the United Arab Emirates both appear in the global top 12, and oil, gas and defense sites favor units that arrive tested and ready to connect.
Latin America Holds 5.6% Share
Latin America is worth USD 103.51 million in 2025 and USD 311.76 million by 2035, a CAGR of 11.66%, led by Brazil at USD 40.66 million in 2025.
Country Analysis: Which Countries Buy the Most Containerized Data Centers?
The United States is the largest country market for containerized data centers at USD 648.77 million in 2025, 35.1% of global value, followed by China at USD 251.38 million (13.6%) and Japan at USD 77.63 million (4.2%). The 12 largest countries account for 78.9% of 2025 spending.
| Rank | Country | Region | 2025 (USD billion) | Share 2025 | 2035 (USD billion) | CAGR 2025-2035 |
|---|---|---|---|---|---|---|
| 1 | United States | North America | 0.65 | 35.1% | 1.60 | 9.44% |
| 2 | China | Asia Pacific | 0.25 | 13.6% | 0.70 | 10.83% |
| 3 | Japan | Asia Pacific | 0.08 | 4.2% | 0.20 | 9.81% |
| 4 | Germany | Europe | 0.08 | 4.1% | 0.17 | 8.62% |
| 5 | Canada | North America | 0.07 | 3.9% | 0.19 | 10.06% |
| 6 | United Kingdom | Europe | 0.07 | 3.6% | 0.15 | 8.71% |
| 7 | India | Asia Pacific | 0.06 | 3.1% | 0.23 | 14.79% |
| 8 | Australia | Asia Pacific | 0.05 | 2.6% | 0.14 | 11.56% |
| 9 | Saudi Arabia | Middle East and Africa | 0.04 | 2.4% | 0.17 | 14.26% |
| 10 | France | Europe | 0.04 | 2.3% | 0.10 | 8.82% |
| 11 | Brazil | Latin America | 0.04 | 2.2% | 0.12 | 11.77% |
| 12 | United Arab Emirates | Middle East and Africa | 0.03 | 1.8% | 0.12 | 13.57% |
India is the fastest-growing large country market at 14.79% a year, ahead of Saudi Arabia at 14.26% and the United Arab Emirates at 13.57%. The country figures are a DC Market Insights allocation of the regional totals, weighted by each country’s estimated share of edge, AI and remote-site deployments.
Forecast Scenarios: How Could the 2035 Forecast Change?
The Containerized Data Center Market reaches USD 4.95 billion by 2035 in the base case, with a range of USD 4.11 billion to USD 5.69 billion across the low and high scenarios.
| Scenario | Assumption from 2026 | 2035 (USD billion) | CAGR 2025-2035 |
|---|---|---|---|
| Low | Container units and prices combined 17% below base by 2035 | 4.11 | 8.31% |
| Base | Units rise to about 7,035 a year; average price reaches about USD 703,400 | 4.95 | 10.35% |
| High | Container units and prices combined 15% above base by 2035 | 5.69 | 11.90% |
The low case reflects AI buyers moving almost entirely to prefabricated data halls; the high case assumes AI inference spreads to many more edge sites and that new container plants such as Armada’s Galleon Forge One add output on schedule.
Competitive Insights: Who Leads the Containerized Data Center Market?
- Huawei
- Vertiv
- Schneider Electric
- Hewlett Packard Enterprise (HPE)
- Delta Electronics
- ZTE
- LG CNS
- Crusoe
- Armada
- Bridge DC
- Duos Edge AI
The Containerized Data Center Market is fragmented: DC Market Insights estimates that the five largest suppliers, Huawei, Vertiv, Schneider Electric, HPE and Delta, together hold about 36% of 2025 value, with the rest split among regional integrators, specialist builders and operators that make their own units. The basis is each supplier’s container product range set against the USD 1.85 billion market and the 3,880 units estimated for 2025. Vertiv’s SmartMod and SmartMod MAX containers hold up to 12 and 24 racks, and Schneider Electric’s SmartShelter Container fits between four and ten racks in a standard ISO shipping container. Huawei offers the containerized FusionPower9000 for power and cooling, HPE sells the AI Mod POD at up to 1.5 MW per module, Delta showed a 20-foot unit integrating power, cooling and IT equipment for edge computing, and ZTE offers a prefabricated AI data center container. A newer group of AI-focused builders includes Crusoe, Armada, LG CNS and Bridge DC, with LG CNS and Armada offering megawatt-scale units and Armada planning its Galleon Forge One plant with Johnson Controls, while Duos Edge AI deploys its own containerized edge sites.
Recent Developments
- In March 2025, HPE introduced the AI Mod POD, a container-based AI data center in which each module supports up to 1.5 MW, with a PUE of under 1.1 (Source: Data Center Dynamics news report).
- In June 2025, Crusoe introduced Crusoe Spark, a turnkey prefabricated modular AI factory with units delivered as fast as three months (Source: Crusoe press release).
- In July 2025, ZTE launched an AI data center prefabricated container that supports 40 kW liquid-cooled AI racks with a PUE of 1.15 (Source: Data Center Dynamics news report).
- In March 2026, LG CNS announced its AI Box, which houses up to 576 GPUs and 1.2 MW of IT power in a single container (Source: The Investor news report).
- In May 2026, Armada raised USD 230.00 million in Series B funding and said it plans to open Galleon Forge One, a plant of up to 400,000 square feet, in partnership with Johnson Controls, that will initially produce its megawatt-scale Leviathan modular data center (Source: Data Center Dynamics news report).
- In August 2026, Bridge DC launched PowerCore 5.0, a power module built within a 40 ft ISO container frame and fully assembled and tested off-site (Source: Data Center Dynamics news report).
We follow these launches, funding rounds and deployments as they happen in our data center industry updates.
Methodology: How We Built the Containerized Data Center Market Model
DC Market Insights built this market bottom-up from units and prices for 3 container size classes over 16 years (2020 to 2035). Units shipped and average prices were set at 4 anchor years (2020, 2025, 2030 and 2035) and interpolated at constant growth between them: 20-foot containers rise from about 1,480 units at USD 168,000 in 2020 to about 3,050 units at USD 256,000 in 2035, 40-foot containers from about 860 units at USD 410,000 to about 3,050 units at USD 735,000, and custom and multi-container systems from about 95 units at USD 1.28 million to about 935 units at USD 2.06 million. The total was split by 4 components, 3 rack density classes, 5 applications, 5 end-user groups and 5 regions, and every segment and regional split sums to the market total; the 12 countries are allocated within their regional totals. The result was checked top-down against supplier disclosures (HPE’s 1.5 MW module rating, the 1.2 MW LG CNS AI Box and Crusoe’s 400 deployed units), the IEA electricity outlook and the ISO containerized form factor in the DC Market Insights Modular Data Center Market model. The analyst named on this page built the model, and the reviewer checked the arithmetic, the sources and the dates before publication.
Table of contents
- 01Introduction
- 1.1Market Definition and Scope
- 1.2Container Size Classes and Units
- 1.3Currency, Pricing and Base Year
- 1.4Key Stakeholders
- 02Research Methodology
- 2.1Units × Price Model Structure
- 2.2Primary and Secondary Sources
- 2.3Top-Down Cross-Checks
- 2.4Forecast Assumptions
- 03Executive Summary
- 3.1Market Snapshot, 2025 and 2035
- 3.2Key Findings
- 3.3Analyst Viewpoint
- 04Market Dynamics
- 4.1Drivers
- 4.2Trends
- 4.3Challenges
- 4.4Opportunities
- 05Pricing Analysis
- 5.1Average Price by Container Size, 2020, 2025, 2030 and 2035
- 5.2Average Price across All Container Types
- 5.3Units Shipped, 2020, 2025, 2030 and 2035
- 06Standards and Regulation
- 6.1ISO 668 Container Dimensions and Ratings
- 6.2UL 2755 Certification
- 6.3NEC Article 646 Installation Requirements
- 07Supply Chain Analysis
- 7.1Container Frames and Enclosures
- 7.2Power and Cooling Equipment
- 7.3Factory Integration and Testing
- 7.4Delivery, Installation and Services
- 08Containerized Data Center Market Size and Forecast
- 8.1Market Size, 2020-2035
- 8.2Year-on-Year Growth
- 8.3Units Shipped and Average Price
- 09Market by Container Size
- 9.120-Foot Containers
- 9.240-Foot Containers
- 9.3Custom and Multi-Container Systems
- 10Market by Component
- 10.1IT Containers
- 10.2Power Containers
- 10.3Cooling Containers
- 10.4Integration and Services
- 11Market by Rack Density
- 11.1Up to 20 kW
- 11.220 kW to 50 kW
- 11.3Above 50 kW
- 12Market by Application
- 12.1Edge Computing
- 12.2AI and HPC
- 12.3Disaster Recovery and Temporary Capacity
- 12.4Military and Remote Sites
- 12.5Cryptocurrency Mining
- 13Market by End-user
- 13.1Cloud and AI Providers
- 13.2Telecom Operators
- 13.3Enterprises
- 13.4Government and Defense
- 13.5Energy and Resources Companies
- 14DC Exclusive: Application × Container Size Matrix
- 14.1Cell Values, 2025
- 14.2Model Inputs and Method
- 15Market by Region
- 15.1North America (United States, Canada)
- 15.2Asia Pacific (China, Japan, India, Australia)
- 15.3Europe (Germany, United Kingdom, France)
- 15.4Middle East and Africa (Saudi Arabia, United Arab Emirates)
- 15.5Latin America (Brazil)
- 16Country Analysis
- 16.1Top 12 Countries, 2025 and 2035
- 16.2Fastest-Growing Country Markets
- 17Regional Cross-Sections
- 17.1Region by Container Size, 2025 and 2035
- 17.2Region by Application, 2025 and 2035
- 18Forecast Scenarios
- 18.1Low Scenario
- 18.2Base Scenario
- 18.3High Scenario
- 19Competitive Landscape
- 19.1Market Concentration
- 19.2Product Positioning by Container Size
- 19.3Recent Developments
- 20Company Profiles
- 20.1Huawei
- 20.2Vertiv
- 20.3Schneider Electric
- 20.4Hewlett Packard Enterprise (HPE)
- 20.5Delta Electronics
- 20.6ZTE
- 20.7LG CNS
- 20.8Crusoe
- 20.9Armada
- 20.10Bridge DC
- 20.11Duos Edge AI
- 21Analyst Recommendations
- 21.1For Container Builders
- 21.2For Data Center Operators
- 21.3For Investors
- Fig. 1Containerized Data Center Market Size, 2020–2035
- Fig. 2Market Share by Container Size, 2025 and 2035
- Fig. 3Market Share by Component, 2025 and 2035
- Fig. 4Market Share by Rack Density, 2025 and 2035
- Fig. 5Market Share by Application, 2025 and 2035
- Fig. 6Market Share by End-user, 2025 and 2035
- Fig. 7Market Share by Region, 2025 and 2035
- Fig. 8Top 12 Countries, 2025
- Fig. 9Forecast Scenarios, 2035
- Table 1Report Attributes
- Table 2Pricing Indicators, 2020, 2025, 2030 and 2035
- Table 3Market by Container Size, 2025 and 2035
- Table 4Market by Component, 2025 and 2035
- Table 5Market by Rack Density, 2025 and 2035
- Table 6Market by Application, 2025 and 2035
- Table 7Market by End-user, 2025 and 2035
- Table 8Application × Container Size Matrix, 2025
- Table 9Market by Region, 2025 and 2035
- Table 10Top 12 Countries, 2025 and 2035
- Table 11Forecast Scenarios, 2035
- Table 12Company Product Positioning
About this report
Written by Satyabrat Rajawat and reviewed by Deepti Agrawal, Senior Editor, Research. Figures are built top-down and bottom-up and reconciled before publication, with 2025 as the base year.
Read our methodologyHow we built this
- Historical period2020-2024
- Base year2025
- Forecast period2026-2035
- Sizing approachTop-down + bottom-up
Need more than the report?
Advisory on this market
Due diligence, site selection and market entry work, by the analysts who wrote this report.
See consulting servicesFrequently asked questions
USD 1.85 billion in 2025, rising to USD 4.95 billion by 2035. DC Market Insights estimates the market at USD 722.84 million in 2020.
10.35% a year from 2025 to 2035. Growth was faster, at 20.66% a year, between 2020 and 2025 as AI and edge containers raised both volumes and average prices.
40-foot containers, with 48.5% of 2025 value. Custom and multi-container systems grow fastest among size classes at 13.50% a year.
About USD 476,400 on average in 2025, from about USD 210,000 for a 20-foot unit to about USD 1.65 million for a custom or multi-container system, according to DC Market Insights estimates excluding IT equipment.
Containers for racks above 50 kW, at 18.99% a year from 2025 to 2035, rising from 18.3% to 38.9% of market value as AI and liquid-cooled edge deployments scale.
North America, with USD 743.04 million or 40.2% of 2025 value. The Middle East and Africa grows fastest at 13.00% a year.
About 36% of 2025 value sits with Huawei, Vertiv, Schneider Electric, HPE and Delta (DC Market Insights estimate). ZTE, LG CNS, Crusoe, Armada, Bridge DC and Duos Edge AI also compete.
USD 648.77 million in the United States, or 35.1% of 2025 spending, followed by China at USD 251.38 million. India grows fastest among large country markets at 14.79% a year.
Licences, delivery and payment
Which licence should I choose?
Single User is a view-only PDF for one person. Multi User adds a printable PDF and the Excel data for unlimited users at one location. Enterprise covers your whole company and includes 100 free analyst hours.
How and when will I receive the report?
By email, within 24–48 business hours of payment, in the formats of your licence.
How can I pay?
Securely through PayPal: with a PayPal account, a debit or credit card, or PayPal Pay Later where available. Prices are in US dollars.
Can I see a sample first?
Yes. Request a free sample and we will email it to you.
Can the report be tailored to my needs?
Yes. We can add countries, segments or data cuts. Talk to an analyst about the scope you need.
Can I get an invoice or pay against a purchase order?
Write to sales@dcmarketinsights.com and our team will help.