
Data Center Cleaning Services Market Size, Share & Forecast to 2035
Market at a glance
The Data Center Cleaning Services market was worth USD 1,140.0 million in 2025 and is forecast to reach USD 2,870.0 million by 2035, growing at a 9.65% CAGR.
 By Amit Jain, Senior Consultant, ICT & Emerging Technologies
 Reviewed by Deepti Agrawal
Last updated 9 Nov 2026
Base year 2025 PDF + Excel
Key findings
ISO 14644 Final Cleans Become a Tender Requirement
Slab-Floor AI Halls Move Cleaning Overhead
Asia Pacific Commissioning Cleans
What is inside the report
- 01Introduction
- 02Key Market Statistics
- 03Executive Summary
- 04Market Scope and Estimate Comparison
- 05Market Drivers
- 06Market Trends
- 07Market Challenges and Restraints
- 08Market Opportunities
- 09Pricing Analysis
- 10Standards and Regulation
- 18chapters
- 2020-2024Historical period
- 2026-2035Forecast period
- —Companies profiled
Segmentation
Recent developments
ABM Industries reported that Manufacturing and Distribution revenue grew 18% in its fiscal third quarter, led by technology-related markets (Source: ABM Industries)
OCS India stated that ISO 14644 project cleaning is now written into data centre tenders, with Class 8 compliance expected across white space and utility rooms (Source: OCS Group)
OCS UK set out HEPA vacuum methods for raised floors, cable trays and underfloor plenums aligned with ISO 14644-1 and ASHRAE TC 9.9 (Source: OCS Group)
EMCOR Group reported US electrical construction revenue from network and communications, which includes data centers, of USD 2,461.9 million for 2025, up from USD 1,442.9 million (Source: EMCOR Group)
ISS A/S reported 2025 cleaning revenue of DKK 35,744 million, its largest service line (Source: ISS A/S)
the US Census Bureau's construction release put January to September 2026 private data center construction at about USD 54.2 billion (Source: US Census Bureau)
Full analysis
The Data Center Cleaning Services Market is valued at USD 1.29 billion in 2026 and is projected to reach USD 2.87 billion by 2035, up from USD 1.14 billion in 2025, a CAGR of 9.65% from 2025 to 2035 (DC Market Insights estimate). Spending in data center cleaning is set by square feet and by the cleanliness class buyers write into contracts: the American Society of Heating, Refrigerating and Air-Conditioning Engineers (ASHRAE) recommends that data halls be kept to International Organization for Standardization (ISO) Class 8 at the 95% upper confidence limit (ASHRAE TC 9.9, 2011), and OCS India reported in July 2026 that project cleaning to ISO 14644 is now part of data centre tenders, where two years earlier not every site specified it. Every new hall therefore buys a verified final clean before commissioning, and every live hall buys recurring subfloor, surface and overhead cleaning. The 2025 receipt is 12.0 gigawatts (GW) of new information technology (IT) capacity x 8,500 square feet per megawatt (MW) x USD 2.20 per square foot = USD 224.40 million of post-construction cleaning, plus 1,276 million square feet of installed data center floor cleaned under service contracts worth USD 918.49 million. Contamination testing and remediation is the fastest service at 16.99% a year as liquid-cooled artificial intelligence (AI) halls add corrosion-sensitive coolant loops, and the Middle East and Africa is the fastest region at 12.92% as new campuses there reach commissioning.
Key Market Statistics: How Big Is the Data Center Cleaning Services Market in 2026?
DC Market Insights puts data center cleaning services spending at USD 1.29 billion in 2026, 12.52% above 2025, because 14.5 GW of new IT capacity needs a final clean and the installed base grows to 129.1 GW.
- Data center cleaning services market size 2025: USD 1.14 billion
- Market size 2026: USD 1.29 billion
- Market size 2030: USD 1.89 billion
- Market size 2035: USD 2.87 billion
- CAGR 2025-2035: 9.65% (low case 7.75%, high case 11.38%)
- Largest service type: support space janitorial, USD 466.70 million or 40.8% of 2025 value
- Fastest service type: contamination testing and remediation at 16.99% a year
- Largest data center type: hyperscale and cloud, USD 434.30 million in 2025; enterprise sites grow only 4.06% a year
- Leading region: North America, USD 480.01 million or 42.0% of 2025 value; fastest region: Middle East and Africa at 12.92%
- Largest country: United States, USD 428.58 million in 2025; fastest large country: India at 15.86%
- Market leaders: ABM Industries, ISS A/S, OCS Group, Rentokil Initial and Pritchard Industries, with specialists such as DataSpan, Salute Mission Critical and Cleanstar National (DC Market Insights assessment)
Executive Summary: Data Center Cleaning Services Market Size, 2020-2035
The Global Data Center Cleaning Services Market size was valued at USD 695.15 million in 2020, reached USD 1.14 billion in 2025, and is anticipated to reach USD 2.87 billion by 2035, at a CAGR of 9.65% during the forecast period. Data center cleaning services spending grew 10.45% a year from 2020 to 2025 as new capacity rose from 5.0 GW to 12.0 GW a year; from 2025 the installed floor that needs recurring cleaning grows faster than new floor, because each new AI MW needs less area than an older enterprise MW.
| Attribute | Value |
|---|---|
| Historical period | 2020-2024 |
| Base year | 2025 |
| Forecast period | 2026-2035 |
| Market size 2025 | USD 1.14 billion |
| Market size 2026 | USD 1.29 billion |
| CAGR 2025-2035 | 9.65% |
| Market size 2035 | USD 2.87 billion |
| Segments covered | Service type, cleaning area, data center type, contract model |
| Regions covered | North America, Europe, Asia Pacific, Latin America, Middle East and Africa |
The data center cleaning services market grows a little more slowly than data center capacity because floor area per MW falls: DC Market Insights uses 12,000 square feet of building per new MW in 2020, 8,500 in 2025 and 5,000 by 2035 as racks move from 8-10 kilowatts (kW) to 40 kW and more. Prices rise 2.5% a year with cleaning wages, and the contracted share of white-space cleaning moves from 55% to 65% as operators hand subfloor and overhead work to certified crews.
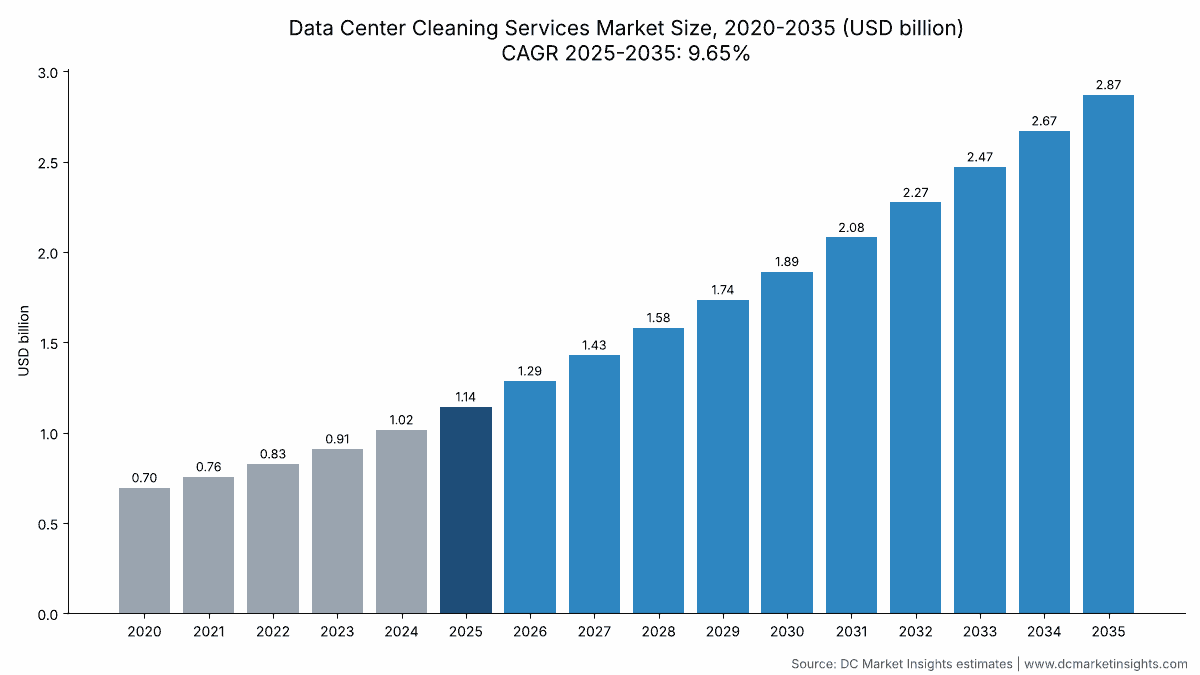
What Do Data Center Cleaning Services Include?
Data center cleaning services cover USD 1.14 billion of 2025 contracted work done inside data center buildings by cleaning crews and contamination specialists.
Included: post-construction and pre-commissioning cleaning of new halls (rough, final and ISO 14644 verification cleans); recurring critical-environment cleaning of white space (raised-floor surfaces, subfloor plenums, equipment exteriors, cable trays and ceiling voids); janitorial work in support space (electrical and mechanical rooms, offices, loading docks and common areas); particle counting, corrosion testing and remediation such as zinc whisker removal.
Excluded: filter products and air-handling hardware (covered in the Data Center Air Filtration Market), water treatment chemicals, cleaning done by operator employees who are not under a service contract, IT equipment repair, decommissioning and site clearance (covered in the Data Center Decommissioning Service Market), and outdoor grounds care.
How the segments fit together: the four service types sum to the total every year; cleaning area, data center type and contract model are three other cuts of the same total.
Why Do Data Center Cleaning Services Market Estimates Differ?
Estimates differ mostly on scope: DC Market Insights values the data center cleaning services market at USD 1.29 billion in 2026 for contracted cleaning inside data center buildings only.
Broader definitions add products and adjacent services. Some count cleaning chemicals, tacky mats, high-efficiency particulate air (HEPA) vacuums and filters sold to data centers; some count the soft-services share of integrated facility management, or the whole janitorial wage bill of data center operators, including in-house staff. Others count hard services such as heating, ventilation and air-conditioning (HVAC) maintenance or fire-system inspection. This edition keeps those out so the value matches what a buyer pays a cleaning contractor. The Data Center Facility Management O&M Services Market carries cleaning inside its soft-services line, so the two reports overlap by design.
| Element | In this report? | Why |
|---|---|---|
| Post-construction final cleans (USD 224.40 million in 2025) | Yes | Bought from cleaning contractors before commissioning |
| White-space and subfloor cleaning (USD 347.39 million) | Yes | Core critical-environment service |
| Support-space janitorial (USD 466.70 million) | Yes | Contracted cleaning in the same buildings |
| Contamination testing and remediation (USD 104.40 million) | Yes | Sold by the same specialists, often in one contract |
| Cleaning products, mats and filters | No | Products, not services |
| In-house cleaning staff | No | No service contract |
Small and medium enterprise server rooms are in scope when they sit in dedicated data center buildings; office-closet server rooms cleaned by general janitorial firms are not.
Market Drivers: What Raises Data Center Cleaning Spending?
Three drivers add USD 143.11 million to data center cleaning services spending between 2025 and 2026: tender rules, construction volume and contamination risk in liquid-cooled halls.
ISO 14644 Final Cleans Become a Tender Requirement
Post-construction cleaning reaches USD 261.58 million in 2026, DC Market Insights estimates, up from USD 224.40 million in 2025. OCS Group’s India business wrote in July 2026 that ISO 14644 project cleaning is now part of data centre tenders and that Class 8 compliance is expected across white space, utility rooms and the passages between them (Source: OCS India, July 2026). The standard itself, ISO 14644-1:2015, classifies air cleanliness by particle concentration for particles from 0.1 to 5 micrometres, so a final clean ends with a particle count, not a visual check.
USD 54.2 Billion of US Data Center Construction in Nine Months
The United States Census Bureau’s construction spending tables show private data center construction of about USD 49.7 billion in 2025 (DC Market Insights sum of the monthly values) and USD 54.2 billion in January to September 2026 alone (US Census Bureau, November 2026). Each completed hall needs a final clean before handover, so the United States accounts for an estimated USD 84.15 million of 2025 post-construction cleaning, about 0.17% of that construction value.
Liquid-Cooled AI Halls Raise the Cost of Contamination
Contamination testing and remediation grows from USD 104.40 million in 2025 to USD 501.61 million by 2035, a 16.99% CAGR. ASHRAE’s gaseous and particulate guidelines set copper corrosion below 300 angstroms (Å) a month and silver below 200 Å a month, and advise relative humidity below 60%; coolant distribution units, quick disconnects and cold plates add metal surfaces and fluid joints that operators now test on a schedule. DC Market Insights raises testing spend from USD 900 per installed MW in 2025 to USD 1,613 by 2035.
Market Trends: How Is Data Center Cleaning Work Changing?
Data center cleaning work is shifting from raised floors to overhead and equipment surfaces: subfloor plenum cleaning falls from 20.3% of 2025 value to 12.2% by 2035.
Slab-Floor AI Halls Move Cleaning Overhead
New AI halls are built on concrete slab with overhead busway, cable trays and coolant piping, so overhead trays and ceiling voids grow 13.84% a year to USD 467.89 million by 2035, while raised floor and subfloor plenum work grows 4.20%. OCS UK describes HEPA vacuums used on raised floors, cable trays and underfloor plenums without disturbing airflow (Source: OCS UK, March 2026).
Particle Counts Before and After Every Clean
Specialists now sell measured results: DataSpan lists particle counts taken before and after each clean alongside subfloor, above-ceiling and post-construction work (Source: DataSpan service page, 2025). DC Market Insights counts this testing inside the USD 104.40 million contamination testing and remediation line for 2025.
Cleaning Bundled into Integrated Facility Contracts
Bundled integrated facility management contracts grow 13.68% a year, from USD 238.86 million in 2025 to USD 861.14 million in 2035. ABM Industries’ annual report on Form 10-K for fiscal 2025 describes its Manufacturing and Distribution segment as integrated facility services, engineering, janitorial and maintenance for manufacturing, distribution and data center facilities, priced on fixed-price, square-foot or cost-plus terms (ABM 10-K, December 2025).
Market Challenges and Restraints: What Holds Back Data Center Cleaning Services?
Labor cost and buyer concentration are the two restraints that hold data center cleaning services growth to 9.65% a year, below the 10.4% a year growth of installed capacity to 2035.
USD 17.71 an Hour Wages and 2% Workforce Growth
The US Bureau of Labor Statistics (BLS) puts the median wage of janitors and building cleaners at USD 17.71 an hour in May 2025, with the top 10% above USD 24.17, and projects employment growth of only 2% from 2025 to 2035 (BLS Occupational Outlook Handbook). Data center crews need security clearance and training on ISO 8 methods, so contractors pay above the median; DC Market Insights raises unit prices 2.5% a year, which is about all that buyers accept in multi-year contracts.
One Client Can Be a Third of a Segment
ABM reported that one client accounted for about 32% of its Manufacturing and Distribution segment revenue in fiscal 2025 (Source: ABM 10-K, December 2025). Hyperscale and cloud operators already buy 38.0% of data center cleaning services in 2025 and 49.0% by 2035, so a lost hyperscale contract can remove a large part of a regional contractor’s data center revenue at renewal.
Market Opportunities: Where Can Data Center Cleaning Contractors Grow?
The two largest openings are certified pre-commissioning cleans in Asia Pacific and contamination programs for liquid-cooled halls, worth a combined USD 1.04 billion of added yearly spending by 2035 before overlap.
Asia Pacific Commissioning Cleans
Asia Pacific data center cleaning services spending rises from USD 320.01 million in 2025 to USD 961.61 million by 2035, an 11.63% CAGR, with India growing 15.86% a year. The OCS India note on 60-day pre-commissioning windows shows the work is now scoped as an engineering task with Class 8 verification, which favours contractors with particle-count equipment and trained crews.
Testing Programs for Coolant Loops
Contamination testing and remediation adds USD 397.21 million of yearly spending between 2025 and 2035. Contractors that pair corrosion coupons, particle counts and zinc whisker remediation with routine cleaning can sell recurring programs at about USD 1,273 per installed MW in 2030, against USD 900 in 2025 (DC Market Insights estimate).
How Much Does Data Center Cleaning Cost per Square Foot?
A post-construction final clean costs about USD 2.20 per square foot in 2025, DC Market Insights estimates, against USD 1.10 per white-space square foot per year for recurring critical-environment cleaning; total cleaning spend works out to USD 9,852 per installed MW in 2025.
| Year | Final clean (per sq ft) | White space (per sq ft-year) | Support space (per sq ft-year) | Testing (per installed MW-year) | All cleaning (per installed MW) |
|---|---|---|---|---|---|
| 2020 | USD 1.94 | USD 0.97 | USD 0.84 | USD 636 | USD 8,807 |
| 2025 | USD 2.20 | USD 1.10 | USD 0.95 | USD 900 | USD 9,852 |
| 2030 | USD 2.49 | USD 1.24 | USD 1.07 | USD 1,273 | USD 9,494 |
| 2035 | USD 2.82 | USD 1.41 | USD 1.22 | USD 1,613 | USD 9,230 |
Public anchors: no cleaning contractor publishes a price list, but ABM’s annual report confirms that square-foot pricing is one of its three contract forms (Source: ABM 10-K, December 2025), and the BLS mean wage of USD 18.64 an hour for 2,209,760 US janitors in May 2025 sets the labor floor under these rates. Per-square-foot prices above are DC Market Insights estimates built from those wages, crew productivity and contractor margins.
Which Standards Define a Clean Data Center?
Four technical references set what a data center cleaning contract must deliver across USD 1.14 billion of 2025 spending.
- ISO 14644-1:2015, cleanrooms and associated controlled environments, classification of air cleanliness by particle concentration (0.1 to 5 micrometres); confirmed in 2021 (Source: ISO)
- ASHRAE TC 9.9, Gaseous and Particulate Contamination Guidelines for Data Centers (2011): ISO Class 8 at the 95% upper confidence limit, MERV 8 filters for recirculated air and MERV 11 or 13 for incoming air (Source: ASHRAE)
- ASHRAE corrosion limits in the same guidelines: copper below 300 Å a month and silver below 200 Å a month; zinc whisker cases are remediated by replacing floor tiles and hiring professional cleaners (Source: ASHRAE)
- ASHRAE Datacom series, Particulate and Gaseous Contamination in Datacom Environments, Second Edition, the reference most cleaning method statements cite (Source: ASHRAE)
MERV stands for minimum efficiency reporting value, the filter rating scale used in these guidelines.
Data Center Cleaning Services Market Segmentation: Which Service Earns Most?
Support space janitorial earns the most at USD 466.70 million in 2025, while white space critical environment cleaning, at USD 347.39 million, is the specialist core of the data center cleaning services market.
By Service Type
Support space janitorial is the largest service type, but contamination testing and remediation grows fastest. Support Space Janitorial accounts for USD 466.70 million in 2025; Contamination Testing and Remediation grows 16.99% a year to USD 501.61 million by 2035.
| Service Type | 2025 (USD million) | Share 2025 | 2035 (USD million) | CAGR 2025-2035 |
|---|---|---|---|---|
| Post-Construction and Pre-Commissioning Cleaning | 224.40 | 19.63% | 380.19 | 5.41% |
| White Space Critical Environment Cleaning | 347.39 | 30.40% | 896.63 | 9.95% |
| Support Space Janitorial | 466.70 | 40.84% | 1,092.05 | 8.87% |
| Contamination Testing and Remediation | 104.40 | 9.13% | 501.61 | 16.99% |
By Cleaning Area
Offices, docks and common areas are the largest cleaning area; overhead cable trays and ceiling voids grow fastest. Offices Docks and Common Areas accounts for USD 329.15 million in 2025; Overhead Cable Trays and Ceiling Voids grows 13.84% a year to USD 467.89 million by 2035.
| Cleaning Area | 2025 (USD million) | Share 2025 | 2035 (USD million) | CAGR 2025-2035 |
|---|---|---|---|---|
| Raised Floor and Subfloor Plenum | 232.01 | 20.30% | 350.20 | 4.20% |
| White Space Surfaces and Equipment Exteriors | 269.72 | 23.60% | 763.55 | 10.97% |
| Overhead Cable Trays and Ceiling Voids | 128.00 | 11.20% | 467.89 | 13.84% |
| Electrical and Mechanical Rooms | 184.01 | 16.10% | 519.56 | 10.94% |
| Offices Docks and Common Areas | 329.15 | 28.80% | 769.28 | 8.86% |
By Data Center Type
Enterprise sites barely grow while hyperscale and cloud sites lead on both size and growth. Hyperscale and Cloud accounts for USD 434.30 million in 2025; it grows 12.47% a year to USD 1,406.53 million by 2035.
| Data Center Type | 2025 (USD million) | Share 2025 | 2035 (USD million) | CAGR 2025-2035 |
|---|---|---|---|---|
| Hyperscale and Cloud | 434.30 | 38.00% | 1,406.53 | 12.47% |
| Colocation | 342.87 | 30.00% | 832.44 | 9.28% |
| Enterprise | 308.58 | 27.00% | 459.28 | 4.06% |
| Edge and Other | 57.14 | 5.00% | 172.23 | 11.66% |
By Contract Model
Recurring service contracts carry most of the value; bundled integrated facility management grows fastest. Recurring Service Contracts accounts for USD 633.17 million in 2025; Bundled Integrated Facility Management grows 13.68% a year to USD 861.14 million by 2035.
| Contract Model | 2025 (USD million) | Share 2025 | 2035 (USD million) | CAGR 2025-2035 |
|---|---|---|---|---|
| Recurring Service Contracts | 633.17 | 55.40% | 1,492.65 | 8.95% |
| Project-Based Contracts | 270.86 | 23.70% | 516.69 | 6.67% |
| Bundled Integrated Facility Management | 238.86 | 20.90% | 861.14 | 13.68% |
DC Exclusive: 50 MW AI Hall Cleaning Cost Teardown, USD 1.37 Million from Final Clean to Year One
A 50 MW AI hall commissioned in 2026 spends about USD 1.37 million on cleaning services in its first year, a DC Market Insights estimate built on 8 inputs: 50 MW of IT load, 8,000 square feet of building per MW, a 45% white-space share, the final-clean rate, the white-space and support-space rates, the testing rate per MW and the 2.5% price escalation.
| Line item | Basis | Cost (USD thousand) | Share |
|---|---|---|---|
| Final clean and ISO 14644 verification | 400,000 sq ft x USD 2.26 | 902.0 | 66.0% |
| White-space cleaning, year one | 180,000 sq ft x USD 1.13 | 202.9 | 14.8% |
| Support-space janitorial, year one | 220,000 sq ft x USD 0.97 | 214.2 | 15.7% |
| Contamination testing, year one | 50 MW x USD 945 x 1.05 liquid-cooling factor | 48.4 | 3.5% |
| Total | Final clean plus year one | 1,367.6 | 100.0% |
The final clean is 66% of first-year cleaning cost but a one-off; from year two the hall spends about USD 466 thousand a year, or USD 9,312 per MW. For an owner, the line that moves most with design is white space: a slab-floor hall with overhead trays removes subfloor plenum work but adds tray and ceiling-void cleaning at height.
Which Region Spends Most on Data Center Cleaning Services?
North America spends the most at USD 480.01 million in 2025, 42.0% of the data center cleaning services market; the Middle East and Africa grows fastest at 12.92% a year.
| Region | 2025 (USD million) | Share 2025 | 2035 (USD million) | CAGR 2025-2035 |
|---|---|---|---|---|
| North America | 480.01 | 42.0% | 1,062.08 | 8.27% |
| Europe | 251.44 | 22.0% | 545.39 | 8.05% |
| Asia Pacific | 320.01 | 28.0% | 961.61 | 11.63% |
| Latin America | 44.57 | 3.9% | 143.52 | 12.41% |
| Middle East and Africa | 46.86 | 4.1% | 157.88 | 12.92% |
North America
North America data center cleaning services spending moves from USD 480.01 million in 2025 to USD 1,062.08 million in 2035. The United States leads with USD 428.58 million in 2025; the Census Bureau’s USD 54.2 billion of data center construction in nine months of 2026 keeps final-clean demand high across the country.
Europe
Europe data center cleaning services spending moves from USD 251.44 million in 2025 to USD 545.39 million in 2035. The United Kingdom (USD 48.57 million) and Germany (USD 44.80 million) lead; OCS UK’s March 2026 note on facility management strategy for the UK data centre build-out shows contractors adding dedicated critical-environment teams.
Asia Pacific
Asia Pacific data center cleaning services spending moves from USD 320.01 million in 2025 to USD 961.61 million in 2035. China leads at USD 125.72 million, and India is the fastest large country at 15.86% a year, where OCS India reports ISO 14644 project cleaning written into tenders.
Latin America
Latin America data center cleaning services spending moves from USD 44.57 million in 2025 to USD 143.52 million in 2035. Brazil accounts for USD 21.71 million of 2025 regional value, mostly final cleans and recurring contracts for colocation campuses.
Middle East and Africa
Middle East and Africa data center cleaning services spending moves from USD 46.86 million in 2025 to USD 157.88 million in 2035. New campus construction drives the region’s 12.92% CAGR, the fastest of the five regions, from a 2025 base of 4.1% of global value.
Top 12 Countries in the Data Center Cleaning Services Market
The United States is the largest country at USD 428.58 million in 2025, 37.5% of global data center cleaning services spending; India is the fastest large country at 15.86% a year.
| Rank | Country | Region | 2025 (USD million) | 2035 (USD million) | CAGR 2025-2035 |
|---|---|---|---|---|---|
| 1 | United States | North America | 428.58 | 932.91 | 8.09% |
| 2 | China | Asia Pacific | 125.72 | 387.51 | 11.91% |
| 3 | Japan | Asia Pacific | 51.43 | 126.30 | 9.40% |
| 4 | United Kingdom | Europe | 48.57 | 103.34 | 7.84% |
| 5 | Germany | Europe | 44.80 | 100.47 | 8.41% |
| 6 | India | Asia Pacific | 30.29 | 132.04 | 15.86% |
| 7 | Canada | North America | 29.14 | 80.37 | 10.68% |
| 8 | France | Europe | 27.43 | 63.15 | 8.70% |
| 9 | Australia | Asia Pacific | 23.43 | 66.02 | 10.92% |
| 10 | Netherlands | Europe | 22.29 | 48.80 | 8.15% |
| 11 | Brazil | Latin America | 21.71 | 68.89 | 12.24% |
| 12 | Singapore | Asia Pacific | 18.29 | 54.54 | 11.55% |
The 12 countries hold 76.3% of 2025 value. India’s growth comes from new campuses that buy certified final cleans from day one, while the United Kingdom and the Netherlands grow below 8.5% a year because grid limits slow new halls.
Forecast Scenarios: How Large Could Data Center Cleaning Services Be by 2035?
DC Market Insights puts the 2035 data center cleaning services market between USD 2.41 billion and USD 3.36 billion, with a base case of USD 2.87 billion.
| Scenario | 2035 (USD million) | CAGR 2025-2035 | Main assumption |
|---|---|---|---|
| Low | 2,411.20 | 7.75% | New capacity stalls near 20 GW a year and contracted share stays at 55% |
| Base | 2,870.48 | 9.65% | 27 GW of new capacity in 2035, 311 GW installed, 65% contracted |
| High | 3,358.46 | 11.38% | ISO 14644 verification written into recurring contracts, not only final cleans |
Low Scenario
Grid limits cut new capacity and operators keep white-space cleaning in-house, so the market reaches USD 2.41 billion.
Base Scenario
Capacity follows the DC Market Insights path of 116 GW installed in 2025 and 311 GW in 2035, and the market reaches USD 2.87 billion.
High Scenario
Liquid-cooled halls adopt quarterly particle and corrosion testing as standard, and the market reaches USD 3.36 billion.
Key Players and Market Share: Who Provides Data Center Cleaning Services?
The top five providers hold about 24% of 2025 data center cleaning services value (DC Market Insights estimate, based on known data center accounts and contract counts), so the market stays fragmented among regional specialists.
- ABM Industries: janitorial and integrated facility services for data center facilities in its Manufacturing and Distribution segment; segment revenue USD 1,618.6 million in fiscal 2025, up 4.1%
- ISS A/S: the largest listed cleaning provider by revenue, with cleaning at DKK 35,744 million or 42% of 2025 group revenue
- OCS Group: critical-environment and pre-commissioning cleaning in the United Kingdom and India
- Rentokil Initial: data centre cleaning under the Initial brand in Hong Kong
- Pritchard Industries: underfloor plenum, cable tray and post-construction cleaning
- Salute Mission Critical: post-construction cleaning before data center turnover
- DataSpan: subfloor, above-ceiling and post-construction cleaning with before-and-after particle counts
- Harvard Maintenance: data center janitorial services in the United States
- Cleanstar National: critical-environment cleaning and airborne particle benchmarking
- Clean Group: data centre cleaning in Australia
- Executive Clean: data center facility cleaning in the United States
- Office Pride: franchised server room and data center cleaning
Provider Concentration, 2025
Large facility-service groups win bundled contracts on hyperscale campuses, worth USD 238.86 million in 2025, while specialists such as DataSpan and Pritchard Industries win project-based final cleans and contamination work. ABM’s purchase of Quality Uptime, an uninterruptible power supply (UPS) service company for mission-critical data centers, for a net USD 116.3 million shows facility groups building data center service lines around cleaning (Source: ABM 10-K, December 2025).
Recent Developments in the Data Center Cleaning Services Market
Six dated events from 2026 shape USD 1.29 billion of 2026 data center cleaning services spending.
- In September 2026, ABM Industries reported that Manufacturing and Distribution revenue grew 18% in its fiscal third quarter, led by technology-related markets (Source: ABM Industries)
- In July 2026, OCS India stated that ISO 14644 project cleaning is now written into data centre tenders, with Class 8 compliance expected across white space and utility rooms (Source: OCS Group)
- In March 2026, OCS UK set out HEPA vacuum methods for raised floors, cable trays and underfloor plenums aligned with ISO 14644-1 and ASHRAE TC 9.9 (Source: OCS Group)
- In February 2026, EMCOR Group reported US electrical construction revenue from network and communications, which includes data centers, of USD 2,461.9 million for 2025, up from USD 1,442.9 million (Source: EMCOR Group)
- In February 2026, ISS A/S reported 2025 cleaning revenue of DKK 35,744 million, its largest service line (Source: ISS A/S)
- In November 2026, the US Census Bureau’s construction release put January to September 2026 private data center construction at about USD 54.2 billion (Source: US Census Bureau)
Research Methodology: How DC Market Insights Sized the Data Center Cleaning Services Market
DC Market Insights sized the market bottom-up from floor area: 1,276 million square feet of installed data center building in 2025 and 102 million square feet of new building, priced per service.
Model Inputs
- New IT capacity: 5.0 GW (2020), 12.0 GW (2025), 22.0 GW (2030), 27.0 GW (2035); installed base 116 GW (2025) to 311 GW (2035) with 1.17% yearly retirement
- Building area per MW: new 12,000 / 8,500 / 6,000 / 5,000 sq ft; installed 13,000 / 11,000 / 8,500 / 7,000 sq ft (2020/2025/2030/2035)
- White space 45% of building area; contracted white-space cleaning 48% / 55% / 61% / 65%; contracted support-space cleaning 66% / 70% / 73% / 75%
- 2025 prices: final clean USD 2.20 per sq ft, white space USD 1.10 and support space USD 0.95 per sq ft-year, testing USD 900 per installed MW-year; 2.5% yearly escalation
Bound Checks
- Ceiling 1: US post-construction cleaning of USD 84.15 million is about 0.17% of USD 49.7 billion of 2025 US data center construction
- Ceiling 2: US cleaning spend of USD 428.58 million at 60% labor content funds about 4,900 full-time cleaners at the BLS mean wage plus 35% on-costs, 0.22% of 2,209,760 US janitors
- Floor: one subfloor clean a year at USD 0.25 per sq ft on contracted white space is USD 79 million, below the USD 347.39 million white-space line
Segment, region and country splits sum to the total in every year from 2020 to 2035. Read more on the DC Market Insights research methodology and on the Data Center Testing Inspection Certification Market.
Table of contents
- 01Introduction
- 1.1Market Definition and Scope
- 1.2Included and Excluded Services
- 1.3Research Approach
- 02Key Market Statistics
- 2.1Market Size 2025, 2026, 2030 and 2035
- 2.2CAGR with Low and High Cases
- 2.3Largest and Fastest Segments
- 2.4Leading Region and Largest Country
- 03Executive Summary
- 3.1Market Snapshot, 2025, 2026 and 2035
- 3.2Market Size, 2020-2035
- 04Market Scope and Estimate Comparison
- 4.1What Data Center Cleaning Services Include
- 4.2Why Estimates Differ
- 4.3Scope Table
- 05Market Drivers
- 5.1ISO 14644 Final Cleans Become a Tender Requirement
- 5.2USD 54.2 Billion of US Data Center Construction in Nine Months
- 5.3Liquid-Cooled AI Halls Raise the Cost of Contamination
- 06Market Trends
- 6.1Slab-Floor AI Halls Move Cleaning Overhead
- 6.2Particle Counts Before and After Every Clean
- 6.3Cleaning Bundled into Integrated Facility Contracts
- 07Market Challenges and Restraints
- 7.1USD 17.71 an Hour Wages and 2% Workforce Growth
- 7.2One Client Can Be a Third of a Segment
- 08Market Opportunities
- 8.1Asia Pacific Commissioning Cleans
- 8.2Testing Programs for Coolant Loops
- 09Pricing Analysis
- 9.1Price per Square Foot and per MW, 2020-2035
- 9.2Public Price Anchors
- 10Standards and Regulation
- 10.1ISO 14644-1:2015
- 10.2ASHRAE TC 9.9 Contamination Guidelines
- 10.3ASHRAE Corrosion Limits
- 10.4ASHRAE Datacom Series
- 11Market Segmentation
- 11.1By Service Type
- 11.2Post-Construction and Pre-Commissioning Cleaning
- 11.3White Space Critical Environment Cleaning
- 11.4Support Space Janitorial
- 11.5Contamination Testing and Remediation
- 11.6By Cleaning Area
- 11.7Raised Floor and Subfloor Plenum
- 11.8White Space Surfaces and Equipment Exteriors
- 11.9Overhead Cable Trays and Ceiling Voids
- 11.10Electrical and Mechanical Rooms
- 11.11Offices Docks and Common Areas
- 11.12By Data Center Type
- 11.13Hyperscale and Cloud
- 11.14Colocation
- 11.15Enterprise
- 11.16Edge and Other
- 11.17By Contract Model
- 11.18Recurring Service Contracts
- 11.19Project-Based Contracts
- 11.20Bundled Integrated Facility Management
- 12DC Exclusive: 50 MW AI Hall Cleaning Cost Teardown
- 12.1Final Clean and ISO 14644 Verification
- 12.2Year-One Recurring Cleaning and Testing
- 13Regional Insights
- 13.1North America
- 13.2Europe
- 13.3Asia Pacific
- 13.4Latin America
- 13.5Middle East and Africa
- 14Country Analysis
- 14.1United States
- 14.2China
- 14.3Japan
- 14.4United Kingdom
- 14.5Germany
- 14.6India
- 14.7Canada
- 14.8France
- 14.9Australia
- 14.10Netherlands
- 14.11Brazil
- 14.12Singapore
- 15Forecast Scenarios
- 15.1Low Scenario
- 15.2Base Scenario
- 15.3High Scenario
- 16Competitive Insights
- 16.1ABM Industries
- 16.2ISS A/S
- 16.3OCS Group
- 16.4Rentokil Initial
- 16.5Pritchard Industries
- 16.6Salute Mission Critical
- 16.7DataSpan
- 16.8Harvard Maintenance
- 16.9Cleanstar National
- 16.10Clean Group
- 16.11Executive Clean
- 16.12Office Pride
- 16.13Provider Concentration, 2025
- 17Recent Developments
- 17.1ABM Industries Fiscal Q3 2026 Results
- 17.2OCS India Tender Requirements
- 17.3OCS UK Cleaning Methods
- 17.4EMCOR Group 2025 Results
- 17.5ISS A/S 2025 Cleaning Revenue
- 17.6US Census Bureau Construction Release
- 18Research Methodology
- 18.1Model Inputs
- 18.2Bound Checks
- Fig. 1Data Center Cleaning Services Market Size, 2020-2035
- Table 1Executive Summary Attributes
- Table 2Scope Comparison
- Table 3Price per Square Foot and per MW, 2020-2035
- Table 4Market by Service Type
- Table 5Market by Cleaning Area
- Table 6Market by Data Center Type
- Table 7Market by Contract Model
- Table 850 MW AI Hall Cleaning Cost Teardown
- Table 9Market by Region
- Table 10Top 12 Countries
- Table 11Forecast Scenarios, 2035
About this report
Written by Amit Jain and reviewed by Deepti Agrawal, Senior Editor, Research. Figures are built top-down and bottom-up and reconciled before publication, with 2025 as the base year.
Read our methodologyHow we built this
- Historical period2020-2024
- Base year2025
- Forecast period2026-2035
- Sizing approachTop-down + bottom-up
Need more than the report?
Advisory on this market
Due diligence, site selection and market entry work, by the analysts who wrote this report.
See consulting servicesFrequently asked questions
USD 1.29 billion in 2026, up 12.52% from USD 1.14 billion in 2025, according to DC Market Insights estimates. The market is projected to reach USD 2.87 billion by 2035, a CAGR of 9.65% from 2025.
9.65% a year from 2025 to 2035, after 10.45% a year from 2020 to 2025, as installed data center capacity grows from 116 GW to 311 GW and new halls need certified final cleans.
USD 1.14 billion of 2025 contracted work: post-construction final cleans, white-space and subfloor plenum cleaning, support-space janitorial, and particle and corrosion testing with remediation. Cleaning products, filters and in-house staff are not counted.
ISO Class 8 under ISO 14644-1, kept at the 95% upper confidence limit, is what ASHRAE TC 9.9 recommends for data halls, with MERV 8 filters for recirculated air and MERV 11 or 13 for incoming air.
About USD 2.20 per square foot for a post-construction final clean and USD 1.10 per white-space square foot a year for recurring cleaning in 2025, DC Market Insights estimates; support space costs about USD 0.95 per square foot a year.
About USD 1.37 million in the first year for a 2026 AI hall, DC Market Insights estimates: USD 0.90 million for the final clean and ISO verification plus USD 0.47 million of year-one recurring cleaning and testing.
Contamination testing and remediation grows fastest at 16.99% a year, from USD 104.40 million in 2025 to USD 501.61 million by 2035, as liquid-cooled AI halls add corrosion-sensitive coolant loops.
North America, with USD 480.01 million or 42.0% of 2025 value. The Middle East and Africa grows fastest at 12.92% a year, and India is the fastest large country at 15.86%.
About 24% of 2025 value sits with the top five, DC Market Insights estimates: ABM Industries, ISS A/S, OCS Group, Rentokil Initial and Pritchard Industries, with specialists such as DataSpan, Salute Mission Critical and Cleanstar National.
USD 1.29 billion in 2026 counts only contracted cleaning inside data center buildings. Estimates that add cleaning products, filters, in-house staff or the whole facility management contract come out larger.
Get this report
How do I get the full report?
Request a quote; we reply by email within one business day.
How and when will I receive the report?
By email, within 24–48 business hours of payment.
How can I pay?
Once you accept the quote, we email you a secure payment link.
Can I see a sample first?
Yes. Request a free sample and we will email it to you.
Can the report be tailored to my needs?
Yes. We can add countries, segments or data cuts. Talk to an analyst about the scope you need.
Can I get an invoice or pay against a purchase order?
Write to sales@dcmarketinsights.com and our team will help.