
Chile Data Center Infrastructure Market Size, Share & Forecast to 2035
Market at a glance
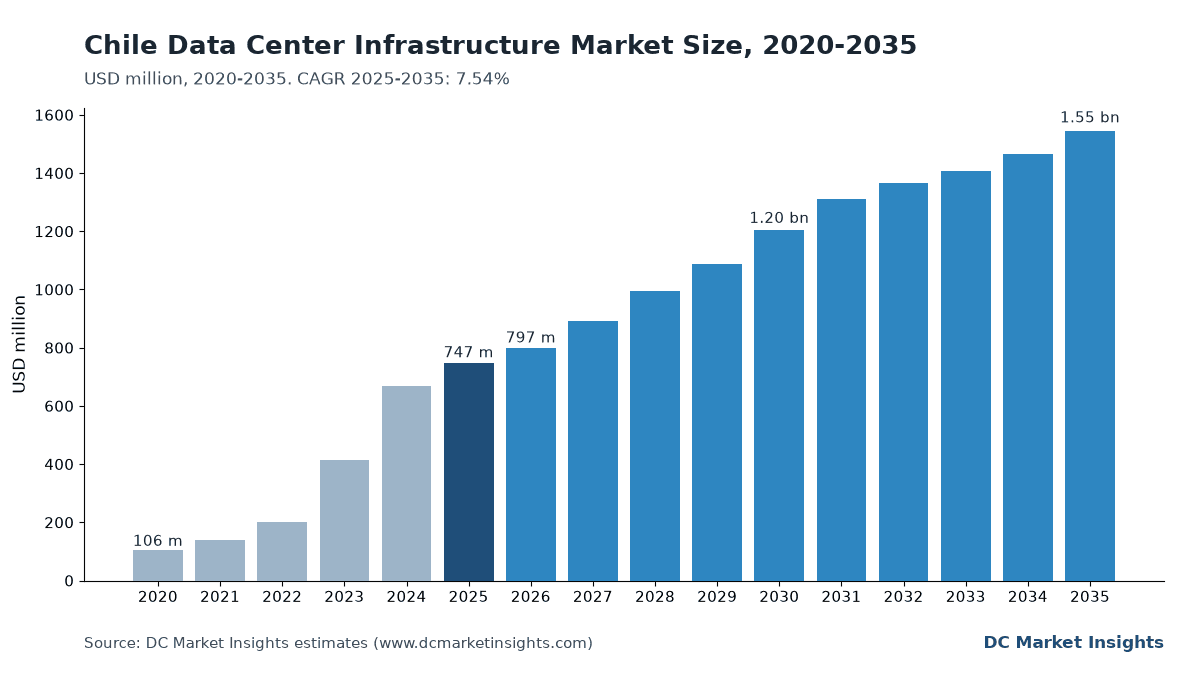
The Chile Data Center Infrastructure market was worth USD 747.0 million in 2025 and is forecast to reach USD 1,550.0 million by 2035, growing at a 7.54% CAGR.
 By Amit Jain, Senior Consultant, ICT & Emerging Technologies
 Reviewed by Deepti Agrawal
Last updated 20 Oct 2026
Base year 2025 PDF + Excel
Key findings
Santiago Substation Capacity and Connection Timing
What is inside the report
- 01Introduction
- 02Executive Summary
- 03Market Dynamics
- 04Pricing Analysis
- 05Laws and Permit Rules
- 06DC Exclusive: Chile Grid-Connection Pipeline Tracker
- 07Market Segmentation
- 08Regional Insights
- 09Hub Analysis
- 10Forecast Scenarios
- 13chapters
- 2020–2024Historical period
- 2026–2035Forecast period
- —Companies profiled
Segmentation
Full analysis
The Chile Data Center Infrastructure Market is valued at USD 797.21 million in 2026 and is projected to reach USD 1.55 billion by 2035, up from USD 747.00 million in 2025, a CAGR of 7.54% from 2025 to 2035 (DC Market Insights estimate). The money in Chile is set by a grid number rather than a demand slogan: the Coordinador Eléctrico Nacional counts about 398 MW of data center capacity installed in 2025 and about 1,381 MW identified by 2030, yet the same operator puts 2025 data center consumption at only 0.9 TWh, an average draw near 103 MW. DC Market Insights assumes 60% of the 983 MW of 2026–2030 additions on that path is energised on time, because Santiago substations, environmental permits and water rules ration how fast halls can be built. The 2025 build receipt is 78.89 MW of booked new IT capacity × USD 8.50 million per MW = USD 670.56 million, plus 254.81 MW of average installed IT load × USD 0.30 million of upgrades = USD 76.44 million. Upgrades and Retrofits grow fastest at 20.68% a year as the 2013–2023 Santiago fleet is re-engineered, and the Valparaíso Region grows fastest at 12.80% a year because the Humboldt cable lands there and the Coordinador places about 155 MW of 2030 capacity in that region.
Key Market Statistics: How Big Is the Chile Data Center Infrastructure Market in 2026?
DC Market Insights values the Chile Data Center Infrastructure Market at USD 797.21 million in 2026, 6.72% above the USD 747.00 million spent in 2025, as the Microsoft Chile Central halls are densified and the Amazon Web Services (AWS) region is fitted out.
- Market size 2025: USD 747.00 million (DC Market Insights estimate).
- Market size 2026: USD 797.21 million.
- Market size 2030: USD 1.20 billion.
- Market size 2035: USD 1.55 billion.
- CAGR 2025–2035: 7.54% in the base case; USD 1.24 billion (low case) to USD 1.81 billion (high case) in 2035.
- Largest infrastructure type: Electrical Infrastructure, USD 307.47 million or 41.16% of 2025 spend.
- Fastest-growing segment: Upgrades and Retrofits at 20.68% a year, rising from 10.23% to 32.40% of spend by 2035.
- Leading region: Santiago Metropolitan Region, 86.0% of 2025 spend; fastest region: Valparaíso Region at 12.80% a year.
- Largest hub: Quilicura, USD 149.40 million in 2025.
- Market leader: Schneider Electric with about 13% of 2025 spend (DC Market Insights assessment); the top five suppliers hold about 44%.
Key Takeaways: What Should Chilean Data Center Builders and Investors Know?
Four findings explain why the Chile Data Center Infrastructure Market more than doubles to USD 1.55 billion by 2035.
- Spend roughly doubles from USD 747.00 million in 2025 to USD 1.55 billion in 2035 because installed IT load rises from 294.81 MW to 1,231.85 MW on the Coordinador connection path.
- Only 26% of the 398 MW installed in 2025 was drawn on average (0.9 TWh), so connection capacity, not floor space, is the scarce good in Santiago.
- Upgrades and Retrofits climb from USD 76.44 million to USD 500.92 million because halls built for 5–8 kW racks must carry 30 kW and more.
- Mechanical and Cooling Infrastructure holds 25.17% of 2025 spend because the Cerrillos ruling pushed new Santiago designs toward water-free air-cooled chillers.
Executive Summary: How Fast Has Chile Data Center Infrastructure Spending Grown Since 2020?
The Chile Data Center Infrastructure Market size was valued at USD 105.57 million in 2020, reached USD 747.00 million in 2025, and is anticipated to reach USD 1.55 billion by 2035, at a CAGR of 7.54% during the forecast period, according to DC Market Insights estimates.
| Attribute | Detail |
|---|---|
| Historical period | 2020–2024 |
| Base year | 2025 |
| Forecast period | 2026–2035 |
| Market size 2025 | USD 747.00 million |
| Market size 2026 | USD 797.21 million |
| CAGR 2025–2035 | 7.54% |
| Market size 2035 | USD 1.55 billion |
| Segments covered | Infrastructure type, project type, data center type, tier rating |
| Regions covered | Santiago Metropolitan, Valparaíso, Northern Chile, Central-South Chile, Southern Chile |
Chile data center infrastructure spend grew 47.90% a year from 2020 to 2025 as installed capacity rose from 198 MW in 2023, the figure in the Ministry of Science National Data Centers Plan, to about 398 MW in 2025 on the Coordinador count. The step to USD 797.21 million in 2026 comes from 105 MW of new facility capacity, led by the AWS South America (Chile) Region, which Amazon ties to a more than USD 4 billion investment and plans to open with three Availability Zones by the end of 2026 (Source: Amazon). Growth settles at 3–9% a year after 2030 as completions hold near 130–140 MW of facility power a year and upgrades take a larger share.
Market Scope: What Counts as Chile Data Center Infrastructure, and Where Does the Chile Data Center Market Begin?
Chile Data Center Infrastructure covers the physical facility layer inside Chilean data centers, worth USD 747.00 million in 2025: the equipment and works that power, cool, house and connect IT racks, in new halls and in upgrades of operating ones.
Included
Electrical infrastructure (on-site substations and medium-voltage switchgear, transformers, uninterruptible power supply (UPS) systems, batteries, busway, power distribution units and diesel standby), mechanical and cooling infrastructure (air-cooled and water-cooled chillers, computer room air handlers, dry coolers, liquid cooling loops and coolant distribution units), civil, structural and architectural works (shell, foundations for the seismic code, raised floors, fire detection and suppression, physical security) and racks, cabling and physical network pathways.
Excluded
Servers, storage and network switches, land, electricity bills, transmission reinforcement outside the site fence, colocation and cloud revenue, and facility management contracts. The boundary with the Chile Data Center Market is simple: that report adds IT hardware and services to the same buildings, so this market is the facility slice of it.
How the Segments Fit Together
The four infrastructure types sum to the market every year; the same total is split again by project type (new build and upgrades), data center type and tier rating, and by five Chilean regions and 12 hubs, each summing to USD 747.00 million in 2025.
Why Do Chile Data Center Infrastructure Market Estimates Differ?
DC Market Insights puts the market at USD 797.21 million in 2026; published figures for the same name differ because they count different layers and read the Chilean capacity pipeline in different ways.
Broader definitions add servers, storage and network equipment, which can double the value, or they add land and the building owner’s margin. Others take the full 1,381 MW Coordinador path to 2030 as built, which would lift 2030 spend well above our base case; DC Market Insights treats that path as identified connection demand and assumes 60% is energised on time. The previous DC Market Insights edition valued 2025 at USD 513.27 million on a smaller capacity base; this edition rebuilds the number bottom-up from megawatts. Out of scope here are IT hardware, telecom towers and fibre backbones, the Humboldt submarine cable itself, cloud services revenue and data center operations services.
| Element | In this report | Why |
|---|---|---|
| Power, cooling, shell, racks and cabling (new build) | Yes, USD 670.56 million in 2025 | Core facility layer |
| Upgrades and retrofits of operating halls | Yes, USD 76.44 million in 2025 | Same equipment bought for existing sites |
| Servers, storage, switches | No | IT line of the Chile Data Center Market |
| Submarine cables and landing stations | No | Telecom infrastructure |
| Colocation rent, electricity | No | Operating revenue, not infrastructure |
Buyers inside scope include hyperscale cloud providers, colocation and wholesale developers, banks and retailers, mining companies with on-site server rooms, government agencies, and small and mid-sized enterprises (SMEs) that build their own rooms.
What Is Driving Data Center Infrastructure Spending in Chile?
Three Chile-specific forces account for most of the USD 4.13 billion of new-build facility spend that DC Market Insights models for 2026–2030 in the Chile Data Center Infrastructure Market.
The Coordinador’s 1,381 MW Connection Path to 2030
The Coordinador Eléctrico Nacional, in its long-term demand projection for 2026–2046 published in October 2026, counts about 398 MW of data center capacity in 2025 and about 1,381 MW by 2030, with roughly 1,225 MW in the Metropolitan Region (Coordinador Eléctrico Nacional). Its yearly path, 552 MW in 2026, 963 MW in 2028 and 1,281 MW in 2029, is the closest thing Chile has to a build queue. DC Market Insights takes 60% of those additions, 590 MW of facility power by 2030, which at USD 8.50–9.61 million per IT MW is the single largest source of spend.
Microsoft’s USD 3.3 Billion and Amazon’s USD 4 Billion Cloud Regions
Microsoft opened Chile Central on 18 June 2025 across three independent locations in the Santiago metro and says about USD 3.3 billion is invested directly in Chile, with renewable power supplied through AES Andes (Microsoft). Amazon announced in May 2025 that it plans to invest more than USD 4 billion for an AWS region with three Availability Zones by the end of 2026 (Source: Amazon). Hyperscale and Cloud data centers therefore take 44.0% of 2025 infrastructure spend, USD 328.68 million.
Ley 21.663 Makes Digital Infrastructure an Essential Service
The Cybersecurity Framework Law, Ley 21.663, published in the Diario Oficial on 8 April 2024, lists digital infrastructure and third-party IT services as essential services and requires incident alerts to the national response team within 3 hours (Diario Oficial). Together with the personal data law Ley 21.719, which takes effect on 1 December 2026 (Source: Servicio de Impuestos Internos), it pushes banks and public bodies toward certified in-country Tier III and Tier IV halls; Tier IV spend rises at 12.00% a year to USD 417.43 million in 2035.
Which Trends Are Changing How Chilean Data Centers Are Built?
Two design shifts move about USD 188.05 million of cooling and USD 307.47 million of electrical spend in the 2025 Chile Data Center Infrastructure Market toward new equipment choices.
Water-Free Air-Cooled Chillers after the Cerrillos Ruling
Google filed in 2022 to swap water cooling towers at its USD 200 million Cerrillos project for air-cooled chillers, and on 26 February 2024 the Segundo Tribunal Ambiental partly annulled the project’s environmental approval and ordered the effects on the Santiago Central aquifer to be assessed (Source: Segundo Tribunal Ambiental). The National Data Centers Plan sets the bar: evaporative cooling uses about 1.8 litres per kWh, while some Chilean sites already reach 0.2 L/kWh (Source: Ministry of Science). DC Market Insights estimates that more than 80% of 2026 Santiago new-build cooling value is closed-loop or air-cooled.
Wholesale Campuses with Their Own Substations in Lampa and Curauma
Developers now buy the high-voltage yard as part of the campus: Scala Data Centers’ USD 328 million financing package covers Curauma, Lampa, Huechuraba 2 and the Nova Lampa substation, with 23 MW of IT capacity already contracted and 30 MW more booked (Source: InvestChile, July 2025). On-site substations add about USD 0.6 million per IT MW to the electrical bill (DC Market Insights estimate), which is one reason Electrical Infrastructure keeps 41–42% of spend through 2035.
Market Restraints: What Holds Back Chile Data Center Infrastructure Projects?
Two constraints cut the 983 MW Coordinador path to the 590 MW that DC Market Insights models by 2030, a gap worth about USD 2.7 billion of Chile data center infrastructure spend.
Santiago Substation Capacity and Connection Timing
About 89% of the 2030 capacity on the Coordinador path sits in the Metropolitan Region, mostly on the city’s outskirts, where each 50–100 MW campus needs its own transformer bank and line works. Chile’s grid is large, 39,647 MW installed against a 13,110 MW peak (Source: Coordinador Eléctrico Nacional, June 2026), but connection works in Lampa, Quilicura and Pudahuel take two to four years; a one-year slip on 100 MW of IT load defers about USD 0.87 billion of spend.
Environmental Permits and the SEA Data Center Criterion
The Servicio de Evaluación Ambiental (SEA) issued its first evaluation criterion for data center projects in January 2026, in force for new submissions from 25 February 2026 (SEA). It brings clearer rules but also more studies on water, noise and standby diesel; the Cerrillos project, with USD 200 million announced in 2019, has stayed on hold since the February 2024 ruling, which DC Market Insights reads as a 12–24 month risk on any contested Santiago site.
Where Are the Opportunities in Chile Data Center Infrastructure?
Two openings add about USD 581 million of yearly spend by 2035 over their 2025 level in the Chile Data Center Infrastructure Market.
Re-Engineering the 2013–2023 Santiago Fleet for Dense Racks
Chile had only 35 MW of data center capacity in 2013 and 198 MW in 2023 (Source: Ministry of Science), and most of that fleet was designed for 5–8 kW racks. DC Market Insights estimates that upgrades rise from 10.23% to 32.40% of market spend between 2025 and 2035 as operators add busway, larger UPS blocks, rear-door and direct-to-chip cooling and stronger floors.
Valparaíso Campuses on the Humboldt Cable Route
Google and Desarrollo País are building Humboldt, the first cable route linking South America directly with Asia-Pacific, from Valparaíso to Australia (Source: Google, January 2024). With Oracle’s Valparaíso cloud region (more than USD 100 million, Source: InvestChile) and Scala’s Curauma campus already there, Valparaíso Region infrastructure spend rises from USD 67.23 million in 2025 to USD 224.18 million in 2035.
How Much Does Data Center Infrastructure Cost per MW in Chile?
DC Market Insights puts Chile data center infrastructure cost at USD 8.50 million per MW of IT load in 2025, before land and servers, rising to USD 10.85 million by 2035.
| Year | Power, cooling and shell (USD m per IT MW) | Racks and cabling (USD m per IT MW) | Total new build (USD m per IT MW) | Upgrades (USD m per installed IT MW-year) |
|---|---|---|---|---|
| 2020 | 7.12 | 0.41 | 7.53 | 0.25 |
| 2025 | 8.05 | 0.45 | 8.50 | 0.30 |
| 2030 | 9.11 | 0.50 | 9.61 | 0.36 |
| 2035 | 10.30 | 0.55 | 10.85 | 0.42 |
Public anchors frame the range: Scala’s USD 328 million package for 53 MW of contracted and booked IT capacity works out to about USD 6.19 million per MW of financing alone (Source: InvestChile), and the National Data Centers Plan counts USD 4.1 billion across 30 projects to 2028 (Source: Ministry of Science). Seismic design under the Chilean building code adds about 4–6% to shell cost compared with a non-seismic site, a DC Market Insights estimate.
Which Laws and Permit Rules Govern Chilean Data Center Builds?
Four instruments shape how the USD 747.00 million Chile Data Center Infrastructure Market of 2025 is designed and permitted.
- Ley 21.663 (Cybersecurity Framework Law, April 2024): digital infrastructure is an essential service, incident alerts within 3 hours and updates within 72 hours, supervised by the Agencia Nacional de Ciberseguridad (ANCI).
- Ley 21.719 (Personal Data Protection Law, published 13 December 2024): takes effect on 1 December 2026, will create the Agencia de Protección de Datos Personales and will raise the bar for where and how personal data is hosted (Source: Servicio de Impuestos Internos).
- SEA evaluation criterion for data center projects, in force since 25 February 2026, sets what the environmental impact system expects on water, energy, noise and emergency generation (Source: SEA).
- National Data Centers Plan 2024–2030 (Ministry of Science): targets a sustainable, water-efficient industry and expects it to triple in five years.
Operators also design to Uptime Institute Tier III and Tier IV topologies, ANSI/TIA-942 and the Chilean seismic standard NCh433, which DC Market Insights counts inside the civil and structural line.
DC Exclusive: Chile Grid-Connection Pipeline Tracker: 398 MW to 1,381 MW, 7 Named Projects
This tracker is a DC Market Insights model: it compares the Coordinador connection path with an estimated DCMI realised path and prices the gap, using 14 inputs; the modelled path adds 590 MW of facility power from 2026 to 2030, worth an estimated USD 4.13 billion of Chile data center infrastructure.
| Year | Coordinador path (MW) | DCMI realised path (MW) | Realised IT MW added | New-build spend (USD m) |
|---|---|---|---|---|
| 2025 | 398 | 398 | 80.00 | 670.56 |
| 2026 | 552 | 503 | 77.78 | 693.59 |
| 2027 | 642 | 613 | 81.48 | 760.34 |
| 2028 | 963 | 733 | 88.89 | 829.96 |
| 2029 | 1,281 | 858 | 92.59 | 885.21 |
| 2030 | 1,381 | 988 | 96.30 | 960.47 |
Named projects behind the path: Microsoft Chile Central (about USD 3.3 billion, open June 2025), the AWS South America (Chile) Region (more than USD 4 billion, due by end-2026), Oracle Valparaíso (more than USD 100 million), Scala’s Curauma, Lampa and Huechuraba 2 campuses (USD 328 million financing), Google Cerrillos (USD 200 million, on hold since 2024), Equinix’s Santiago sites bought from Entel (about USD 735 million for five sites in Chile and Peru, closed May 2022) and Ascenty’s Quilicura campus. Spend in 2025 by region and infrastructure type:
| Region | Electrical (USD m) | Mechanical and Cooling (USD m) | Civil Structural and Architectural (USD m) | Racks Cabling and Physical Network (USD m) |
|---|---|---|---|---|
| Santiago Metropolitan Region | 264.43 | 161.72 | 179.17 | 37.10 |
| Valparaíso Region | 27.67 | 16.92 | 18.75 | 3.88 |
| Northern Chile | 7.69 | 4.70 | 5.21 | 1.08 |
| Central-South Chile | 6.15 | 3.76 | 4.17 | 0.86 |
| Southern Chile | 1.54 | 0.94 | 1.04 | 0.22 |
Which Chile Data Center Infrastructure Segments Carry the Value?
Electrical Infrastructure carries the most value at USD 307.47 million, or 41.16% of the 2025 Chile Data Center Infrastructure Market, while Upgrades and Retrofits is the fastest-growing segment at 20.68% a year.
By Infrastructure Type: Electrical Holds 41.16%
| Infrastructure type | 2025 (USD m) | Share 2025 | 2035 (USD m) | CAGR 2025–2035 |
|---|---|---|---|---|
| Electrical Infrastructure | 307.47 | 41.16% | 652.10 | 7.81% |
| Mechanical and Cooling Infrastructure | 188.05 | 25.17% | 408.27 | 8.06% |
| Civil Structural and Architectural | 208.33 | 27.89% | 382.75 | 6.27% |
| Racks Cabling and Physical Network | 43.14 | 5.78% | 102.92 | 9.08% |
Cooling equipment alone is valued in the Chile Data Center Cooling Market; the mechanical line here also counts piping, pumps and installation works.
By Project Type: Upgrades Grow 20.68% a Year
| Project type | 2025 (USD m) | Share 2025 | 2035 (USD m) | CAGR 2025–2035 |
|---|---|---|---|---|
| New Build | 670.56 | 89.77% | 1,045.13 | 4.54% |
| Upgrades and Retrofits | 76.44 | 10.23% | 500.92 | 20.68% |
By Data Center Type: Colocation and Wholesale Rises to 42.0%
| Data center type | 2025 (USD m) | Share 2025 | 2035 (USD m) | CAGR 2025–2035 |
|---|---|---|---|---|
| Hyperscale and Cloud | 328.68 | 44.0% | 711.18 | 8.02% |
| Colocation and Wholesale | 268.92 | 36.0% | 649.34 | 9.22% |
| Enterprise and Government | 149.40 | 20.0% | 185.53 | 2.19% |
By Tier Rating: Tier IV Gains on Ley 21.663
| Tier rating | 2025 (USD m) | Share 2025 | 2035 (USD m) | CAGR 2025–2035 |
|---|---|---|---|---|
| Tier III | 522.90 | 70.0% | 1,020.39 | 6.91% |
| Tier IV | 134.46 | 18.0% | 417.43 | 12.00% |
| Tier I and II | 89.64 | 12.0% | 108.22 | 1.90% |
Which Chilean Region Leads Data Center Infrastructure Spending, and Which Grows Fastest?
The Santiago Metropolitan Region leads the Chile Data Center Infrastructure Market with USD 642.42 million, 86.0% of 2025 spend, and the Valparaíso Region grows fastest at 12.80% a year to USD 224.18 million in 2035.
Santiago Metropolitan Region
Santiago holds most of the 22 operating facilities counted by the Ministry of Science and about 1,225 MW of the Coordinador’s 2030 path; its spend grows 6.77% a year to USD 1.24 billion in 2035 as Lampa, San Bernardo and Colina take the new campuses.
Valparaíso Region
Valparaíso grows from USD 67.23 million to USD 224.18 million, lifting its share from 9.0% to 14.5%, on the Humboldt landing, Oracle’s Valparaíso region and Scala’s Curauma campus; the Coordinador places about 155 MW there by 2030.
Northern Chile
Antofagasta and the mining north spend USD 18.68 million in 2025, growing 9.52% a year, mostly edge and enterprise rooms beside solar parks that supply 30.7% of national capacity (Source: Coordinador Eléctrico Nacional, August 2025).
Central-South Chile
Concepción and the Biobío corridor spend USD 14.94 million in 2025, rising 7.54% a year with university, port and forestry-sector rooms.
Southern Chile
Puerto Montt and the far south spend USD 3.74 million in 2025, growing 7.54% a year; cool air and wind power attract proposals, but long fibre routes keep volumes small.
Which Santiago Communes and Chilean Cities Host the Most Data Center Infrastructure?
Quilicura is the largest Chile data center infrastructure hub at USD 149.40 million in 2025, and Valparaíso and Curauma is the fastest-growing large hub at 12.80% a year.
| Rank | Hub | Region | 2025 (USD m) | 2035 (USD m) | CAGR 2025–2035 |
|---|---|---|---|---|---|
| 1 | Quilicura | Santiago Metropolitan | 149.40 | 231.91 | 4.50% |
| 2 | Lampa | Santiago Metropolitan | 104.58 | 247.37 | 8.99% |
| 3 | Other Santiago communes | Santiago Metropolitan | 97.11 | 139.14 | 3.66% |
| 4 | Pudahuel | Santiago Metropolitan | 89.64 | 170.06 | 6.61% |
| 5 | San Bernardo | Santiago Metropolitan | 74.70 | 170.06 | 8.57% |
| 6 | Valparaíso and Curauma | Valparaíso | 67.23 | 224.18 | 12.80% |
| 7 | Huechuraba | Santiago Metropolitan | 59.76 | 108.22 | 6.12% |
| 8 | Colina | Santiago Metropolitan | 44.82 | 108.22 | 9.22% |
| 9 | Cerrillos | Santiago Metropolitan | 22.41 | 61.84 | 10.68% |
| 10 | Antofagasta | Northern Chile | 18.68 | 46.38 | 9.52% |
| 11 | Concepción | Central-South Chile | 14.94 | 30.92 | 7.54% |
| 12 | Puerto Montt and other southern cities | Southern Chile | 3.74 | 7.73 | 7.54% |
Lampa overtakes Quilicura by 2035, USD 247.37 million against USD 231.91 million, because Scala’s 120 MW Lampa campus and its Nova Lampa substation give it the largest single connection in the country.
How Could the Chile Data Center Infrastructure Forecast Diverge by 2035?
The 2035 value of the Chile Data Center Infrastructure Market ranges from USD 1.24 billion to USD 1.81 billion around the USD 1.55 billion base case, depending on how much of the Coordinador path is energised.
| Scenario | Assumption | 2035 (USD m) |
|---|---|---|
| Low | 40% of 2026–2030 Coordinador additions energised; post-2030 completions 20% lower | 1,237.13 |
| Base | 60% energised; 988 MW installed in 2030 and 1,663 MW in 2035 | 1,546.04 |
| High | 85% energised; post-2030 completions 15% higher | 1,808.56 |
Which Suppliers Lead Chile Data Center Infrastructure?
Schneider Electric leads Chilean data center infrastructure supply with about 13% of 2025 spend and the top five suppliers hold about 44% (DC Market Insights assessment based on installed-base references and local service networks).
- Schneider Electric
- Vertiv
- ABB
- Eaton
- Siemens
- Legrand
- Rittal
- Johnson Controls
- Trane Technologies
- Carrier
- Daikin
- Stulz
- Caterpillar
- Cummins
- Huawei Digital Power
Developers and owners such as Microsoft, AWS, Google, Oracle, Equinix, Scala Data Centers, Ascenty, EdgeConneX and Sonda buy through general contractors and specify the brands; Equinix paid about USD 735 million for five Entel data centers in 2022 (Source: Equinix). Regional cooling demand for the same buildings is covered in the Latin America Data Center Cooling Market.
Which Dated Events Since 2024 Shape Chilean Data Center Construction?
Six dated events since 2024 set the 2026–2030 build curve of the Chile Data Center Infrastructure Market.
- In February 2024, the Segundo Tribunal Ambiental partly annulled the environmental approval of Google’s Cerrillos data center (Source: Segundo Tribunal Ambiental).
- In April 2024, Ley 21.663 named digital infrastructure an essential service (Source: Diario Oficial).
- In May 2025, Amazon announced more than USD 4 billion for an AWS region in Chile (Source: Amazon).
- In June 2025, Microsoft opened Chile Central with about USD 3.3 billion invested (Source: Microsoft).
- In February 2026, the SEA data center evaluation criterion came into force (Source: SEA).
- In October 2026, the Coordinador projected about 1,381 MW of data center capacity by 2030 (Source: Coordinador Eléctrico Nacional).
Methodology: How the Chile Model Turns Grid Megawatts into Infrastructure Spend
The model converts 1,663 MW of Chilean facility capacity in 2035 into 1,231.85 MW of IT load at a design power usage effectiveness (PUE) of 1.35, prices each new megawatt and each installed megawatt, and gives USD 747.00 million in 2025 and USD 1.55 billion in 2035.
- Capacity: 198 MW of facility capacity in 2023 (Ministry of Science), 398 MW in 2025 (Coordinador), 988 MW in 2030 (60% of the Coordinador additions) and 1,663 MW in 2035; new capacity booked 50/50 in the completion year and the year before.
- Unit values: power, cooling and shell USD 8.05 million per IT MW in 2025 (+2.5% a year), racks and cabling USD 0.45 million (+2%), upgrades USD 0.30 million per installed IT MW-year (+3.5%), all DC Market Insights estimates.
- Splits: electrical 43%, mechanical 26% and civil 31% of new-build facility value; upgrades 45/30/15/10 across the four types; regions follow the Coordinador’s 89% Metropolitan share for 2030.
Three bound checks: (1) 988 MW installed in 2030 sits at 72% of the 1,381 MW Coordinador path (ceiling); (2) USD 4.13 billion of 2026–2030 new-build facility spend is 56% of the USD 7.3 billion that Microsoft and Amazon alone have announced, which also covers servers and land (ceiling); (3) 2025 new-build spend of USD 670.56 million exceeds one-fifth of the USD 2.9 billion of projects in execution counted by the Ministry of Science (floor). The full approach is in our research methodology.
Table of contents
- 01Introduction
- 1.1Market Definition and Scope
- 1.2Included, Excluded and How the Segments Fit Together
- 1.3Boundary with the Chile Data Center Market
- 1.4Why Estimates Differ
- 02Executive Summary
- 2.1Market Snapshot, 2025, 2026 and 2035
- 2.2Key Market Statistics
- 2.3Key Takeaways
- 03Market Dynamics
- 3.1Driver: The Coordinador's 1,381 MW Connection Path to 2030
- 3.2Driver: Microsoft's USD 3.3 Billion and Amazon's USD 4 Billion Cloud Regions
- 3.3Driver: Ley 21.663 Makes Digital Infrastructure an Essential Service
- 3.4Trend: Water-Free Air-Cooled Chillers after the Cerrillos Ruling
- 3.5Trend: Wholesale Campuses with Their Own Substations in Lampa and Curauma
- 3.6Restraint: Santiago Substation Capacity and Connection Timing
- 3.7Restraint: Environmental Permits and the SEA Data Center Criterion
- 3.8Opportunity: Re-Engineering the 2013–2023 Santiago Fleet for Dense Racks
- 3.9Opportunity: Valparaíso Campuses on the Humboldt Cable Route
- 04Pricing Analysis
- 4.1Facility Cost per IT MW, 2020, 2025, 2030 and 2035
- 4.2Upgrade Cost per Installed IT MW-Year
- 4.3Public Price Anchors
- 05Laws and Permit Rules
- 5.1Ley 21.663 Cybersecurity Framework Law
- 5.2Ley 21.719 Personal Data Protection Law
- 5.3SEA Data Center Evaluation Criterion
- 5.4National Data Centers Plan 2024–2030
- 5.5Tier Topologies, ANSI/TIA-942 and NCh433
- 06DC Exclusive: Chile Grid-Connection Pipeline Tracker
- 6.1Coordinador Path vs DCMI Realised Path, 2025–2030
- 6.27 Named Projects
- 6.3Region × Infrastructure Type Matrix, 2025
- 07Market Segmentation
- 7.1By Infrastructure Type: Electrical Infrastructure, Mechanical and Cooling Infrastructure, Civil Structural and Architectural, Racks Cabling and Physical Network
- 7.2By Project Type: New Build, Upgrades and Retrofits
- 7.3By Data Center Type: Hyperscale and Cloud, Colocation and Wholesale, Enterprise and Government
- 7.4By Tier Rating: Tier III, Tier IV, Tier I and II
- 08Regional Insights
- 8.1Santiago Metropolitan Region
- 8.2Valparaíso Region
- 8.3Northern Chile
- 8.4Central-South Chile
- 8.5Southern Chile
- 09Hub Analysis
- 9.1Quilicura, Lampa, Other Santiago Communes, Pudahuel, San Bernardo, Valparaíso and Curauma
- 9.2Huechuraba, Colina, Cerrillos, Antofagasta, Concepción, Puerto Montt and Other Southern Cities
- 10Forecast Scenarios
- 10.1Low, Base and High Cases to 2035
- 11Competitive Insights
- 11.1Schneider Electric, Vertiv, ABB, Eaton, Siemens
- 11.2Legrand, Rittal, Johnson Controls, Trane Technologies, Carrier
- 11.3Daikin, Stulz, Caterpillar, Cummins, Huawei Digital Power
- 11.4Supplier Concentration, 2025
- 12Recent Developments
- 12.1Dated Events, February 2024 to October 2026
- 13Methodology
- 13.1Capacity Base and PUE Conversion
- 13.2Unit Values and Splits
- 13.3Three Bound Checks
- Fig. 1Chile Data Center Infrastructure Market Size, 2020–2035 (USD Million)
- Table 1Report Attributes
- Table 2Scope Comparison
- Table 3Facility Cost per IT MW, 2020–2035
- Table 4Coordinador Path vs DCMI Realised Path, 2025–2030
- Table 5Region × Infrastructure Type, 2025
- Table 6By Infrastructure Type
- Table 7By Project Type
- Table 8By Data Center Type
- Table 9By Tier Rating
- Table 10Top 12 Hubs
- Table 11Forecast Scenarios, 2035
About this report
Written by Amit Jain and reviewed by Deepti Agrawal, Senior Editor, Research. Figures are built top-down and bottom-up and reconciled before publication, with 2025 as the base year.
Read our methodologyHow we built this
- Historical period2020–2024
- Base year2025
- Forecast period2026–2035
- Sizing approachTop-down + bottom-up
Need more than the report?
Advisory on this market
Due diligence, site selection and market entry work, by the analysts who wrote this report.
See consulting servicesFrequently asked questions
USD 797.21 million in 2026, 6.72% above USD 747.00 million in 2025, according to DC Market Insights estimates. The market is projected to reach USD 1.55 billion by 2035, a CAGR of 7.54% from 2025.
7.54% a year from 2025 to 2035, after 47.90% a year from 2020 to 2025, because installed data center capacity rose from 198 MW in 2023 to about 398 MW in 2025 and keeps rising on the Coordinador Eléctrico Nacional path.
About 398 MW in 2025, according to the Coordinador Eléctrico Nacional, which identifies about 1,381 MW by 2030. DC Market Insights models 988 MW installed in 2030, assuming 60% of the planned additions are energised on time.
USD 8.50 million per MW of IT load in 2025 for power, cooling, shell, racks and cabling, before land and servers, rising to USD 10.85 million by 2035 (DC Market Insights estimate).
Electrical Infrastructure, with USD 307.47 million or 41.16% of 2025 spend, because every hall needs on-site substations, switchgear, UPS systems and diesel standby. Upgrades and Retrofits grow fastest at 20.68% a year.
The Santiago Metropolitan Region, with USD 642.42 million or 86.0% of 2025 spend, led by Quilicura, Lampa and Pudahuel. The Valparaíso Region grows fastest at 12.80% a year on the Humboldt cable route.
Schneider Electric leads with about 13% of 2025 spend, and the top five suppliers, with Vertiv, ABB, Eaton and Siemens, hold about 44% (DC Market Insights assessment). Microsoft, AWS, Google, Oracle, Equinix and Scala Data Centers are the main buyers.
Four instruments: Ley 21.663 (April 2024) makes digital infrastructure an essential service, Ley 21.719 protects personal data from 1 December 2026, the SEA data center criterion applies from 25 February 2026, and the National Data Centers Plan runs to 2030.
USD 747.00 million in 2025 covers only the facility layer: power, cooling, shell, racks and cabling. The Chile Data Center Market also counts servers, storage, network equipment and services in the same buildings.
USD 797.21 million in 2026 is the DC Market Insights figure for the facility layer only, with 60% of the Coordinador capacity path built on time. Estimates that add IT hardware, land or the full 1,381 MW path come out higher.
Get this report
How do I get the full report?
Request a quote; we reply by email within one business day.
How and when will I receive the report?
By email, within 24-48 business hours of payment.
How can I pay?
Once you accept the quote, we email you a secure payment link.
Can I see a sample first?
Yes. Request a free sample and we will email it to you.
Can the report be tailored to my needs?
Yes. We can add countries, segments or data cuts. Talk to an analyst about the scope you need.
Can I get an invoice or pay against a purchase order?
Write to sales@dcmarketinsights.com and our team will help.