
Edge Computing Market Size, Share & Forecast to 2035
Market at a glance
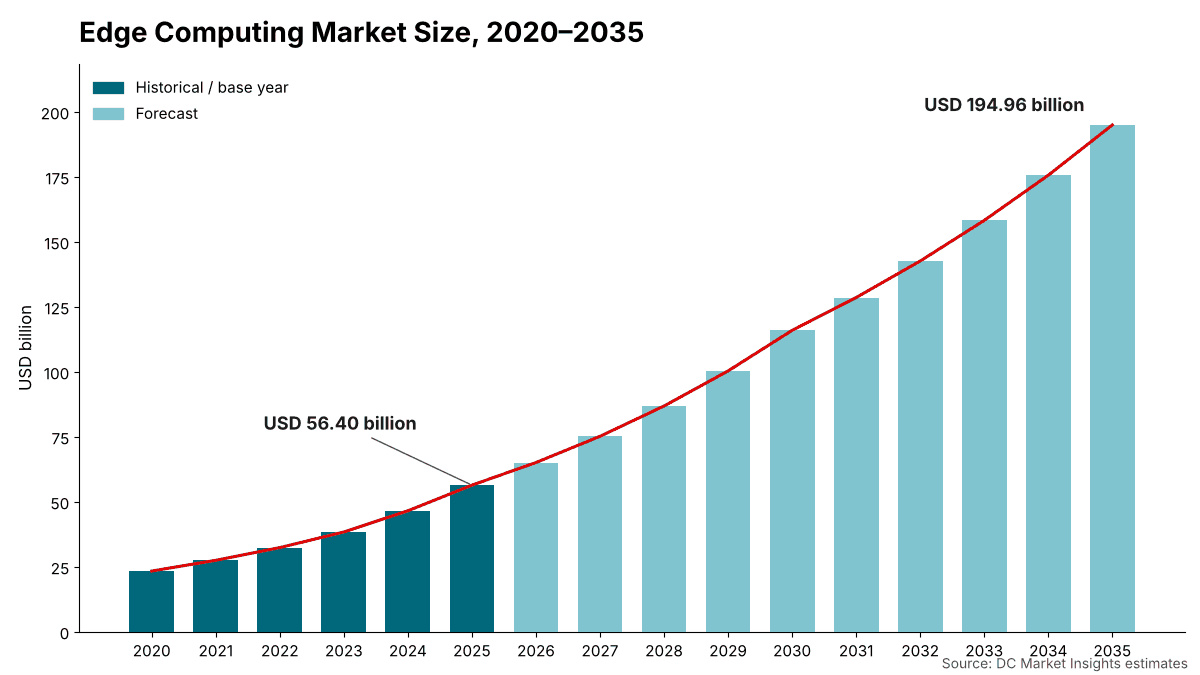
The Edge Computing market was worth USD 56.40 billion in 2025 and is forecast to reach USD 194.96 billion by 2035, growing at a 13.21% CAGR. North America accounts for 38.6% of the market.
 By Amit Jain, Senior Consultant, ICT & Emerging Technologies
 Reviewed by Deepti Agrawal
Last updated 6 Oct 2026
Base year 2025 PDF + Excel
Reviewed by Deepti Agrawal
Last updated 6 Oct 2026
Base year 2025 PDF + Excel
Source: DC Market Insights analysis
Key findings
AI Inference Spending at the Edge Grows 18.86% a Year to USD 72.33 Billion by 2035
Content Delivery Networks Become Edge Compute Platforms
Telco and Tower Edge Has Developed Slower Than Expected
Manufacturing Reaches USD 44.64 Billion by 2035
What is inside the report
- 01Introduction
- 02Research Methodology
- 03Executive Summary
- 04Market Dynamics
- 05Pricing Analysis
- 06Standards and Regulation
- 07Supply Chain and Ecosystem
- 08Market Size and Forecast
- 09Edge Computing Market, By Component
- 10Edge Computing Market, By Edge Tier
- 20chapters
- 2020-2024Historical period
- 2026-2035Forecast period
- 17Companies profiled
Regional insights
- North America38.6%
- Asia Pacific30.4%
- Europe22.1%
- Latin America4.6%
- Middle East and Africa4.3%
Segmentation
Companies profiled
- Hewlett Packard Enterprise (HPE)
- Dell Technologies
- Cisco
- Lenovo
- Siemens
- NVIDIA
- Intel
- Amazon Web Services (AWS)
- Microsoft
- Google Cloud
- Akamai
- Cloudflare
- Fastly
- Equinix
- American Tower (CoreSite)
- Huawei
- Schneider Electric
Recent developments
Hewlett Packard Enterprise completed its acquisition of Juniper Networks, a transaction it said doubles the size of its networking business (Source: HPE SEC filing).
NVIDIA made Jetson AGX Thor available, with up to 2,070 FP4 teraflops of AI compute within a 130-watt power envelope and a developer kit starting at USD 3,499 (Source: NVIDIA press release).
Akamai launched Akamai Inference Cloud with NVIDIA RTX PRO Servers, targeting 20 initial locations on a network of more than 4,200 locations (Source: Akamai SEC filing).
Siemens made its Industrial AI Suite generally available on Industrial Edge and announced IEC 62443-4-2-certified security functions for the second half of 2026 (Source: Siemens press release).
I Squared Capital launched a US AI inference and edge colocation data center platform with a commitment of up to USD 1.00 billion, starting with an agreement to acquire about 53 MW across 10 facilities (Source: IREI news report).
Duos Edge AI agreed to provide 10 MW of capacity in Columbus, Georgia, to an investment-grade hyperscaler in a deal worth more than USD 111.00 million over five years (Source: Data Center Dynamics news report).
Full analysis
The Edge Computing Market covers the hardware, software and services used to process data outside centralized cloud and hyperscale data centers: edge servers, gateways and AI inference systems at factories, stores, hospitals and branch sites; edge platforms and orchestration software; network and telco edge services such as multi-access edge computing (MEC) and edge cloud platforms; and the regional and micro data centers built close to users. DC Market Insights values the global Edge Computing Market at USD 56.40 billion in 2025 and forecasts USD 194.96 billion by 2035, a CAGR of 13.21%. The 2025 value is built from three layers: about 2.35 million on-premise edge servers and gateways at an average of about USD 8,400 each, plus the software and services sold with them, give USD 33.56 billion; network and telco edge services add USD 11.80 billion; and about 1,150 MW of new regional edge data center capacity at about USD 9.60 million per MW adds USD 11.04 billion. AI inference and computer vision is the fastest-growing application at 18.86% a year because trained models now run next to cameras, machines and users rather than in a distant cloud region, and the Middle East and Africa is the fastest-growing region at 16.42% a year as buyers add edge capacity from a small base.
Executive Summary
The Global Edge Computing Market size was valued at USD 23.36 billion in 2020, reached USD 56.40 billion in 2025, and is anticipated to reach USD 194.96 billion by 2035, at a CAGR of 13.21% during the forecast period.
| Report attribute | Details |
|---|---|
| Historical Period | 2020-2024 |
| Base Year | 2025 |
| Forecast Period | 2026-2035 |
| Edge Computing Market Size 2025 | USD 56.40 Billion |
| Edge Computing Market, CAGR | 13.21% |
| Edge Computing Market Size 2035 | USD 194.96 Billion |
The market grew at 19.28% a year between 2020 and 2025, and 2025 alone added 21.2% over the USD 46.53 billion of 2024 as enterprises moved video analytics, machine control and AI inference onto local servers. DC Market Insights estimates that on-premise edge server and gateway shipments rose from about 1.30 million units in 2020 to 2.35 million in 2025, while the average unit price climbed from about USD 7,100 to USD 8,400 as more systems shipped with graphics processing units (GPUs) and AI accelerators. Growth slows to 13.21% a year from 2025 to 2035 because the installed base is larger, but the market still more than triples as unit shipments reach about 5.60 million and network edge services grow more than fourfold.
Market Scope: What Does the Edge Computing Market Cover?
The Edge Computing Market covers spending on compute infrastructure, software and services located between the device and the centralized cloud, valued at first sale in current US dollars, with 2025 as the base year and forecasts to 2035. DC Market Insights sizes it at USD 56.40 billion in 2025.
Included. Edge servers, ruggedized and short-depth servers, industrial PCs used as compute nodes, edge gateways and AI inference appliances; edge operating systems, virtualization, container orchestration, device management and AI runtime software; network and telco edge services, including MEC platforms, edge cloud compute, serverless edge functions and AI inference sold as a service from distributed points of presence; regional, micro and tower-site edge data centers, counted as the infrastructure fit-out per MW; and the design, integration and managed services sold with these products.
Excluded. Smartphones, PCs, consumer devices and sensors themselves; centralized public cloud regions and hyperscale campuses; content delivery and security revenue that does not run customer compute at the edge; connectivity charges such as mobile data plans; and land and utility connections for edge data centers.
How the segments fit together. The component, edge tier, application and end-use splits each re-cut the same USD 56.40 billion total. The edge tier split follows the three layers of the model: on-premise enterprise edge is counted in units, network and telco edge in service revenue, and regional edge data centers in MW of new capacity.
Market Drivers: What Drives the Edge Computing Market?
Three drivers explain most of the growth in the Edge Computing Market: AI inference moving closer to users, 5G networks that now carry almost half of mobile traffic, and unit prices that rise as edge systems carry accelerators. Together they lift the market by USD 138.56 billion between 2025 and 2035.
AI Inference Spending at the Edge Grows 18.86% a Year to USD 72.33 Billion by 2035
AI inference and computer vision accounts for USD 12.85 billion of spending in 2025 and USD 72.33 billion by 2035, rising from 22.8% to 37.1% of the market. Edge platform providers are already adding GPUs to distributed networks. Akamai launched Akamai Inference Cloud in October 2025 to expand inference “from core data centers to the edge of the internet”, using NVIDIA RTX PRO Servers with RTX PRO 6000 Blackwell Server Edition GPUs and BlueField-3 data processing units, and targeting 20 initial locations across a network of more than 4,200 locations (Source: Akamai filing with the US Securities and Exchange Commission). Akamai’s Cloud Infrastructure Services revenue rose 36% to USD 314.00 million in 2025, and the company said that growth benefited from customer interest in the new inference platform.
5G Carries 48% of Mobile Traffic and Opens the Network Edge
The Ericsson Mobility Report of June 2026 counted 3.1 billion 5G subscriptions at the end of the first quarter of 2026, after 162 million were added in that quarter, and forecasts 6.4 billion by the end of 2031 (Source: Ericsson press release). The same report says 5G networks handled 48 percent of all mobile data traffic at the end of 2025, and that 43 out of 55 service providers measured faster uplink growth than downlink. Network and telco edge services rise from USD 11.80 billion in 2025 to USD 52.00 billion in 2035 in our model, the fastest-growing edge tier at 15.99% a year.
Average Edge System Prices Rise from USD 8,400 to USD 10,900
Edge hardware is moving from simple gateways to accelerated computers. NVIDIA’s Jetson AGX Thor offers up to 2,070 FP4 teraflops of AI compute within a 130-watt power envelope, which NVIDIA says is up to 7.5 times the AI compute of Jetson Orin, and the developer kit starts at USD 3,499. The average price of an on-premise edge server or gateway is about USD 8,400 in 2025 and reaches USD 10,900 by 2035 in our model, so hardware value grows faster than unit shipments, which rise at 9.07% a year.
Market Trends: How Is Edge Computing Supply Changing?
Edge computing supply is shifting from content caching and remote gateways toward distributed AI inference and edge colocation, with software the fastest-growing component at 15.15% a year.
Content Delivery Networks Become Edge Compute Platforms
Companies that built networks to cache web content now sell compute on them. Cloudflare reported fiscal year 2025 revenue of USD 2.17 billion, up 30%, and its annual report says its network spans more than 330 cities in over 125 countries and interconnects with over 13,000 networks (Source: Cloudflare annual report filed with the SEC). Fastly reported 2025 revenue of USD 624.00 million, up 15%. In the DC Market Insights model only the compute part of such platforms counts toward the Edge Computing Market, so the three edge platforms named here, with combined 2025 revenue of USD 3.11 billion across their full businesses, equal about 26.3% of the network edge tier.
Investors Assemble Edge Colocation Platforms for AI Inference
I Squared Capital has launched a US AI inference and edge colocation data center platform with a commitment of up to USD 1.00 billion, starting with an agreement to acquire from Cogent Fiber, for USD 225.00 million, 10 data center facilities with approximately 53 megawatts of installed power capacity and 259,000 square feet of colocation space. Duos Edge AI has agreed to provide 10 MW to an investment-grade hyperscaler in Columbus, Georgia, in a deal worth more than USD 111.00 million over a five-year term. Regional edge data centers account for USD 11.04 billion of spending in 2025 and USD 32.48 billion by 2035 in our model.
Industrial Edge Platforms Add AI and Certified Security
Industrial edge software platforms are adding AI functions. Siemens has made its Industrial AI Suite and WinCC Unified generally available on its Industrial Edge ecosystem and announced IEC 62443-4-2-certified security functions for critical infrastructures, including air-gapped operation, targeted for the second half of 2026. Software rises from 16.2% of the Edge Computing Market in 2025 to 19.2% in 2035 as such platforms carry more of the value of each site.
Market Challenges: What Holds the Edge Computing Market Back?
Slow telco edge monetization and the cost of managing thousands of small sites are the two constraints on the Edge Computing Market, holding regional edge data centers to 11.39% a year, the slowest edge tier.
Telco and Tower Edge Has Developed Slower Than Expected
American Tower, which operates 28 CoreSite data centers across 11 US markets and five Access Edge colocation sites at tower locations, has said that edge “is developing slower than we thought it was going to”, while still describing it as a compelling play that will develop over time. DC Market Insights therefore assumes new regional edge data center capacity grows from about 1,150 MW in 2025 to 2,050 MW in 2030 and 2,900 MW in 2035, a gentler path than for on-premise edge.
Fragmented Sites Raise Operating Cost
Services, which cover integration, remote management and maintenance, take 32.6% of 2025 spending in the DC Market Insights model, because the cost of operating many small sites is a large share of total cost of ownership. Remote monitoring and other legacy applications grow only 7.64% a year as buyers consolidate older gateways onto fewer, more capable platforms.
Market Opportunities: Where Are the New Revenue Pools?
The largest new revenue pools in the Edge Computing Market are AI inference, which adds USD 59.48 billion of annual spend by 2035, and transportation and logistics, the fastest-growing end use at 15.46% a year.
Manufacturing Reaches USD 44.64 Billion by 2035
Manufacturing is the largest end use, with USD 13.30 billion in 2025 and USD 44.64 billion in 2035, a CAGR of 12.87%. Machine vision, quality inspection and robot control need decisions within milliseconds, so 80% of manufacturing edge spending stays on-premise in the DC Market Insights matrix. Factory-built enclosures that house this equipment are covered in the Modular Data Center Market report.
Transportation and Connected Vehicles Grow Fastest
Transportation and logistics spend USD 4.91 billion in 2025 and reach USD 20.67 billion by 2035, while connected and autonomous vehicle applications grow 16.46% a year, from USD 3.78 billion to USD 17.35 billion. Roadside, depot and port sites often need mobile or containerized compute, the segment analyzed in the Micro-mobile Data Center Market report.
Data Rules Favor Open, Portable Edge Platforms
The EU Data Act entered into force on 11 January 2024 and into application on 12 September 2025, giving users more control over the data generated by connected devices such as cars and industrial machinery and making it easier to switch between cloud providers (Source: European Commission Data Act page). Its recitals describe edge computing as a form of highly distributed data processing that should be open and interoperable from the outset. Edge software and services that keep data local and portable are worth USD 27.53 billion in 2025 and USD 105.34 billion by 2035.
Pricing: How Much Does Edge Computing Cost per Site and per MW?
In the Edge Computing Market, an on-premise edge server or gateway sells for about USD 8,400 on average in 2025, and a regional edge data center costs about USD 9.60 million per MW of new capacity to fit out. These are DC Market Insights estimates; hardware prices exclude software and services, and per-MW costs exclude IT equipment, land and utility connections.
| Edge pricing indicator | 2020 | 2025 | 2030 | 2035 |
|---|---|---|---|---|
| Average on-premise edge system price (USD) | 7,100 | 8,400 | 9,700 | 10,900 |
| Software spend per USD of edge hardware | 0.26 | 0.32 | 0.36 | 0.41 |
| Regional edge data center cost per MW (USD million) | 8.10 | 9.60 | 10.40 | 11.20 |
The average system price rose about 3.4% a year between 2020 and 2025 as accelerators entered mainstream edge servers, and DC Market Insights expects about 2.6% a year after 2025 as accelerator prices per unit of compute fall. The Duos Edge AI agreement implies a lease value of at least about USD 2.22 million per MW per year, a useful cross-check on edge colocation economics.
Standards and Regulation: Which Rules Shape Edge Computing?
Three sets of rules shape how edge computing is built and sold: the ETSI multi-access edge computing specifications, the IEC 62443 industrial security series and the EU Data Act.
ETSI MEC. The European Telecommunications Standards Institute (ETSI) Industry Specification Group on Multi-access Edge Computing defines MEC as offering application developers and content providers cloud-computing capabilities and an IT service environment at the edge of the network, with ultra-low latency, high bandwidth and real-time access to radio network information.
IEC 62443-4-2. Security certification is becoming part of the industrial edge offer; Siemens, for example, says the security functions it is adding to Industrial Edge, including air-gapped operation, are IEC 62443-4-2-certified.
EU Data Act. Regulation (EU) 2023/2854 applies from 12 September 2025 and covers access to connected-product data and switching between data processing services, which its recitals say include highly distributed edge computing.
Market Segmentation: Which Segment Leads the Edge Computing Market?
Hardware leads the Edge Computing Market with 51.2% of 2025 value, on-premise enterprise edge leads edge tiers with 59.5%, AI inference and computer vision leads applications with 22.8%, and manufacturing leads end uses with 23.6%. AI inference and computer vision is the fastest-growing segment at 18.86% a year, because accelerated edge systems let buyers run trained models next to cameras and machines rather than paying to move video and sensor data to the cloud.
By Component: Hardware Leads with 51.2%
| Component | 2025 (USD billion) | Share 2025 | 2035 (USD billion) | CAGR 2025-2035 |
|---|---|---|---|---|
| Hardware | 28.87 | 51.2% | 89.62 | 11.99% |
| Software | 9.15 | 16.2% | 37.51 | 15.15% |
| Services | 18.38 | 32.6% | 67.83 | 13.95% |
Software grows fastest as orchestration, AI runtime and security subscriptions attach to every node.
By Edge Tier: On-Premise Enterprise Edge Leads with 59.5%
| Edge tier | 2025 (USD billion) | Share 2025 | 2035 (USD billion) | CAGR 2025-2035 |
|---|---|---|---|---|
| On-Premise Enterprise Edge | 33.56 | 59.5% | 110.48 | 12.65% |
| Network and Telco Edge | 11.80 | 20.9% | 52.00 | 15.99% |
| Regional Edge Data Centers | 11.04 | 19.6% | 32.48 | 11.39% |
Network and telco edge gains 5.8 points of share by 2035.
By Application: AI Inference and Computer Vision Leads with 22.8%
| Application | 2025 (USD billion) | Share 2025 | 2035 (USD billion) | CAGR 2025-2035 |
|---|---|---|---|---|
| AI Inference and Computer Vision | 12.85 | 22.8% | 72.33 | 18.86% |
| Industrial IoT and Automation | 12.07 | 21.4% | 36.65 | 11.75% |
| Content Delivery and Edge Cloud Services | 10.55 | 18.7% | 29.63 | 10.88% |
| Smart Retail and Venues | 6.32 | 11.2% | 16.38 | 9.99% |
| Connected and Autonomous Vehicles | 3.78 | 6.7% | 17.35 | 16.46% |
| Remote Monitoring and Other Applications | 10.83 | 19.2% | 22.62 | 7.64% |
AI inference and computer vision rises from 22.8% of the market in 2025 to 37.1% by 2035, while remote monitoring and other applications fall from 19.2% to 11.6%.
By End Use: Manufacturing Leads with 23.6%
| End use | 2025 (USD billion) | Share 2025 | 2035 (USD billion) | CAGR 2025-2035 |
|---|---|---|---|---|
| Manufacturing | 13.30 | 23.6% | 44.64 | 12.87% |
| Telecom and IT | 11.17 | 19.8% | 41.72 | 14.09% |
| Retail and Consumer Goods | 7.39 | 13.1% | 21.25 | 11.14% |
| Energy and Utilities | 5.30 | 9.4% | 20.08 | 14.25% |
| Transportation and Logistics | 4.91 | 8.7% | 20.67 | 15.46% |
| Healthcare | 4.12 | 7.3% | 15.79 | 14.38% |
| Government and Defense | 3.89 | 6.9% | 12.48 | 12.36% |
| BFSI and Others | 6.32 | 11.2% | 18.33 | 11.24% |
Energy and utilities grow at 14.25% a year as grid operators add substation and distributed energy control at the edge, and healthcare grows at 14.38% as imaging and patient monitoring move to local inference.
DC Exclusive: The Three-Layer Edge Build Model and End Use × Edge Tier Matrix
At USD 10.61 billion in 2025, on-premise edge in manufacturing is the single largest cell of the matrix and 18.8% of all edge computing spending. The matrix below cross-tabulates who buys and where the compute sits. It is a DC Market Insights model, not a shipment count: it is built from 141 inputs: 16 annual unit cohorts, 16 average system prices, 16 software ratios, 16 services ratios, 16 network edge service values, 16 regional edge MW cohorts, 16 cost-per-MW values (2020 to 2035 for each), 24 matrix seed weights (3 edge tiers for each of 8 end uses) and 5 company disclosures used as cross-checks.
| 2025, USD billion | On-Premise Enterprise Edge | Network and Telco Edge | Regional Edge Data Centers | Total |
|---|---|---|---|---|
| Manufacturing | 10.61 | 1.09 | 1.60 | 13.30 |
| Telecom and IT | 2.76 | 5.21 | 3.20 | 11.17 |
| Retail and Consumer Goods | 5.12 | 1.36 | 0.91 | 7.39 |
| Energy and Utilities | 4.03 | 0.52 | 0.75 | 5.30 |
| Transportation and Logistics | 3.21 | 0.99 | 0.71 | 4.91 |
| Healthcare | 2.73 | 0.55 | 0.84 | 4.12 |
| Government and Defense | 2.41 | 0.45 | 1.03 | 3.89 |
| BFSI and Others | 2.69 | 1.63 | 2.00 | 6.32 |
| Total | 33.56 | 11.80 | 11.04 | 56.40 |
Manufacturing and energy buyers keep 80% and 76% of their edge budgets on-premise, while telecom and IT buyers spend 47% on network edge services and BFSI and others spend 32% in regional edge data centers.
The three-layer edge build model behind these figures has inputs any reader can check: units times average price for on-premise edge, service revenue for the network edge, and new MW times cost per MW for regional edge data centers. The model and its assumptions are explained on our research methodology page.
Regional Insights: Which Region Leads the Edge Computing Market?
North America leads the Edge Computing Market with 38.6% of 2025 value, and the Middle East and Africa is the fastest-growing region at 16.42% a year, because buyers there are adding edge and inference capacity from a small base.
North America Leads with 38.6% Share
North American buyers spent USD 21.77 billion on edge computing in 2025, and the region is forecast to reach USD 68.62 billion in 2035, a CAGR of 12.17%. The United States hosts most of the edge colocation activity covered in this report, including the I Squared Capital platform across nine US cities and the Duos Edge AI campus in Georgia. North America loses 3.4 points of share by 2035 as Asia Pacific catches up.
Asia Pacific Holds 30.4% Share
Asia Pacific is worth USD 17.15 billion in 2025 and USD 65.90 billion by 2035, a CAGR of 14.41%. China, Japan and South Korea are the largest country markets in the region in the DC Market Insights allocation, and India grows fastest. Asia Pacific gains 3.4 points of share, the largest gain of any region, and comes close to North America by 2035.
Europe Holds 22.1% Share
Europe is worth USD 12.46 billion in 2025 and USD 38.80 billion by 2035, a CAGR of 12.03%, the slowest of the five regions. Germany is the largest country market in Europe at USD 2.94 billion, and the EU Data Act supports demand for interoperable, portable edge platforms.
Latin America Holds 4.6% Share
Latin America is worth USD 2.59 billion in 2025 and USD 10.53 billion by 2035, a CAGR of 15.06%, led by Brazil at USD 1.17 billion.
Middle East and Africa Holds 4.3% Share
The Middle East and Africa is worth USD 2.43 billion in 2025 and USD 11.11 billion by 2035, the fastest growth of any region at 16.42% a year. Saudi Arabia, worth USD 650.00 million in 2025, is the only country from the region in the top 12.
Country Analysis: Which Countries Spend the Most on Edge Computing?
The United States is the largest country market for edge computing at USD 19.44 billion in 2025, 34.5% of global value, followed by China at USD 7.17 billion (12.7%) and Japan at USD 3.45 billion (6.1%). The 12 largest countries account for 82.0% of 2025 spending.
| Rank | Country | Region | 2025 (USD billion) | Share 2025 | 2035 (USD billion) | CAGR 2025-2035 |
|---|---|---|---|---|---|---|
| 1 | United States | North America | 19.44 | 34.5% | 60.52 | 12.03% |
| 2 | China | Asia Pacific | 7.17 | 12.7% | 25.83 | 13.67% |
| 3 | Japan | Asia Pacific | 3.45 | 6.1% | 10.74 | 12.03% |
| 4 | Germany | Europe | 2.94 | 5.2% | 8.85 | 11.65% |
| 5 | United Kingdom | Europe | 2.54 | 4.5% | 7.60 | 11.58% |
| 6 | Canada | North America | 2.33 | 4.1% | 8.10 | 13.27% |
| 7 | France | Europe | 1.97 | 3.5% | 5.90 | 11.59% |
| 8 | India | Asia Pacific | 1.78 | 3.2% | 11.07 | 20.05% |
| 9 | South Korea | Asia Pacific | 1.61 | 2.9% | 6.00 | 14.06% |
| 10 | Australia | Asia Pacific | 1.22 | 2.2% | 4.35 | 13.56% |
| 11 | Brazil | Latin America | 1.17 | 2.1% | 4.60 | 14.67% |
| 12 | Saudi Arabia | Middle East and Africa | 0.65 | 1.2% | 3.46 | 18.20% |
India is the fastest-growing large country market at 20.05% a year, ahead of Saudi Arabia at 18.20% and Brazil at 14.67%. The country figures are a DC Market Insights allocation of the regional totals, weighted by each country’s estimated share of industrial automation, 5G coverage and edge data center capacity; North America here covers the United States and Canada.
Forecast Scenarios: How Could the 2035 Forecast Change?
The Edge Computing Market reaches USD 194.96 billion by 2035 in the base case, with a range of USD 162.79 billion to USD 226.54 billion across the low and high scenarios.
| Scenario | Assumption from 2026 | 2035 (USD billion) | CAGR 2025-2035 |
|---|---|---|---|
| Low | Edge unit shipments, network edge services and edge MW 16.5% below base by 2035 | 162.79 | 11.18% |
| Base | Units reach 5.60 million a year; network edge services reach USD 52.00 billion | 194.96 | 13.21% |
| High | Edge unit shipments, network edge services and edge MW 16.2% above base by 2035 | 226.54 | 14.92% |
The low case reflects AI inference staying mostly in centralized cloud regions and telco edge monetization remaining slow. The high case assumes accelerated edge systems become standard in factories, stores and vehicles.
Competitive Insights: Who Leads the Edge Computing Market?
- Hewlett Packard Enterprise (HPE)
- Dell Technologies
- Cisco
- Lenovo
- Siemens
- NVIDIA
- Intel
- Amazon Web Services (AWS)
- Microsoft
- Google Cloud
- Akamai
- Cloudflare
- Fastly
- Equinix
- American Tower (CoreSite)
- Huawei
- Schneider Electric
The Edge Computing Market is fragmented: DC Market Insights estimates that no single supplier holds more than about 6% of 2025 value and that the five largest together hold about a quarter. The basis is supplier disclosures set against the USD 56.40 billion market: Cloudflare’s fiscal year 2025 revenue of USD 2.17 billion, the largest of the disclosed edge platform revenues, equals about 3.8% of the market even before removing its security and content delivery revenue. Akamai reported Cloud Infrastructure Services revenue of USD 314.00 million in 2025, and Fastly reported USD 624.00 million of total revenue. Hardware suppliers compete across all tiers: HPE has closed its acquisition of Juniper Networks, which it said doubles the size of its networking business, NVIDIA supplies accelerated modules such as Jetson AGX Thor, and Siemens supplies industrial edge software. Equinix, with 2025 revenues of USD 9.22 billion, and American Tower through CoreSite supply colocation used for regional edge deployments.
Recent Developments
- In July 2025, Hewlett Packard Enterprise completed its acquisition of Juniper Networks, a transaction it said doubles the size of its networking business (Source: HPE SEC filing).
- In August 2025, NVIDIA made Jetson AGX Thor available, with up to 2,070 FP4 teraflops of AI compute within a 130-watt power envelope and a developer kit starting at USD 3,499 (Source: NVIDIA press release).
- In October 2025, Akamai launched Akamai Inference Cloud with NVIDIA RTX PRO Servers, targeting 20 initial locations on a network of more than 4,200 locations (Source: Akamai SEC filing).
- In April 2026, Siemens made its Industrial AI Suite generally available on Industrial Edge and announced IEC 62443-4-2-certified security functions for the second half of 2026 (Source: Siemens press release).
- In May 2026, I Squared Capital launched a US AI inference and edge colocation data center platform with a commitment of up to USD 1.00 billion, starting with an agreement to acquire about 53 MW across 10 facilities (Source: IREI news report).
- In July 2026, Duos Edge AI agreed to provide 10 MW of capacity in Columbus, Georgia, to an investment-grade hyperscaler in a deal worth more than USD 111.00 million over five years (Source: Data Center Dynamics news report).
We follow these Edge Computing Market deals, launches and capacity announcements as they happen in our data center industry updates.
Methodology: How We Built the Edge Computing Market Model
DC Market Insights built the Edge Computing Market model bottom-up from three layers and 16 annual cohorts (2020 to 2035). For on-premise enterprise edge, edge server and gateway shipments (1.30 million units in 2020, 2.35 million in 2025 and 5.60 million in 2035) were multiplied by average system prices (USD 7,100, USD 8,400 and USD 10,900), and software and services were added as ratios to hardware value (0.32 and 0.38 per USD of hardware in 2025). Network and telco edge services were modeled as service revenue, rising from USD 4.20 billion in 2020 to USD 11.80 billion in 2025 and USD 52.00 billion in 2035. Regional edge data centers were modeled as new MW (520 MW in 2020, 1,150 MW in 2025 and 2,900 MW in 2035) times fit-out cost per MW (USD 8.10 million, USD 9.60 million and USD 11.20 million). The total was split by 3 components, 3 edge tiers, 6 applications, 8 end uses, 5 regions and 12 countries, and every split sums to the market total. The result was checked top-down against the 2025 revenues of Cloudflare, Fastly and Akamai’s Cloud Infrastructure Services, against the per-MW economics of the I Squared Capital and Duos Edge AI transactions, and against 5G subscription and traffic data from the Ericsson Mobility Report. The analyst named on this page built the model, and the reviewer checked the arithmetic, the sources and the dates before publication.
Table of contents
- 01Introduction
- 1.1Market Definition and Scope
- 1.2Edge Tiers Covered
- 1.3Currency, Base Year and Forecast Period
- 1.4Key Stakeholders
- 02Research Methodology
- 2.1Three-Layer Bottom-Up Build
- 2.2Top-Down Cross-Checks
- 2.3Primary and Secondary Sources
- 2.4Assumptions and Limitations
- 03Executive Summary
- 3.1Market Size, 2020, 2025 and 2035
- 3.2Key Findings
- 3.3Analyst Viewpoint
- 04Market Dynamics
- 4.1Drivers
- 4.2Trends
- 4.3Challenges
- 4.4Opportunities
- 05Pricing Analysis
- 5.1Average On-Premise Edge System Price, 2020-2035
- 5.2Software Spend per USD of Edge Hardware
- 5.3Regional Edge Data Center Cost per MW
- 06Standards and Regulation
- 6.1ETSI Multi-access Edge Computing
- 6.2IEC 62443-4-2
- 6.3EU Data Act
- 07Supply Chain and Ecosystem
- 7.1Silicon and Accelerator Suppliers
- 7.2Edge Server and Gateway Makers
- 7.3Edge Software Platforms
- 7.4Edge Cloud, Colocation and Telco Operators
- 08Market Size and Forecast
- 8.1Market Size, 2020-2035
- 8.2On-Premise Edge Units and Prices
- 8.3Network Edge Service Revenue
- 8.4Regional Edge MW and Cost per MW
- 09Edge Computing Market, By Component
- 9.1Hardware
- 9.2Software
- 9.3Services
- 10Edge Computing Market, By Edge Tier
- 10.1On-Premise Enterprise Edge
- 10.2Network and Telco Edge
- 10.3Regional Edge Data Centers
- 11Edge Computing Market, By Application
- 11.1AI Inference and Computer Vision
- 11.2Industrial IoT and Automation
- 11.3Content Delivery and Edge Cloud Services
- 11.4Smart Retail and Venues
- 11.5Connected and Autonomous Vehicles
- 11.6Remote Monitoring and Other Applications
- 12Edge Computing Market, By End Use
- 12.1Manufacturing
- 12.2Telecom and IT
- 12.3Retail and Consumer Goods
- 12.4Energy and Utilities
- 12.5Transportation and Logistics
- 12.6Healthcare
- 12.7Government and Defense
- 12.8BFSI and Others
- 13DC Exclusive: Three-Layer Edge Build Model
- 13.1End Use × Edge Tier Matrix, 2025
- 13.2Model Inputs
- 14Edge Computing Market, By Region
- 14.1North America: United States, Canada
- 14.2Asia Pacific: China, Japan, India, South Korea, Australia
- 14.3Europe: Germany, United Kingdom, France
- 14.4Latin America: Brazil
- 14.5Middle East and Africa: Saudi Arabia
- 15Country Analysis
- 15.1Top 12 Countries, 2025 and 2035
- 15.2Fastest-Growing Countries
- 16Regional Cross-Sections
- 16.1Edge Tier by Region, 2025
- 16.2Share Shift by Region, 2025-2035
- 17Forecast Scenarios
- 17.1Low Scenario
- 17.2Base Scenario
- 17.3High Scenario
- 18Competitive Landscape
- 18.1Market Structure
- 18.2Supplier Positioning by Edge Tier
- 18.3Recent Developments
- 19Company Profiles
- 19.1Hewlett Packard Enterprise (HPE)
- 19.2Dell Technologies
- 19.3Cisco
- 19.4Lenovo
- 19.5Siemens
- 19.6NVIDIA
- 19.7Intel
- 19.8Amazon Web Services (AWS)
- 19.9Microsoft
- 19.10Google Cloud
- 19.11Akamai
- 19.12Cloudflare
- 19.13Fastly
- 19.14Equinix
- 19.15American Tower (CoreSite)
- 19.16Huawei
- 19.17Schneider Electric
- 20Analyst Recommendations
- 20.1For Edge Hardware Suppliers
- 20.2For Edge Cloud and Colocation Operators
- 20.3For Enterprise Buyers
- Fig. 1Edge Computing Market Size, 2020-2035
- Fig. 2Edge Computing Market Share by Component, 2025
- Fig. 3Edge Computing Market Share by Edge Tier, 2025 and 2035
- Fig. 4Edge Computing Market by Application, 2025 and 2035
- Fig. 5Edge Computing Market by End Use, 2025
- Fig. 6Edge Computing Market by Region, 2025 and 2035
- Fig. 7Top 12 Countries, 2025
- Fig. 8Forecast Scenarios, 2035
- Table 1Report Attributes
- Table 2Edge Pricing Indicators, 2020, 2025, 2030 and 2035
- Table 3Market by Component, 2025 and 2035
- Table 4Market by Edge Tier, 2025 and 2035
- Table 5Market by Application, 2025 and 2035
- Table 6Market by End Use, 2025 and 2035
- Table 7End Use × Edge Tier Matrix, 2025
- Table 8Market by Region, 2025 and 2035
- Table 9Top 12 Countries, 2025 and 2035
- Table 10Forecast Scenarios, 2035
- Table 11Recent Developments
About this report
Written by Amit Jain and reviewed by Deepti Agrawal, Senior Editor, Research. Figures are built top-down and bottom-up and reconciled before publication, with 2025 as the base year.
Read our methodologyHow we built this
- Historical period2020-2024
- Base year2025
- Forecast period2026-2035
- Sizing approachTop-down + bottom-up
Need more than the report?
Advisory on this market
Due diligence, site selection and market entry work, by the analysts who wrote this report.
See consulting servicesFrequently asked questions
USD 56.40 billion in 2025, rising to USD 194.96 billion by 2035. DC Market Insights estimates the market at USD 23.36 billion in 2020.
13.21% a year from 2025 to 2035. Growth was faster, at 19.28% a year, between 2020 and 2025 as enterprises moved video analytics and AI inference onto local servers.
On-premise enterprise edge, with USD 33.56 billion or 59.5% of the market in 2025. Network and telco edge grows fastest at 15.99% a year.
AI inference and computer vision, at 18.86% a year, rising from 22.8% of the market in 2025 to 37.1% by 2035, according to DC Market Insights estimates.
About USD 8,400 for an average on-premise edge server or gateway and about USD 9.60 million per MW to fit out a regional edge data center in 2025, according to DC Market Insights estimates.
North America, with USD 21.77 billion or 38.6% of 2025 value. The Middle East and Africa grows fastest at 16.42% a year.
No supplier holds more than about 6% of the market, and the five largest hold about a quarter (DC Market Insights estimate). HPE, Dell Technologies, Cisco, Lenovo, Siemens, NVIDIA, Akamai, Cloudflare, Fastly and Equinix compete.
USD 19.44 billion in the United States, or 34.5% of 2025 spending, followed by China at USD 7.17 billion. India grows fastest among large country markets at 20.05% a year (DC Market Insights estimate).
Licences, delivery and payment
Which licence should I choose?
Single User is a view-only PDF for one person. Multi User adds a printable PDF and the Excel data for unlimited users at one location. Enterprise covers your whole company and includes 100 free analyst hours.
How and when will I receive the report?
By email, within 24–48 business hours of payment, in the formats of your licence.
How can I pay?
Securely through PayPal: with a PayPal account, a debit or credit card, or PayPal Pay Later where available. Prices are in US dollars.
Can I see a sample first?
Yes. Request a free sample and we will email it to you.
Can the report be tailored to my needs?
Yes. We can add countries, segments or data cuts. Talk to an analyst about the scope you need.
Can I get an invoice or pay against a purchase order?
Write to sales@dcmarketinsights.com and our team will help.