
Managed Server and Storage Hardware Support Services Market Size, Share & Forecast to 2035
Market at a glance
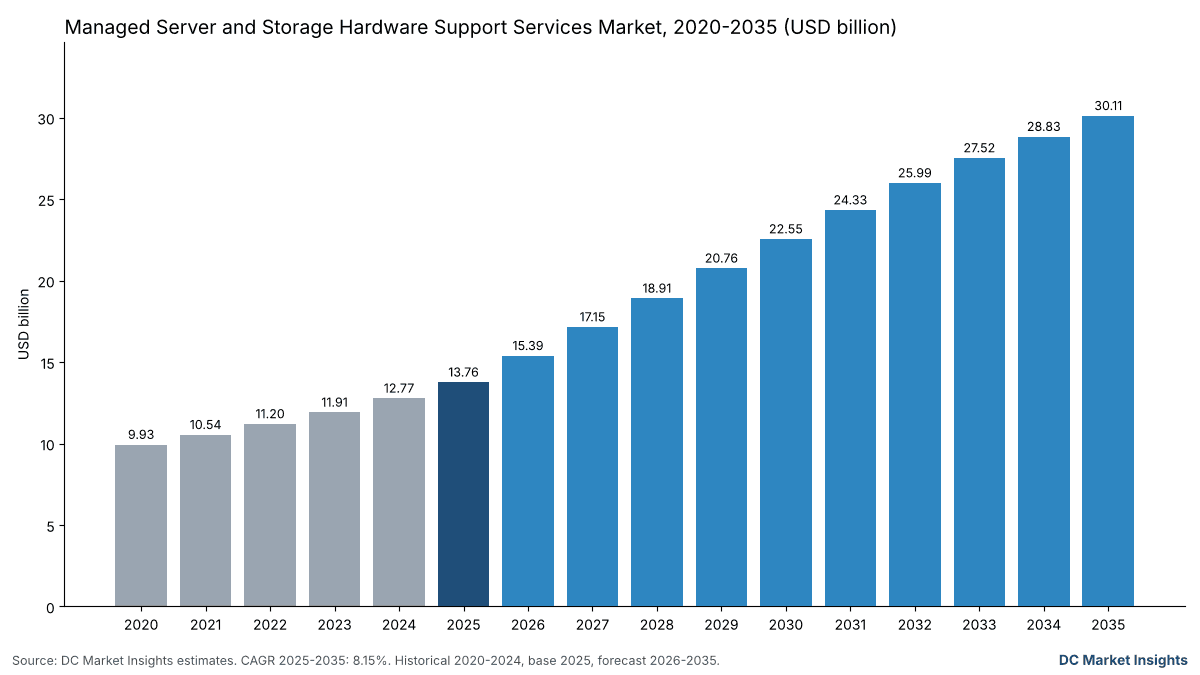
The Managed Server and Storage Hardware Support Services market was worth USD 13.76 billion in 2025 and is forecast to reach USD 30.11 billion by 2035, growing at a 8.15% CAGR.
 By Amit Jain, Senior Consultant, ICT & Emerging Technologies
 Reviewed by Deepti Agrawal
Last updated 6 Nov 2026
Base year 2025 PDF + Excel
Key findings
Server Lives Stretch to 5.5 and 6 Years at Meta and Alphabet
Third-Party Maintainers Consolidate: Park Place and Service Express Merge in January 2026
Hyperscalers Repair In-House: Amazon Spent USD 128.3 Billion on Net Capex in 2025
GPU Clouds and Colocation Tenants Reach USD 8.13 billion by 2035
What is inside the report
- 01Introduction
- 02Key Market Statistics and Key Takeaways
- 03Executive Summary
- 04Why Estimates Differ
- 05Market Drivers
- 06Market Trends
- 07Market Challenges
- 08Market Opportunities
- 09Pricing
- 10Standards and Regulation
- 18chapters
- 2020-2024Historical period
- 2026-2035Forecast period
- 9Companies profiled
Segmentation
Companies profiled
- Lenovo: server and storage support through its Infrastructure Solutions Group
- Evernex: more than 692,000 IT systems supported in 165+ countries (June 2026)
- NetApp: support revenue USD 2.64 billion in fiscal 2026
- NVIDIA: DGX Enterprise Support with on-site engineer and on-site spares add-ons
- Kyndryl: fiscal 2026 revenue USD 15.09 billion across infrastructure services
- Hitachi Vantara: storage system support
- Fujitsu: server and storage support in Japan and Europe
- Huawei: server and storage support, mainly in China
- Inspur: server support, mainly in China
Recent developments
Evernex acquired Empowered and OrderWork in the United Kingdom, its tenth acquisition since 2019 (Source: Evernex).
NetApp reported fiscal 2026 support revenue of USD 2.64 billion (Source: NetApp).
Evernex acquired Comptest, a telecom infrastructure specialist in Poland (Source: Evernex).
Everpure reported fiscal 2026 subscription services revenue of USD 1.69 billion, up 15.1% (Source: Everpure).
Park Place Technologies completed its merger with Service Express (Source: Park Place Technologies).
Supermicro launched Data Center Building Block Solutions with a 4-hour on-site response option (Source: Supermicro).
Full analysis
The Managed Server and Storage Hardware Support Services Market is valued at USD 15.39 billion in 2026 and is projected to reach USD 30.11 billion by 2035, up from USD 13.76 billion in 2025, a CAGR of 8.15% from 2025 to 2035 (DC Market Insights estimate). The money in this market follows the age of the hardware: the factory warranty on a server usually ends long before the owner retires it, and the largest owners now keep servers for five to six years. Meta moved most servers and network assets to a 5.5-year life from January 2025, cutting 2025 depreciation by USD 2.92 billion, according to the Meta 2025 annual report, and every year a machine stays in service after its warranty is a year somebody pays to keep it running. Memory prices add a second push: Micron reported that its average dynamic random-access memory (DRAM) selling price rose about 180% in fiscal 2026, so replacing a failed module or a whole server costs more than repairing and keeping it.
The market covers paid support contracts for data center servers and storage systems after or beyond the standard warranty: on-site break-fix, parts logistics and depot repair, remote monitoring and proactive support, and firmware and lifecycle extension, sold by original equipment manufacturers (OEMs), third-party maintenance (TPM) providers and integrators. The 2025 receipt is 99,760 MW of conventional IT load × 45% under paid support = 44,892 MW × USD 235,000 per MW-year = USD 10.55 billion, plus 16,240 MW of AI load × 38% under paid support = 6,171 MW × USD 520,000 per MW-year = USD 3.21 billion. Support for AI and GPU Servers grows fastest at 19.88% a year because graphics processing unit (GPU) clouds and enterprises buy on-site spares and hour-level response for systems worth tens of millions of dollars per megawatt, and Asia Pacific is the fastest region at 10.21% as India’s installed base grows 15.70% a year.
Key Market Statistics: How Big Is the Managed Server and Storage Hardware Support Services Market in 2026?
The Managed Server and Storage Hardware Support Services Market reaches USD 15.39 billion in 2026, 11.83% above the USD 13.76 billion of 2025, as installed data center IT load rises from 116 GW to 131 GW and the AI share of that load climbs from 14.0% to 18.8% (DC Market Insights estimate).
- Market size 2025: USD 13.76 billion
- Market size 2026: USD 15.39 billion
- Market size 2030: USD 22.55 billion
- Market size 2035: USD 30.11 billion
- CAGR 2025-2035: 8.15% (low case 4.93%, high case 10.73%)
- Largest provider type: OEM Support Contracts, 74.00% of 2025 value
- Fastest hardware type: AI and GPU Servers, 19.88% a year
- Leading region: North America, 42.00% of 2025 value; fastest region: Asia Pacific, 10.21%
- Largest country: United States, USD 5.23 billion in 2025
- Market leader: Dell Technologies, about 22% of 2025 value (DC Market Insights estimate)
Key Takeaways: Why Do Data Center Owners Pay for Hardware Support?
- OEM Support Contracts hold 74.00% of 2025 value, because most servers and arrays are bought with multi-year support attached at the point of sale.
- Support for Conventional Servers stays flat at about USD 8 billion a year to 2035, because the conventional fleet grows slowly and the support price per megawatt falls from USD 235,000 to USD 175,000.
- Third-Party Maintenance grows 9.60% a year, because owners keep hardware past the OEM support window and EU ecodesign rules oblige makers to share repair information with third-party maintainers.
- Colocation and GPU Cloud Providers grow fastest among end users at 13.96% a year, because they run GPU fleets without the in-house repair teams that hyperscalers keep.
Executive Summary: What Is the Managed Server and Storage Hardware Support Services Market Worth?
The Global Managed Server and Storage Hardware Support Services Market size was valued at USD 9.93 billion in 2020, reached USD 13.76 billion in 2025, and is anticipated to reach USD 30.11 billion by 2035, at a CAGR of 8.15% during the forecast period.
| Attribute | Value |
|---|---|
| Historical period | 2020-2024 |
| Base year | 2025 |
| Forecast period | 2026-2035 |
| Market size 2025 | USD 13.76 billion |
| Market size 2026 | USD 15.39 billion |
| CAGR 2025-2035 | 8.15% |
| Market size 2035 | USD 30.11 billion |
| Segments covered | Hardware Type, Provider Type, Service Type, End User |
Growth from 2020 to 2025 ran at 6.73% a year as installed data center IT load rose from 68 GW to 116 GW while the support price per conventional megawatt fell from USD 300,000 to USD 235,000. Growth after 2025 speeds up to 8.15% because the AI share of installed load rises from 14% to 52% by 2035, and each supported AI megawatt carries USD 520,000 of support in 2025 against USD 235,000 for a conventional megawatt. DC Market Insights expects USD 22.55 billion in 2030, when 207 GW of IT load is installed.
What Does the Managed Server and Storage Hardware Support Services Market Include?
The Managed Server and Storage Hardware Support Services Market counts USD 13.76 billion of 2025 spending on contracts that keep data center servers and storage systems running after purchase, whoever delivers the service.
Included
- OEM support contracts for servers and storage beyond the base warranty, such as extended, premium and mission-critical support tiers, including the hardware part of storage support subscriptions.
- Third-party maintenance of servers and storage, including post-warranty and end-of-service-life support, and multivendor support programs.
- On-site field engineers, parts logistics and depot repair, on-site spares kits, remote monitoring and proactive support, firmware updates and lifecycle extension services.
- Support for AI and GPU servers, including on-site parts replacement for GPU systems.
Excluded
- Network switch and router support, software support and subscriptions, and managed hosting (counted in the Managed Data Center Services Market), as well as the standard factory warranty included in the hardware price.
- Hardware purchases (counted in the Cloud Servers Market and other hardware reports), power and cooling maintenance, and the retirement, data erasure and resale of old equipment (counted in the Data Center IT Asset Disposition (ITAD) Market).
- Repairs that hyperscale clouds perform with their own staff and parts, which create no market transaction.
How the segments fit together
Every supported megawatt of IT load carries one blended support price that is split by hardware type, by who delivers it and by service type. In 2025 the split was 58.27% conventional servers, 20.99% AI and GPU servers and 20.73% storage systems; by provider, 74.00% went to OEMs and 21.00% to third-party maintainers.
Why Do Managed Server and Storage Hardware Support Services Market Estimates Differ?
The DC Market Insights figure of USD 15.39 billion for 2026 counts only paid support for data center servers and storage, so it is smaller than estimates for IT support services as a whole.
Broader definitions add support for PCs, printers and network equipment, software maintenance fees, managed services and outsourcing, deployment and installation, or the warranty value already bundled into hardware prices. Some count the full services revenue of hardware vendors, which also covers laptops and consulting. DC Market Insights keeps only the hardware support layer for data center servers and storage, so the figure fits inside the Managed Data Center Services Market and the Data Center Outsourcing Market.
| Element | In this report | Why |
|---|---|---|
| Server and storage support by OEMs | Yes, USD 10.18 billion in 2025 | Paid service that keeps the hardware running |
| Third-party maintenance | Yes, USD 2.89 billion in 2025 | Same service from a non-OEM provider |
| Software support and subscriptions | No | Paid for code, not hardware |
| PC, printer and network support | No | Not data center servers or storage |
| In-house hyperscale repair | No | No market transaction |
Small buyers are in scope: a company with a few racks in a colocation hall that buys next-business-day support from an OEM or a third-party maintainer sits in the Enterprises segment, which held 52.00% of 2025 value.
Market Drivers: Why Is Server and Storage Support Spending Rising?
Three forces lift the Managed Server and Storage Hardware Support Services Market from USD 13.76 billion in 2025 to USD 15.39 billion in 2026: longer server lives, higher prices for replacement parts, and AI fleets bought by owners who cannot repair them in-house.
Server Lives Stretch to 5.5 and 6 Years at Meta and Alphabet
Meta extended the useful life of most servers and network assets to 5.5 years from 1 January 2025, which cut 2025 depreciation by USD 2.92 billion, according to its annual report. Alphabet said in its 2025 annual report that it depreciates servers and network equipment “generally over a period of six years”. Enterprises follow the same logic with smaller fleets, and every year beyond a three-year warranty needs a paid contract; DC Market Insights counts 44,892 MW of conventional IT load under paid support in 2025, worth USD 10.55 billion.
Memory and Drive Prices Make Repair Cheaper Than Replacement: DRAM Prices Up About 180%
Micron reported in its fiscal 2026 annual report that DRAM sales rose 252% “primarily due to an approximate 180% increase in average selling prices” and that supply allocation “may impact certain customers”. Seagate cited “favorable pricing actions” for fiscal 2026 revenue of about USD 12.2 billion, and Dell Technologies said it expects “notable inflation for component costs” in fiscal 2027, according to their annual reports. Higher part prices raise the value of spares pools and depot repair, so Parts Logistics and Depot Repair grows from USD 3.71 billion in 2025 to USD 7.83 billion by 2035.
AI Server Fleets Outside the Hyperscalers Need Hour-Level Response
Dell Technologies sold USD 24.68 billion of AI-optimized servers in fiscal 2026, according to its results release, mostly to buyers other than the largest clouds. NVIDIA offers DGX Enterprise Support with a severity-1 response “of one hour or less” and add-ons for on-site engineers and on-site spares, and Supermicro launched a 4-hour on-site response option in October 2025, according to both companies. DC Market Insights counts 6,171 MW of AI load under paid support in 2025 at USD 520,000 per MW-year, and support for AI and GPU Servers rises from USD 2.89 billion to USD 17.70 billion by 2035.
Market Trends: How Is Hardware Support Changing?
Third-party maintainers are merging into global platforms and storage support is turning into subscriptions, which lifts Third-Party Maintenance from 21.00% of value in 2025 to 24.00% by 2035.
Third-Party Maintainers Consolidate: Park Place and Service Express Merge in January 2026
Park Place Technologies completed its merger with Service Express on 6 January 2026, creating a company with more than 3,000 employees and more than 20,000 customers that operates as Park Place (Park Place Technologies, January 2026). Evernex bought Comptest in Poland in March 2026 and Empowered and OrderWork in the United Kingdom in June 2026, its tenth acquisition since 3i invested in 2019, and said it supports more than 692,000 IT systems in 165+ countries. Larger platforms can hold spares in more cities, which DC Market Insights reflects in Third-Party Maintenance growing 9.60% a year to USD 7.23 billion by 2035.
Storage Support Becomes a Subscription: Everpure Subscription Services Up 15.1%
Everpure, formerly Pure Storage, reported subscription services revenue of USD 1.69 billion for fiscal 2026, up 15.1% from USD 1.47 billion, a line that includes support and maintenance, according to its results release. NetApp reported support revenue of USD 2.64 billion for fiscal 2026, up from USD 2.51 billion, or 38.1% of its USD 6.93 billion revenue (NetApp fiscal 2026 results). Storage support spending in the DC Market Insights model grows from USD 2.85 billion in 2025 to USD 4.47 billion by 2035, at 4.60% a year.
Market Challenges: What Limits Hardware Support Revenue?
Two limits keep paid support at 45% of conventional and 38% of AI IT load in 2025: the largest clouds repair their own hardware, and the support price per megawatt falls as hardware gets denser.
Hyperscalers Repair In-House: Amazon Spent USD 128.3 Billion on Net Capex in 2025
Amazon reported net purchases of property and equipment of USD 128.3 billion in 2025, up from USD 77.7 billion in 2024, and changed the useful life of a subset of servers and networking equipment from six to five years from January 2025, adding USD 1.4 billion of depreciation, according to its annual report. Fleets of this size are maintained by the owners’ own technicians with parts bought in bulk, so Hyperscale Cloud Providers held only 12.00% of 2025 support value in the DC Market Insights model.
Legacy Support Revenue Is Flat: IBM Infrastructure Support at USD 5.10 Billion in 2025
IBM reported Infrastructure Support revenue of USD 5.10 billion in 2025 against USD 5.11 billion in 2024, a fall of 0.1%, while its Infrastructure segment revenue rose 12.1% (IBM 2025 annual report). The pattern matches the DC Market Insights model, where support for Conventional Servers moves from USD 8.02 billion in 2025 to USD 7.94 billion by 2035, a change of -0.10% a year, because the price per supported megawatt falls from USD 235,000 to USD 175,000.
Market Opportunities: Where Will Hardware Support Earn the Most?
GPU clouds and remote proactive support add the most value to 2035: Colocation and GPU Cloud Providers add USD 5.93 billion and Remote Monitoring and Proactive Support adds USD 4.75 billion between 2025 and 2035 (DC Market Insights estimate, the two overlap in part).
GPU Clouds and Colocation Tenants Reach USD 8.13 billion by 2035
GPU cloud operators run thousands of accelerators per site without the parts depots of the largest clouds, and NVIDIA sells on-site spares and media retention as add-ons to its DGX support for exactly this buyer, according to the company. Colocation and GPU Cloud Providers grow from USD 2.20 billion in 2025 to USD 8.13 billion by 2035, at 13.96% a year, the fastest end user in the model.
Remote Monitoring and Proactive Support Reaches USD 7.23 billion by 2035
Telemetry that predicts a failing drive or memory module lets a provider ship the part before the outage, which matters more when a spare DRAM module costs far more than in 2024. IBM describes its support as “comprehensive, proactive and AI-enabled maintenance and support services” for IBM and other vendors’ products in its 2025 annual report. Remote Monitoring and Proactive Support grows 11.30% a year, from 18.00% of 2025 value to 24.00% by 2035.
Pricing: What Does Server and Storage Hardware Support Cost per Megawatt?
The blended support price was about USD 235,000 per supported conventional megawatt-year and USD 520,000 per supported AI megawatt-year in 2025 (DC Market Insights estimate).
| Unit rate (DC Market Insights estimate) | 2020 | 2025 | 2030 | 2035 |
|---|---|---|---|---|
| Support per supported conventional MW-year (USD) | 300,000 | 235,000 | 200,000 | 175,000 |
| Support per supported AI MW-year (USD) | 620,000 | 520,000 | 440,000 | 380,000 |
| Share of conventional IT load under paid support | 48% | 45% | 42% | 40% |
| Share of AI IT load under paid support | 40% | 38% | 34% | 32% |
Public price anchors: NetApp’s support revenue equalled 38.1% of its fiscal 2026 revenue, and Dell Technologies carried USD 26.93 billion of deferred revenue, mostly support and deployment services, at the end of fiscal 2026, according to their filings. The conventional rate equals about 2.6% a year of the roughly USD 9 million of server and storage hardware installed per megawatt, a DC Market Insights estimate.
Standards and Regulation: Which Rules Shape Server and Storage Support?
Four European rules adopted between 2019 and 2026 shape the USD 15.39 billion market of 2026, mainly by keeping servers repairable and firmware available for 8 years.
- Commission Regulation (EU) 2019/424 (ecodesign for servers and data storage products): from 1 March 2020 fastenings must not prevent removal of storage, memory, processors, boards, power supplies and batteries for repair, and repair information must reach registered third parties, “including … third party maintenance”; from 1 March 2021 the latest firmware must stay available for at least 8 years after the last unit of a model is sold.
- Commission Delegated Regulation (EU) 2024/1364 (14 March 2024): data centres with at least 500 kilowatts (kW) of IT power report energy and performance data, first by 15 September 2024 and then by 15 May each year (Source: Government of Ireland).
- Directive (EU) 2024/1799 on the repair of goods (13 June 2024): sets common repair rules for products with repair requirements under EU law; it is aimed mainly at consumers (Source: EUR-Lex).
- EU data centre rating scheme (21 September 2026): the European Commission proposed a common rating scheme for data centres, with minimum performance standards planned for the second quarter of 2027 (Source: European Commission).
Market Segmentation: Which Segments Lead the Managed Server and Storage Hardware Support Services Market?
OEM Support Contracts lead with USD 10.18 billion in 2025, while AI and GPU Servers, Integrator and Managed Service Provider Support, Remote Monitoring and Proactive Support and Colocation and GPU Cloud Providers grow fastest in their dimensions.
Managed Server and Storage Hardware Support Services Market by Hardware Type
| Hardware Type | 2025 (USD million) | Share 2025 | 2035 (USD million) | CAGR 2025-2035 |
|---|---|---|---|---|
| Conventional Servers | 8,017.71 | 58.27% | 7,941.70 | -0.10% |
| AI and GPU Servers | 2,888.12 | 20.99% | 17,698.64 | 19.88% |
| Storage Systems | 2,852.81 | 20.73% | 4,474.42 | 4.60% |
AI and GPU Servers overtake Conventional Servers in 2029 in the DC Market Insights model and reach 58.77% of value by 2035.
Managed Server and Storage Hardware Support Services Market by Provider Type
| Provider Type | 2025 (USD million) | Share 2025 | 2035 (USD million) | CAGR 2025-2035 |
|---|---|---|---|---|
| OEM Support Contracts | 10,181.39 | 74.00% | 21,080.32 | 7.55% |
| Third-Party Maintenance | 2,889.31 | 21.00% | 7,227.54 | 9.60% |
| Integrator and Managed Service Provider Support | 687.93 | 5.00% | 1,806.88 | 10.14% |
Integrator and Managed Service Provider Support grows fastest at 10.14% a year as outsourcers bundle hardware support into wider contracts.
Managed Server and Storage Hardware Support Services Market by Service Type
| Service Type | 2025 (USD million) | Share 2025 | 2035 (USD million) | CAGR 2025-2035 |
|---|---|---|---|---|
| Break-Fix and On-Site Field Engineering | 6,053.80 | 44.00% | 11,443.60 | 6.57% |
| Parts Logistics and Depot Repair | 3,714.83 | 27.00% | 7,829.84 | 7.74% |
| Remote Monitoring and Proactive Support | 2,476.56 | 18.00% | 7,227.54 | 11.30% |
| Firmware and Lifecycle Extension Services | 1,513.45 | 11.00% | 3,613.77 | 9.09% |
Break-Fix and On-Site Field Engineering stays the largest service type at 38.00% of 2035 value.
Managed Server and Storage Hardware Support Services Market by End User
| End User | 2025 (USD million) | Share 2025 | 2035 (USD million) | CAGR 2025-2035 |
|---|---|---|---|---|
| Enterprises | 7,154.49 | 52.00% | 12,045.90 | 5.35% |
| Colocation and GPU Cloud Providers | 2,201.38 | 16.00% | 8,130.98 | 13.96% |
| Government and Public Sector | 1,926.21 | 14.00% | 3,914.92 | 7.35% |
| Hyperscale Cloud Providers | 1,651.04 | 12.00% | 3,914.92 | 9.02% |
| Telecom Operators | 825.52 | 6.00% | 2,108.03 | 9.83% |
Enterprises fall from 52.00% to 40.00% of value as GPU clouds and colocation tenants take a larger share of supported hardware.
DC Exclusive: The Server Useful-Life Ledger, 4 Hyperscalers at 5 to 6 Years and What One Extra Year Is Worth in Support
This ledger is a DC Market Insights estimate built on 8 inputs: the useful-life disclosures of 4 hyperscalers and the 4 support rates of the DC Market Insights model; it shows what one extra year of hardware life means for support spending.
| Company | Server life disclosed | Effective | Accounting effect |
|---|---|---|---|
| Amazon | Subset of servers and networking equipment cut from 6 to 5 years | January 2025 | +USD 1.4 billion depreciation in 2025 |
| Meta | Most servers and network assets extended to 5.5 years | January 2025 | -USD 2.92 billion depreciation in 2025 |
| Alphabet | Servers and network equipment generally 6 years | 2025 annual report | Policy unchanged |
| Microsoft | Servers and network equipment 2 to 6 years | Fiscal 2026 annual report | Range, no single life |
| One extra year of service (DC Market Insights estimate) | Conventional MW | AI MW |
|---|---|---|
| Support price per MW-year, 2025 | USD 235,000 | USD 520,000 |
| Support price per MW-year, 2030 | USD 200,000 | USD 440,000 |
| Extra support for a 10 MW hall kept one more year, 2025 prices | USD 2.35 million | USD 5.20 million |
The lesson for buyers is that life extensions and support budgets move together: Meta’s change to 5.5 years saved USD 2.92 billion of depreciation in one year, and a smaller owner that follows the same path should budget about USD 235,000 a year of support for each conventional megawatt it keeps past warranty. Amazon moved a subset of its servers back to five years in the same month, which is why the model uses a lower paid-support share for AI load (38%) than for conventional load (45%).
Regional Insights: Which Region Spends Most on Server and Storage Support?
North America leads with 42.00% of 2025 value, and Asia Pacific grows fastest at 10.21% a year to 2035.
North America Managed Server and Storage Hardware Support Services Market
North America earned USD 5.78 billion in 2025, 42.00% of value, and grows 7.49% a year to USD 11.90 billion by 2035 (DC Market Insights estimate). Park Place Technologies, headquartered in Cleveland, has operated as one company with Service Express since January 2026, and the United States alone accounts for USD 5.23 billion of 2025 value.
Europe Managed Server and Storage Hardware Support Services Market
Europe earned USD 3.58 billion in 2025, 26.00% of value, and grows 6.60% a year to USD 6.78 billion by 2035 (DC Market Insights estimate). Commission Regulation (EU) 2019/424 requires server makers to share repair information with registered third-party maintainers, and Evernex added Comptest in Poland and Empowered and OrderWork in the United Kingdom in 2026.
Asia Pacific Managed Server and Storage Hardware Support Services Market
Asia Pacific earned USD 3.30 billion in 2025, 24.00% of value, and grows 10.21% a year to USD 8.73 billion by 2035 (DC Market Insights estimate). India grows fastest at 15.70% a year as enterprise and government data centers add capacity, while Japan and China keep large fleets of OEM-supported systems.
Middle East and Africa Managed Server and Storage Hardware Support Services Market
Middle East and Africa earned USD 550.35 million in 2025, 4.00% of value, and grows 9.91% a year to USD 1.42 billion by 2035 (DC Market Insights estimate). Saudi Arabia leads the region with USD 132.08 million in 2025 and grows 11.61% a year as sovereign AI clusters come online, and Evernex added a provider in Morocco, according to the company.
Latin America Managed Server and Storage Hardware Support Services Market
Latin America earned USD 550.35 million in 2025, 4.00% of value, and grows 8.93% a year to USD 1.29 billion by 2035 (DC Market Insights estimate). Brazil holds USD 231.15 million of 2025 value, and Evernex expanded there through the acquisition of Maminfo, according to the company.
Country Analysis: Which Countries Lead Hardware Support Spending?
The United States leads with USD 5.23 billion in 2025, and India is the fastest large country at 15.70% a year.
| Rank 2025 | Country | Region | 2025 (USD million) | 2035 (USD million) | CAGR 2025-2035 |
|---|---|---|---|---|---|
| 1 | United States | North America | 5,229.66 | 10,705.80 | 7.43% |
| 2 | China | Asia Pacific | 1,188.75 | 3,056.65 | 9.90% |
| 3 | Japan | Asia Pacific | 792.50 | 1,659.32 | 7.67% |
| 4 | Germany | Europe | 787.00 | 1,456.80 | 6.35% |
| 5 | United Kingdom | Europe | 715.45 | 1,287.41 | 6.05% |
| 6 | France | Europe | 465.04 | 846.98 | 6.18% |
| 7 | Canada | North America | 433.40 | 892.15 | 7.49% |
| 8 | India | Asia Pacific | 264.17 | 1,135.33 | 15.70% |
| 9 | South Korea | Asia Pacific | 254.26 | 628.80 | 9.48% |
| 10 | Brazil | Latin America | 231.15 | 543.87 | 8.93% |
| 11 | Australia | Asia Pacific | 231.14 | 567.66 | 9.40% |
| 12 | Saudi Arabia | Middle East and Africa | 132.08 | 396.31 | 11.61% |
India moves from eighth place in 2025 to sixth by 2035 in the model as its installed data center load grows faster than any other large market; China stays second as domestic server makers support most of its fleet.
Forecast Scenarios: How Large Could the Managed Server and Storage Hardware Support Services Market Be by 2035?
The Managed Server and Storage Hardware Support Services Market reaches USD 30.11 billion by 2035 in the base case, within a range of USD 22.25 billion to USD 38.13 billion.
| Scenario | Paid-support share of AI load 2035 | Support price vs base | Market 2035 | CAGR 2025-2035 |
|---|---|---|---|---|
| Low | 25.6% | -15% | USD 22.25 billion | 4.93% |
| Base | 32.0% | Base | USD 30.11 billion | 8.15% |
| High | 38.4% | +12% | USD 38.13 billion | 10.73% |
The low case assumes GPU clouds build their own repair teams and support prices fall faster; the high case assumes AI hardware ages faster and more owners buy premium on-site support.
Competitive Insights: Who Leads the Managed Server and Storage Hardware Support Services Market?
Dell Technologies holds about 22% of 2025 value and the five largest providers about 59% (DC Market Insights estimate based on disclosed services, support and deferred revenue and on installed fleets).
- Dell Technologies: fiscal 2026 services revenue USD 23.13 billion company-wide; deferred revenue USD 26.93 billion, mostly support and deployment; Infrastructure Solutions Group (ISG) revenue USD 60.83 billion.
- Hewlett Packard Enterprise: fiscal 2025 Server revenue USD 17.75 billion; Server, Hybrid Cloud and Financial Services merged into a Cloud and AI segment from fiscal 2026.
- IBM: Infrastructure Support revenue USD 5.10 billion in 2025, covering IBM and other vendors’ hardware.
- Lenovo: server and storage support through its Infrastructure Solutions Group.
- Park Place Technologies: merged with Service Express on 6 January 2026; more than 3,000 employees and more than 20,000 customers.
- Evernex: more than 692,000 IT systems supported in 165+ countries (June 2026).
- NetApp: support revenue USD 2.64 billion in fiscal 2026.
- Everpure (formerly Pure Storage): subscription services revenue USD 1.69 billion in fiscal 2026.
- Supermicro: Data Center Building Block Solutions with a 4-hour on-site response option (October 2025).
- NVIDIA: DGX Enterprise Support with on-site engineer and on-site spares add-ons.
- Kyndryl: fiscal 2026 revenue USD 15.09 billion across infrastructure services.
- Hitachi Vantara: storage system support.
- Fujitsu: server and storage support in Japan and Europe.
- Huawei: server and storage support, mainly in China.
- Inspur: server support, mainly in China.
Market shares are DC Market Insights estimates; OEM services lines also include PC, software and deployment work, so only the server and storage hardware support part is counted.
Recent Developments in the Managed Server and Storage Hardware Support Services Market
- In June 2026, Evernex acquired Empowered and OrderWork in the United Kingdom, its tenth acquisition since 2019 (Source: Evernex).
- In May 2026, NetApp reported fiscal 2026 support revenue of USD 2.64 billion (Source: NetApp).
- In March 2026, Evernex acquired Comptest, a telecom infrastructure specialist in Poland (Source: Evernex).
- In February 2026, Everpure reported fiscal 2026 subscription services revenue of USD 1.69 billion, up 15.1% (Source: Everpure).
- In January 2026, Park Place Technologies completed its merger with Service Express (Source: Park Place Technologies).
- In October 2025, Supermicro launched Data Center Building Block Solutions with a 4-hour on-site response option (Source: Supermicro).
Research Methodology: How DC Market Insights Sized the Managed Server and Storage Hardware Support Services Market
DC Market Insights built the Managed Server and Storage Hardware Support Services Market bottom-up from installed data center IT load: 68 GW in 2020, 116 GW in 2025, 207 GW in 2030 and 311 GW in 2035, with the AI share rising from 2% in 2020 to 14% in 2025 and 52% in 2035.
Support = conventional IT load × share under paid support (45% in 2025, 40% in 2035) × USD 235,000 per MW-year (USD 175,000 in 2035) + AI IT load × share under paid support (38% in 2025, 32% in 2035) × USD 520,000 per MW-year (USD 380,000 in 2035). Segments, 5 regions and 12 countries are shares of the total that sum to it every year. Read more in our research methodology.
Bound checks: (1) ceiling: the 2025 value of USD 13.76 billion is 86% of the USD 15.97 billion IT Hardware Support and Maintenance line in the DC Market Insights Managed Data Center Services model, which also covers network hardware; (2) ceiling: the conventional rate of USD 235,000 per MW-year is about 2.6% of the roughly USD 9 million of server and storage hardware per installed megawatt; (3) floor: NetApp support (USD 2.64 billion), Everpure subscription services (USD 1.69 billion) and IBM Infrastructure Support (USD 5.10 billion) add up to USD 9.43 billion, below the market before Dell Technologies, Hewlett Packard Enterprise, Lenovo and third-party maintainers are counted.
Table of contents
- 01Introduction
- 1.1Market Definition
- 1.2Scope: Included and Excluded
- 1.3How the Segments Fit Together
- 02Key Market Statistics and Key Takeaways
- 2.1Key Market Statistics
- 2.2Key Takeaways
- 03Executive Summary
- 3.1Market Snapshot, 2025, 2026 and 2035
- 3.2Market Size 2020-2035
- 04Why Estimates Differ
- 4.1Scope Comparison Table
- 4.2Small Buyers in Scope
- 05Market Drivers
- 5.1Server Lives Stretch to 5.5 and 6 Years
- 5.2Memory and Drive Prices Make Repair Cheaper Than Replacement
- 5.3AI Server Fleets Need Hour-Level Response
- 06Market Trends
- 6.1Third-Party Maintainers Consolidate
- 6.2Storage Support Becomes a Subscription
- 07Market Challenges
- 7.1Hyperscalers Repair In-House
- 7.2Legacy Support Revenue Is Flat
- 08Market Opportunities
- 8.1GPU Clouds and Colocation Tenants
- 8.2Remote Monitoring and Proactive Support
- 09Pricing
- 9.1Support Price per Megawatt, 2020-2035
- 9.2Public Price Anchors
- 10Standards and Regulation
- 10.1Commission Regulation (EU) 2019/424
- 10.2Delegated Regulation (EU) 2024/1364
- 10.3Directive (EU) 2024/1799
- 10.4EU Data Centre Rating Scheme
- 11Market Segmentation
- 11.1By Hardware Type: Conventional Servers, AI and GPU Servers, Storage Systems
- 11.2By Provider Type: OEM Support Contracts, Third-Party Maintenance, Integrator and Managed Service Provider Support
- 11.3By Service Type: Break-Fix and On-Site Field Engineering, Parts Logistics and Depot Repair, Remote Monitoring and Proactive Support, Firmware and Lifecycle Extension Services
- 11.4By End User: Enterprises, Colocation and GPU Cloud Providers, Government and Public Sector, Hyperscale Cloud Providers, Telecom Operators
- 12DC Exclusive: The Server Useful-Life Ledger
- 12.1Hyperscaler Server Lives
- 12.2Value of One Extra Year of Support
- 13Regional Insights
- 13.1North America
- 13.2Europe
- 13.3Asia Pacific
- 13.4Latin America
- 13.5Middle East and Africa
- 14Country Analysis
- 14.1United States
- 14.2China
- 14.3Japan
- 14.4Germany
- 14.5United Kingdom
- 14.6France
- 14.7Canada
- 14.8India
- 14.9South Korea
- 14.10Brazil
- 14.11Australia
- 14.12Saudi Arabia
- 15Forecast Scenarios
- 15.1Low Case
- 15.2Base Case
- 15.3High Case
- 16Competitive Insights
- 16.1Dell Technologies
- 16.2Hewlett Packard Enterprise
- 16.3IBM
- 16.4Lenovo
- 16.5Park Place Technologies
- 16.6Evernex
- 16.7NetApp
- 16.8Everpure
- 16.9Supermicro
- 16.10NVIDIA
- 16.11Kyndryl
- 16.12Hitachi Vantara
- 16.13Fujitsu
- 16.14Huawei
- 16.15Inspur
- 17Recent Developments
- 17.12025-2026 Developments
- 18Research Methodology
- 18.1Bottom-Up Model
- 18.2Bound Checks
- Fig. 1Managed Server and Storage Hardware Support Services Market Size, 2020-2035
- Table 1Market Snapshot, 2025, 2026 and 2035
- Table 2Scope Comparison
- Table 3Support Price per Megawatt, 2020-2035
- Table 4Market by Hardware Type
- Table 5Market by Provider Type
- Table 6Market by Service Type
- Table 7Market by End User
- Table 8Hyperscaler Server Useful Lives
- Table 9Value of One Extra Year of Support
- Table 10Top 12 Countries
- Table 11Forecast Scenarios, 2035
About this report
Written by Amit Jain and reviewed by Deepti Agrawal, Senior Editor, Research. Figures are built top-down and bottom-up and reconciled before publication, with 2025 as the base year.
Read our methodologyHow we built this
- Historical period2020-2024
- Base year2025
- Forecast period2026-2035
- Sizing approachTop-down + bottom-up
Need more than the report?
Advisory on this market
Due diligence, site selection and market entry work, by the analysts who wrote this report.
See consulting servicesFrequently asked questions
USD 15.39 billion in 2026, up 11.83% from USD 13.76 billion in 2025, according to DC Market Insights estimates. The market is projected to reach USD 30.11 billion by 2035, a CAGR of 8.15% from 2025.
8.15% a year from 2025 to 2035, after 6.73% a year from 2020 to 2025, as installed data center IT load rises from 116 GW to 311 GW and the AI share of it from 14% to 52% (DC Market Insights estimate).
About USD 235,000 per supported conventional megawatt-year and USD 520,000 per supported AI megawatt-year in 2025 (DC Market Insights estimate), or about 2.6% a year of the hardware value installed per megawatt.
OEM Support Contracts, with USD 10.18 billion or 74.00% of 2025 value. Third-Party Maintenance grows 9.60% a year to USD 7.23 billion by 2035.
AI and GPU Servers, at 19.88% a year from USD 2.89 billion in 2025 to USD 17.70 billion by 2035, while support for Conventional Servers stays near USD 8 billion a year.
Meta moved most servers to a 5.5-year life from January 2025, cutting 2025 depreciation by USD 2.92 billion, and Alphabet uses six years. Each year a server runs past its warranty needs a paid support contract.
North America, with USD 5.78 billion or 42.00% of 2025 value. Asia Pacific grows fastest at 10.21% a year, and India is the fastest large country at 15.70%.
Support of servers and storage by a provider other than the original maker, often after the OEM support window. It was worth USD 2.89 billion in 2025, and Park Place Technologies merged with Service Express in January 2026.
Dell Technologies holds about 22% of 2025 value and the top five providers about 59% (DC Market Insights estimate). Hewlett Packard Enterprise, IBM, Lenovo, Park Place Technologies, Evernex, NetApp and Everpure are also active.
The DC Market Insights figure of USD 15.39 billion for 2026 counts only paid support for data center servers and storage. Estimates that add PC and network support, software maintenance or managed services are larger.
Get this report
How do I get the full report?
Request a quote; we reply by email within one business day.
How and when will I receive the report?
By email, within 24–48 business hours of payment.
How can I pay?
Once you accept the quote, we email you a secure payment link.
Can I see a sample first?
Yes. Request a free sample and we will email it to you.
Can the report be tailored to my needs?
Yes. We can add countries, segments or data cuts. Talk to an analyst about the scope you need.
Can I get an invoice or pay against a purchase order?
Write to sales@dcmarketinsights.com and our team will help.