
Data Center Market Size, Share & Forecast to 2035
Market at a glance
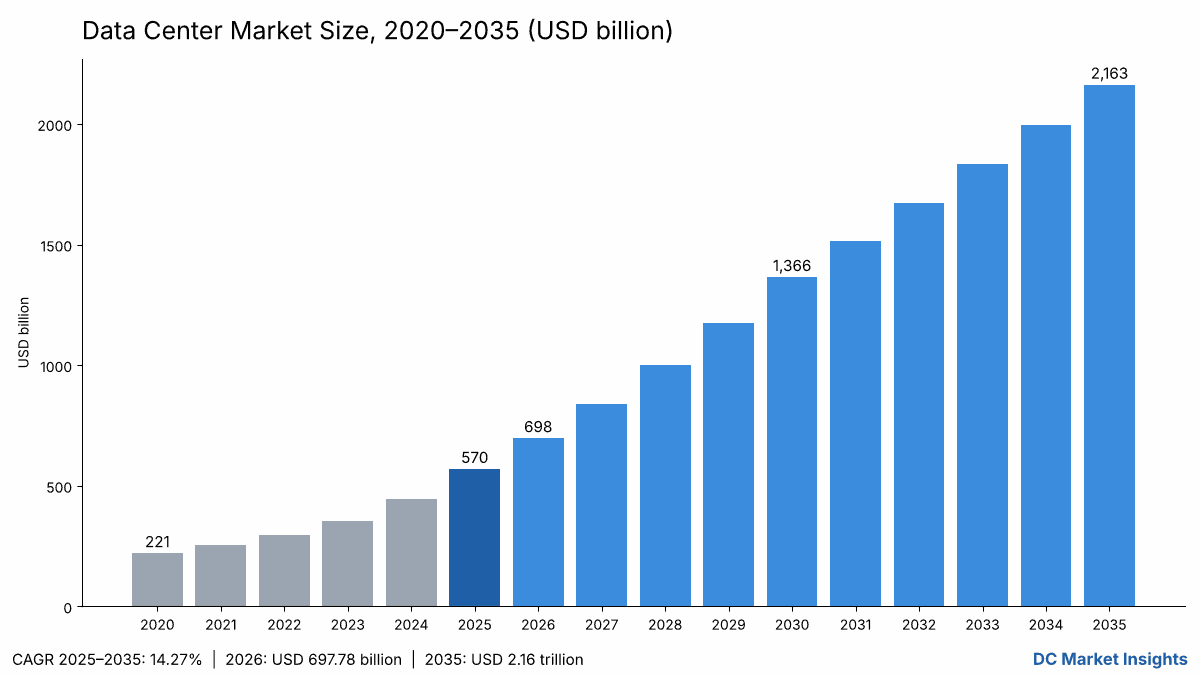
The Data Center market was worth USD 570.04 billion in 2025 and is forecast to reach USD 2,162.99 billion by 2035, growing at a 14.27% CAGR.
 By Amit Jain, Senior Consultant, ICT & Emerging Technologies
 Reviewed by Deepti Agrawal
Last updated 12 Oct 2026
Base year 2025 PDF + Excel
What is inside the report
- 01Introduction
- 02Research Methodology
- 03Executive Summary
- 04Market Scope and Definition: What Does the Data Center Market Include?
- 05Why Data Center Market Estimates Differ
- 06Data Center Market Drivers
- 07Market Trends
- 08Market Challenges
- 09Market Opportunities
- 10Pricing Analysis: Data Center Cost per Megawatt
- 22chapters
- 2020–2024Historical period
- 2026–2035Forecast period
- —Companies profiled
Segmentation
Full analysis
The Data Center Market is valued at USD 697.78 billion in 2026 and is projected to reach USD 2.16 trillion by 2035, up from USD 570.04 billion in 2025, a CAGR of 14.27% from 2025 to 2035 (DC Market Insights estimate). The Data Center Market covers spending on the physical data center: the IT infrastructure installed in data halls (servers, accelerators, storage and data center networking), the power solutions and cooling systems that keep it running, and the general construction of the shell and core. DC Market Insights builds the figure bottom-up: 12.0 GW of new IT capacity in 2025 at a shell-and-core cost of USD 10.7 million per MW, plus USD 35 million of IT fit-out for each new AI megawatt, plus refresh spending on a 104 GW installed base, gives USD 570.04 billion. IT Infrastructure is the fastest-growing component at a 15.12% CAGR because accelerated servers for artificial intelligence (AI) cost about USD 35 million per MW, and the Middle East and Africa is the fastest-growing region at 18.18%, led by sovereign AI campuses in Saudi Arabia and the United Arab Emirates (UAE).
Key Market Statistics: How Big Is the Data Center Market in 2026?
DC Market Insights values the Data Center Market at USD 697.78 billion in 2026, 22.41% above the USD 570.04 billion recorded in 2025.
- Market size 2025: USD 570.04 billion
- Market size 2026: USD 697.78 billion
- Market size 2030: USD 1.37 trillion
- Market size 2035: USD 2.16 trillion (low case USD 1.79 trillion, high case USD 2.33 trillion)
- CAGR 2025–2035: 14.27% (low case 12.12%, high case 15.10%)
- Largest component: IT Infrastructure, USD 430.94 billion in 2025 (75.6% share)
- Fastest-growing data center type: Cloud and Hyperscale, 15.64% CAGR
- Leading region: North America, 45.0% share and USD 256.52 billion in 2025
- Fastest-growing region: Middle East and Africa, 18.18% CAGR
- Largest country: United States, USD 233.72 billion in 2025 (41.0% share)
- Largest buyer group: Cloud and Hyperscale operators, USD 313.52 billion in 2025 (55.0% share)
Executive Summary: How Fast Is Global Data Center Spending Growing?
The Global Data Center Market size was valued at USD 220.83 billion in 2020, reached USD 570.04 billion in 2025, and is anticipated to reach USD 2,162.99 billion by 2035 (USD 2.16 trillion), at a CAGR of 14.27% during the forecast period. Growth from 2020 to 2025 ran at 20.88% a year as AI training clusters arrived on top of cloud migration, and DC Market Insights expects the pace to ease as the installed base grows larger.
| Attribute | Detail |
|---|---|
| Historical period | 2020–2024 |
| Base year | 2025 |
| Forecast period | 2026–2035 |
| Market size 2025 | USD 570.04 billion |
| Market size 2026 | USD 697.78 billion |
| CAGR 2025–2035 | 14.27% |
| Market size 2035 | USD 2.16 trillion |
The growth comes from three numbers that move together. New IT capacity rises from 12.0 GW in 2025 to 22.0 GW in 2030 and 27.0 GW in 2035; the AI share of that new capacity rises from 35% to 66%; and each AI megawatt carries about seven times the IT spend of a conventional one. The International Energy Agency (IEA) expects data centre electricity use to rise from 415 TWh in 2024 to around 945 TWh by 2030, which is consistent with the capacity path in this model.
What Does the Data Center Market Include?
The Data Center Market includes USD 570.04 billion of 2025 spending on four components: IT Infrastructure, Power Solutions, Cooling Systems and General Construction inside purpose-built data centers.
Included
- Servers, AI accelerators, storage arrays and data center switching installed in data halls (IT Infrastructure, USD 430.94 billion)
- Uninterruptible power supply (UPS), switchgear, generators, busway and power distribution (Power Solutions, USD 62.60 billion)
- Chillers, computer room air handlers, liquid cooling and heat rejection (Cooling Systems, USD 27.82 billion)
- Shell, structure, fit-out and site works (General Construction, USD 48.69 billion)
Excluded
- Land purchases, grid and transmission upgrades paid by utilities, and on-site power plants
- Colocation rents, cloud service revenue and managed services (covered in our Data Center Outsourcing Market report)
- Client devices, telecom access networks and enterprise IT kept in offices rather than data centers
Deployment spending, design and consulting services and DC-powered servers
Data center deployment spending is the same USD 570.04 billion measured here: what owners pay in 2025 to build, power, cool and fill new and existing halls. Data center design and consulting services, such as site selection, engineering design and commissioning, are billed inside General Construction (USD 48.69 billion) and are not counted as a separate line. DC-powered servers, which take direct current from the power train and skip one conversion step, sit inside IT Infrastructure, and the DC power distribution behind them sits inside Power Solutions (USD 62.60 billion).
Data center fabric switches from Cisco, Huawei Technologies, Brocade Communications Systems (now part of Broadcom) and Extreme Networks are counted in IT Infrastructure alongside servers from Dell Technologies, Hewlett Packard Enterprise and IBM Corporation. The buyers are cloud service providers, colocation and managed service providers, IT communication and telecom operators, banking financial services firms, governments and healthcare systems, which together make up the USD 570.04 billion of 2025 spending.
How the segments fit together
Every segment table in this report sums to the same USD 570.04 billion in 2025 and USD 2.16 trillion in 2035: by component, by data center type, by end user, by tier standard and by region.
Why Do Data Center Market Estimates Differ?
Estimates differ because publishers count different things: DC Market Insights puts the market at USD 697.78 billion in 2026 for data center infrastructure spending only.
Broader definitions add land and pre-build for sites that energise after 2027, grid connections, on-site generation, and cloud or colocation service revenue, which is a payment for the same assets counted again. Narrower definitions count only colocation and hosting revenue, or only facility equipment such as power and cooling, and land near USD 100–300 billion. Company capital-spending totals also run higher than this market: Alphabet and Meta alone guided 2026 capital expenditures to USD 290–320 billion combined (Alphabet, Meta), and those totals include land, offices, network and finance leases, which this report leaves out.
| Element | In this report | Why |
|---|---|---|
| Servers, accelerators, storage, networking | Yes, USD 430.94 billion (2025) | Installed in the data hall |
| Power and cooling equipment | Yes, USD 90.42 billion (2025) | Part of the facility |
| Shell and core construction | Yes, USD 48.69 billion (2025) | Part of the facility |
| Land and grid connection | No | Not data center equipment |
| Colocation and cloud revenue | No | Service revenue on the same assets |
Out of scope in this report: land banking, transmission upgrades, on-site gas turbines, colocation rent, cloud service revenue, managed hosting and edge devices outside data centers. In scope are all buyer groups that build or fit out data centers: hyperscale cloud operators, colocation providers, banks and other enterprises, governments, healthcare systems, and small and medium-sized enterprises (SMEs) that buy racks of servers into colocation halls.
What Is Driving Data Center Market Growth?
Hyperscale AI investment is the main driver: AI capacity drives USD 184.24 billion of 2025 IT spending, 32.3% of the Data Center Market.
Hyperscaler capital spending guidance for 2026
Meta reported 2025 capital expenditures of USD 72.22 billion and guided 2026 to USD 115–135 billion, according to its January 2026 results release. Alphabet guided 2026 capital expenditures to USD 175–185 billion in its February 2026 results message. Amazon’s purchases of property and equipment reached USD 131.82 billion in 2025, according to its fourth-quarter 2025 release. Microsoft’s additions to property and equipment were USD 115.95 billion in its fiscal year to June 2026, according to its July 2026 release. Amazon, Meta and Microsoft together spent USD 319.99 billion, which sets a floor under the 2025 market.
AI capacity and rack density
The AI share of new IT capacity rises from 35% in 2025 to 60% in 2030 in the DC Market Insights model, and each AI megawatt carries about USD 35 million of IT fit-out against about USD 5 million for conventional halls. The Uptime Institute’s Global Data Center Survey 2026 (July 2026) found the average of typical rack densities passed 11 kW, the highest on record. Higher density makes IT Infrastructure the fastest-growing component, at 15.12% a year.
Capacity doubling by 2030
JLL expects global data center capacity to add 97 GW between 2025 and 2030 and reach 200 GW, a 14% CAGR, according to its 2026 Global Data Center Outlook (January 2026). The same outlook puts shell-and-core cost at USD 10.7 million per MW in 2025 and USD 11.3 million in 2026. At those costs, facility spending comes to USD 139.10 billion in 2025.
Which Trends Are Reshaping the Data Center Market?
Three trends move USD 1.59 trillion of new spending into the market between 2025 and 2035: gigawatt campuses, liquid cooling and new ownership models.
Gigawatt-scale AI campuses
In January 2026, OpenAI and SoftBank invested USD 1 billion in SB Energy, which will build and operate the 1.2 GW Stargate site in Milam County, Texas, according to OpenAI. Sites of 1 GW or more concentrate General Construction and Power Solutions spending, which grow 9.85% and 11.19% a year respectively.
Liquid cooling moves into the base design
Cooling Systems grow at 13.24% a year, faster than Power Solutions at 11.19%, because the cooling share of facility spend rises from 20% in 2025 to 24% in 2035 in the DC Market Insights model. Vertiv reported 2025 net sales of USD 10.23 billion and a backlog of USD 15.0 billion, up 109%, according to its February 2026 results. Our Data Center Thermal Management Market report covers this segment in detail.
Infrastructure funds buy platforms
In July 2026, AIP, MGX and BlackRock’s Global Infrastructure Partners (GIP) closed the acquisition of Aligned Data Centers, covering more than 6.4 GW across 51 campuses, according to Aligned. Fund-owned platforms add colocation capacity, which DC Market Insights values at USD 142.51 billion of 2025 spending.
What Holds Back the Data Center Market?
Power availability and construction cost are the two main limits, and together they cut the 2035 market by USD 372.83 billion in the low case.
Grid access and electricity
Data centres used 415 TWh of electricity in 2024, about 1.5% of the world total, according to the IEA. In North America, primary-market vacancy held at 1.4% in the first half of 2026 while a record 7,481 MW was under construction, according to CBRE (September 2026). Delayed energisation pushes spending into later years; the low case assumes the AI share of new capacity reaches only 50% by 2035.
Rising cost per megawatt
Shell-and-core cost rose from USD 7.7 million per MW in 2020 to USD 10.7 million in 2025, a 39% increase, according to JLL. DC Market Insights carries a 3% yearly increase after 2026, reaching USD 14.74 million per MW in 2035, which lifts the market value but also raises the hurdle for enterprise projects, where spending grows only 8.58% a year.
Where Are the Biggest Data Center Market Opportunities?
The two largest opportunities are AI IT refresh, worth USD 703.92 billion a year at the end of the forecast, and sovereign AI capacity in the Middle East, Africa and India.
Refresh of the AI installed base
Refresh of installed AI systems is the largest new spending line: DC Market Insights puts it at USD 37.24 billion in 2025 and USD 703.92 billion at the end of the forecast, as accelerator fleets bought from 2023 onwards reach replacement at about 20% a year. Server makers and integrators gain the most, since refresh needs no new building.
Sovereign and emerging-region capacity
Middle East and Africa spending rises 18.18% a year from a USD 28.50 billion base, and India spending rises 21.18% a year from a USD 14.25 billion base. Saudi Arabia grows at 20.25% a year, to USD 43.26 billion at the end of the forecast. Our Asia Pacific AI Data Center Market report gives the AI facility view for India and the rest of the region.
How Much Does a Data Center Cost per Megawatt?
A conventional data center costs about USD 10.7 million per MW for shell and core in 2025, and an AI data center about USD 45.7 million per MW once USD 35 million of IT fit-out is added.
| Cost item (USD million per MW) | 2020 | 2025 | 2030 | 2035 |
|---|---|---|---|---|
| Shell and core (facility) | 7.70 | 10.70 | 12.72 | 14.74 |
| AI IT fit-out | 35.00 | 35.00 | 32.50 | 30.00 |
| AI data center, all-in | 42.70 | 45.70 | 45.22 | 44.74 |
| Conventional IT spend per installed MW per year | 2.50 | 2.50 | 2.65 | 2.80 |
Public price anchors confirm the range. CBRE’s Global Data Center Trends 2026 (June 2026) put colocation asking rents at USD 190–235 per kW per month in Northern Virginia and USD 235–265 in Frankfurt, while Singapore averaged USD 403. At USD 210 per kW per month, a 1 MW hall earns about USD 2.52 million a year in rent, which repays a USD 10.7 million shell in roughly four years before operating costs.
Which Rules and Standards Shape the Data Center Market?
Efficiency reporting is now law in the European Union (EU), and the industry average power usage effectiveness (PUE) of 1.52 in 2026 is the baseline those rules measure against.
- EU Delegated Regulation (EU) 2024/1364 of 14 March 2024 sets up the EU data centre reporting scheme under the Energy Efficiency Directive (EUR-Lex).
- EU data centre rating scheme, C(2026) 3472, adopted on 21 September 2026, amends 2024/1364 and requires an electronic label by 15 August 2027 and every year after (European Commission).
- Singapore Green Data Centre Roadmap (May 2024) aims to provide at least 300 MW of additional capacity in the near term for efficient operators (Infocomm Media Development Authority (IMDA)).
- Uptime Institute Tier Standard: Tier III facilities take USD 376.23 billion of 2025 spending and Tier IV USD 114.01 billion.
- Power usage effectiveness: the 2026 industry average is 1.52 (Uptime Institute).
Which Segment Leads the Data Center Market?
IT Infrastructure leads the Data Center Market with USD 430.94 billion in 2025, a 75.6% share, and grows fastest at 15.12% a year.
By Component
| Component | 2025 (USD million) | Share 2025 | 2035 (USD million) | CAGR |
|---|---|---|---|---|
| IT Infrastructure | 430,940.00 | 75.6% | 1,761,224.00 | 15.12% |
| Power Solutions | 62,595.00 | 11.0% | 180,795.85 | 11.19% |
| Cooling Systems | 27,820.00 | 4.9% | 96,424.45 | 13.24% |
| General Construction | 48,685.00 | 8.5% | 124,548.25 | 9.85% |
By Data Center Type
| Type | 2025 (USD million) | Share 2025 | 2035 (USD million) | CAGR |
|---|---|---|---|---|
| Cloud and Hyperscale | 313,522.00 | 55.0% | 1,341,055.38 | 15.64% |
| Colocation | 142,510.00 | 25.0% | 562,378.06 | 14.71% |
| Enterprise | 114,008.00 | 20.0% | 259,559.11 | 8.58% |
By End User
| End user | 2025 (USD million) | Share 2025 | 2035 (USD million) | CAGR |
|---|---|---|---|---|
| IT and Telecom | 353,424.80 | 62.0% | 1,470,834.93 | 15.33% |
| Banking, Financial Services and Insurance (BFSI) | 68,404.80 | 12.0% | 216,299.26 | 12.20% |
| Government | 51,303.60 | 9.0% | 173,039.40 | 12.93% |
| Healthcare | 28,502.00 | 5.0% | 108,149.63 | 14.27% |
| Others | 68,404.80 | 12.0% | 194,669.33 | 11.03% |
By Tier Standard
| Tier | 2025 (USD million) | Share 2025 | 2035 (USD million) | CAGR |
|---|---|---|---|---|
| Tier I and II | 79,805.60 | 14.0% | 173,039.40 | 8.05% |
| Tier III | 376,226.40 | 66.0% | 1,384,315.23 | 13.91% |
| Tier IV | 114,008.00 | 20.0% | 605,637.91 | 18.18% |
DC Exclusive: The AI Build-Out Spend Matrix — Where Does the Money Land?
The AI Build-Out Spend Matrix is a DC Market Insights model built from 40 inputs (12 cost and capacity inputs, 11 segment shares, 5 regional shares and 12 country shares), and it shows that North America’s IT Infrastructure alone takes USD 193.92 billion, 34.0% of the 2025 Data Center Market.
| Region (2025, USD million) | IT Infrastructure | Power Solutions | Cooling Systems | General Construction |
|---|---|---|---|---|
| North America | 193,923.00 | 28,167.75 | 12,519.00 | 21,908.25 |
| Europe | 73,259.80 | 10,641.15 | 4,729.40 | 8,276.45 |
| Asia Pacific | 129,282.00 | 18,778.50 | 8,346.00 | 14,605.50 |
| Latin America | 12,928.20 | 1,877.85 | 834.60 | 1,460.55 |
| Middle East and Africa | 21,547.00 | 3,129.75 | 1,391.00 | 2,434.25 |
Analyst takeaways:
- Every USD 1 of facility spending in 2025 pulled in USD 3.10 of IT spending; by 2035 the ratio rises to USD 4.38.
- AI refresh, not new buildings, becomes the largest single spending line after 2032 in the DC Market Insights model.
- Enterprise data centers fall from 20.0% to 12.0% of spending by 2035 as workloads move to cloud and colocation.
- Cooling Systems take 20.0% of facility spending in 2025 and 24.0% in 2035, the only facility line that gains share.
- North America, Asia Pacific and Europe hold 92.0% of 2025 spending; the Middle East and Africa and Latin America double their combined share from 8.0% to 11.0% by 2035.
Which Region Leads the Data Center Market?
North America leads with USD 256.52 billion in 2025, a 45.0% share, and the fastest-growing region is the Middle East and Africa at an 18.18% CAGR from 2025 to 2035, because Gulf sovereign funds are financing AI campuses from a small installed base.
| Region | 2025 (USD million) | Share 2025 | 2035 (USD million) | CAGR |
|---|---|---|---|---|
| North America | 256,518.00 | 45.0% | 930,086.80 | 13.75% |
| Europe | 96,906.80 | 17.0% | 302,818.96 | 12.07% |
| Asia Pacific | 171,012.00 | 30.0% | 692,157.62 | 15.01% |
| Latin America | 17,101.20 | 3.0% | 86,519.70 | 17.60% |
| Middle East and Africa | 28,502.00 | 5.0% | 151,409.48 | 18.18% |
North America
North American spending of USD 256.52 billion in 2025 rests on hyperscale campuses; CBRE counted a record 7,481 MW under construction in primary markets in the first half of 2026, with vacancy at 1.4% and Northern Virginia at 0.2% (CBRE). Our U.S. AI Data Center Market report gives the US AI view.
Europe
European data center spending rises 12.07% a year from a USD 96.91 billion base, the slowest regional rate, as grid limits and the EU rating scheme adopted in September 2026 shape new builds; CBRE put European vacancy at 7.3% in early 2026 (CBRE).
Asia Pacific
Asia Pacific spending rises 15.01% a year, with India the fastest large market at 21.18%; Singapore has the region’s highest rents at USD 403 per kW per month (CBRE).
Latin America
Latin American spending rises 17.60% a year from a USD 17.10 billion base, led by Brazil at USD 7.41 billion, as cloud regions in São Paulo and Querétaro add capacity.
Middle East and Africa
Middle East and Africa spending rises fastest, at 18.18% a year; Abu Dhabi’s MGX is a co-owner of the 6.4 GW Aligned platform acquired in July 2026 (Aligned), showing Gulf capital moving into data center ownership.
Which Countries Spend the Most on Data Centers?
The United States spends the most, USD 233.72 billion in 2025 or 41.0% of the Data Center Market, and India grows fastest among large countries at 21.18% a year.
China is the second-largest country at USD 74.11 billion in 2025, rising 13.82% a year, followed by Japan at USD 22.80 billion (12.75%), Germany at USD 19.95 billion (12.52%) and the United Kingdom at USD 19.95 billion (11.74%). Canada spends USD 17.10 billion and grows 16.04% a year, and France spends USD 11.40 billion, rising 12.42% a year. Mexico, outside the top 12, takes about USD 2.91 billion in 2025, a DC Market Insights allocation of 17% of Latin American spending, led by cloud regions in Querétaro.
| Rank | Country | Region | 2025 (USD million) | 2035 (USD million) | CAGR |
|---|---|---|---|---|---|
| 1 | United States | North America | 233,716.40 | 832,752.13 | 13.55% |
| 2 | China | Asia Pacific | 74,105.20 | 270,374.07 | 13.82% |
| 3 | Japan | Asia Pacific | 22,801.60 | 75,704.74 | 12.75% |
| 4 | Germany | Europe | 19,951.40 | 64,889.78 | 12.52% |
| 5 | United Kingdom | Europe | 19,951.40 | 60,563.79 | 11.74% |
| 6 | Canada | North America | 17,101.20 | 75,704.74 | 16.04% |
| 7 | India | Asia Pacific | 14,251.00 | 97,334.66 | 21.18% |
| 8 | Australia | Asia Pacific | 11,400.80 | 43,259.85 | 14.27% |
| 9 | France | Europe | 11,400.80 | 36,770.87 | 12.42% |
| 10 | Singapore | Asia Pacific | 8,550.60 | 25,955.91 | 11.74% |
| 11 | Brazil | Latin America | 7,410.52 | 36,770.87 | 17.37% |
| 12 | Saudi Arabia | Middle East and Africa | 6,840.48 | 43,259.85 | 20.25% |
What Could the Data Center Market Be Worth in 2035 Under Different Scenarios?
The Data Center Market reaches USD 2.16 trillion in 2035 in the base case, within a range of USD 1.79 trillion to USD 2.33 trillion.
| Scenario | 2035 (USD million) | CAGR 2025–2035 | Key assumption |
|---|---|---|---|
| Low | 1,790,162.55 | 12.12% | AI share of new capacity 50% by 2035; AI IT cost falls to USD 25 million per MW |
| Base | 2,162,992.55 | 14.27% | AI share 66% by 2035; AI IT cost USD 30 million per MW |
| High | 2,325,522.55 | 15.10% | AI share 72% by 2035; AI IT cost holds near USD 33 million per MW |
Who Are the Leading Companies in the Data Center Market?
The top five cloud buyers (Amazon Web Services, Microsoft, Alphabet, Meta and Oracle) direct about 55% of 2025 spending, which DC Market Insights bases on the USD 313.52 billion Cloud and Hyperscale segment.
- Amazon Web Services (AWS)
- Microsoft
- Alphabet (Google)
- Meta
- Oracle
- Equinix
- Digital Realty
- NTT DATA
- Aligned Data Centers
- Vertiv
- Schneider Electric
- Eaton
- NVIDIA
- Dell Technologies
- Hewlett Packard Enterprise (HPE)
- Cisco
- Super Micro Computer
Equinix reported 2025 revenue of USD 9.217 billion, up 5%, and guided 2026 to USD 10.123–10.223 billion (Equinix). Digital Realty reported 2025 total operating revenues of USD 6.11 billion (Digital Realty). Oracle ended its fiscal year in May 2026 with remaining performance obligations of USD 638 billion, up 363% (Oracle), a backlog that turns into data center orders over the next five years. Among equipment suppliers, Vertiv’s USD 10.23 billion of 2025 sales equal 11.3% of the USD 90.42 billion Power Solutions and Cooling Systems total.
What Has Changed in the Data Center Market in 2026?
Six dated events in 2026 point to USD 1 trillion-plus annual spending by the end of the decade.
- In January 2026, OpenAI and SoftBank invested USD 1 billion in SB Energy to build the 1.2 GW Stargate site in Milam County, Texas (Source: OpenAI).
- In January 2026, Meta guided 2026 capital expenditures to USD 115–135 billion (Source: Meta).
- In February 2026, Alphabet guided 2026 capital expenditures to USD 175–185 billion (Source: Alphabet).
- In July 2026, AIP, MGX and GIP closed the acquisition of Aligned Data Centers, more than 6.4 GW across 51 campuses (Source: Aligned).
- In September 2026, CBRE reported a record 7,481 MW under construction in North American primary markets (Source: CBRE).
- In September 2026, the European Commission adopted the EU data centre rating scheme, C(2026) 3472 (Source: European Commission).
More data center reports are listed under DC Market Insights industries; for the largest campuses see our Mega Data Center Market report.
Methodology: How the Model Sizes the Data Center Market at USD 570.04 Billion
DC Market Insights built the model from 40 inputs across 16 years (2020–2035), 5 regions and 12 countries, and checked it against three public bounds.
The 2025 receipt: facility spending of USD 139.10 billion (USD 10.7 million per MW × the average of 12.0 GW new in 2025 and 13.9 GW in 2026), plus AI IT fit-out of USD 147.00 billion (4.2 GW × USD 35 million per MW), plus AI refresh of USD 37.24 billion (20% of a 5.3 GW installed AI base), plus conventional IT of USD 246.70 billion (98.7 GW × USD 2.5 million per MW per year), gives USD 570.04 billion. Installed IT capacity grows from 116 GW at the end of 2025 to 331 GW by 2035 before retirements, or about 311 GW after them.
- Ceiling 1: the IEA put data centre investment at about USD 0.5 trillion in 2024; the model gives USD 446.29 billion for 2024 on a narrower scope.
- Ceiling 2: Dell’Oro Group expects data center capex above USD 1 trillion in 2026, including land and pre-build; the model gives USD 697.78 billion.
- Floor: Amazon, Meta and Microsoft alone reported USD 319.99 billion of property and equipment spending in their latest fiscal years; the model’s USD 570.04 billion sits above it.
Every segment, region and country table sums to the total in every year. The full approach is described on our research methodology page.
Table of contents
- 01Introduction
- 1.1Market Definition
- 1.2Historical Period, Base Year and Forecast Period
- 1.3Report Attributes
- 02Research Methodology
- 2.1Build Receipt: Facility Spend, AI IT Fit-Out, AI Refresh and Conventional IT
- 2.2Installed IT Capacity, 2025-2035
- 2.3Bound Checks: Two Ceilings and a Floor
- 2.4Segment, Region and Country Reconciliation
- 03Executive Summary
- 3.1Market Snapshot, 2025, 2026 and 2035
- 3.2Key Market Statistics
- 3.3New IT Capacity, AI Share and IT Spend per MW
- 04Market Scope and Definition: What Does the Data Center Market Include?
- 4.1Included: IT Infrastructure, Power Solutions, Cooling Systems and General Construction
- 4.2Excluded: Land, Grid Upgrades, Colocation Rents, Cloud Service Revenue and Client Devices
- 4.3Deployment Spending, Design and Consulting Services and DC-Powered Servers
- 4.4How the Segments Fit Together
- 05Why Data Center Market Estimates Differ
- 5.1Broader and Narrower Definitions
- 5.2Hyperscaler Capital Spending vs Market Scope
- 5.3Scope Comparison: What Is In and Out
- 06Data Center Market Drivers
- 6.1Hyperscaler Capital Spending Guidance for 2026
- 6.2AI Capacity and Rack Density
- 6.3Capacity Doubling by 2030
- 07Market Trends
- 7.1Gigawatt-Scale AI Campuses
- 7.2Liquid Cooling Moves into the Base Design
- 7.3Infrastructure Funds Buy Platforms
- 08Market Challenges
- 8.1Grid Access and Electricity
- 8.2Rising Cost per Megawatt
- 09Market Opportunities
- 9.1Refresh of the AI Installed Base
- 9.2Sovereign and Emerging-Region Capacity
- 10Pricing Analysis: Data Center Cost per Megawatt
- 10.1Shell and Core (Facility) Cost per MW
- 10.2AI IT Fit-Out per MW
- 10.3AI Data Center, All-In Cost per MW
- 10.4Conventional IT Spend per Installed MW
- 10.5Colocation Rent Anchors
- 11Standards, Policy and Regulation
- 11.1EU Delegated Regulation (EU) 2024/1364
- 11.2EU Data Centre Rating Scheme, C(2026) 3472
- 11.3Singapore Green Data Centre Roadmap
- 11.4Uptime Institute Tier Standard
- 11.5Power Usage Effectiveness (PUE)
- 12Data Center Market, By Component
- 12.1IT Infrastructure
- 12.2Power Solutions
- 12.3Cooling Systems
- 12.4General Construction
- 13Data Center Market, By Data Center Type
- 13.1Cloud and Hyperscale
- 13.2Colocation
- 13.3Enterprise
- 14Data Center Market, By End User
- 14.1IT and Telecom
- 14.2Banking, Financial Services and Insurance (BFSI)
- 14.3Government
- 14.4Healthcare
- 14.5Others
- 15Data Center Market, By Tier Standard
- 15.1Tier I and II
- 15.2Tier III
- 15.3Tier IV
- 16DC Exclusive: The AI Build-Out Spend Matrix
- 16.1Region × Component Spend Matrix, 2025
- 16.2Analyst Takeaways
- 17Data Center Market, By Region
- 17.1North America
- 17.2Europe
- 17.3Asia Pacific
- 17.4Latin America
- 17.5Middle East and Africa
- 18Country Analysis
- 18.1United States
- 18.2China
- 18.3Japan
- 18.4Germany
- 18.5United Kingdom
- 18.6Canada
- 18.7India
- 18.8Australia
- 18.9France
- 18.10Singapore
- 18.11Brazil
- 18.12Saudi Arabia
- 18.13Mexico
- 19Forecast Scenarios, 2035
- 19.1Low Scenario
- 19.2Base Scenario
- 19.3High Scenario
- 20Competitive Landscape
- 20.1Market Concentration: Top Five Cloud Buyers
- 20.2Company Results: Equinix, Digital Realty, Oracle and Vertiv
- 21Company Profiles
- 21.1Amazon Web Services (AWS)
- 21.2Microsoft
- 21.3Alphabet (Google)
- 21.4Meta
- 21.5Oracle
- 21.6Equinix
- 21.7Digital Realty
- 21.8NTT DATA
- 21.9Aligned Data Centers
- 21.10Vertiv
- 21.11Schneider Electric
- 21.12Eaton
- 21.13NVIDIA
- 21.14Dell Technologies
- 21.15Hewlett Packard Enterprise (HPE)
- 21.16Cisco
- 21.17Super Micro Computer
- 22Recent Developments
- 22.1OpenAI and SoftBank Invest in SB Energy for Stargate Milam County (January 2026)
- 22.2Meta 2026 Capital Expenditure Guidance (January 2026)
- 22.3Alphabet 2026 Capital Expenditure Guidance (February 2026)
- 22.4AIP, MGX and GIP Close Aligned Data Centers Acquisition (July 2026)
- 22.5Record 7,481 MW Under Construction in North America (September 2026)
- 22.6EU Data Centre Rating Scheme Adopted (September 2026)
- Fig. 1Data Center Market Size, 2020–2035 (USD Billion)
- Table 1Market Snapshot
- Table 2Scope Comparison
- Table 3Cost per MW, 2020–2035
- Table 4Market by Component
- Table 5Market by Data Center Type
- Table 6Market by End User
- Table 7Market by Tier Standard
- Table 8AI Build-Out Spend Matrix
- Table 9Market by Region
- Table 10Top 12 Countries
- Table 11Forecast Scenarios
About this report
Written by Amit Jain and reviewed by Deepti Agrawal, Senior Editor, Research. Figures are built top-down and bottom-up and reconciled before publication, with 2025 as the base year.
Read our methodologyHow we built this
- Historical period2020–2024
- Base year2025
- Forecast period2026–2035
- Sizing approachTop-down + bottom-up
Need more than the report?
Advisory on this market
Due diligence, site selection and market entry work, by the analysts who wrote this report.
See consulting servicesFrequently asked questions
USD 697.78 billion in 2026, up 22.41% from USD 570.04 billion in 2025, according to DC Market Insights estimates. The market is projected to reach USD 2.16 trillion by 2035, a CAGR of 14.27% from 2025 to 2035.
14.27% a year from 2025 to 2035 in the base case, within a 12.12% to 15.10% range. Growth comes from new IT capacity rising from 12.0 GW in 2025 to 27.0 GW in 2035 and the AI share of that capacity rising from 35% to 66%.
USD 570.04 billion of 2025 spending on IT Infrastructure, Power Solutions, Cooling Systems and General Construction inside data centers. It excludes land, grid connections and cloud or colocation service revenue, which are paid for the same assets.
IT Infrastructure, with USD 430.94 billion in 2025, a 75.6% share. It is also the fastest-growing component at 15.12% a year, because AI halls need about USD 35 million of servers, storage and networking per MW.
About USD 10.7 million per MW for shell and core in 2025 and USD 11.3 million in 2026, according to JLL. An AI data center costs about USD 45.7 million per MW once USD 35 million of IT fit-out is added.
North America, with USD 256.52 billion in 2025 and a 45.0% share. The Middle East and Africa grows fastest at 18.18% a year, reaching USD 151.41 billion by 2035 as Gulf sovereign funds back AI campuses.
The United States, with USD 233.72 billion in 2025, 41.0% of the market. India grows fastest among large countries at 21.18% a year, from USD 14.25 billion in 2025 to USD 97.33 billion by 2035.
About 55% of 2025 spending, USD 313.52 billion, comes from cloud and hyperscale buyers led by Amazon Web Services, Microsoft, Alphabet, Meta and Oracle. Equinix (USD 9.217 billion 2025 revenue), Digital Realty, Vertiv, Schneider Electric and NVIDIA lead among operators and suppliers.
Because scopes differ: DC Market Insights counts USD 697.78 billion of 2026 infrastructure spending only. Capex views that add land, pre-build and leases exceed USD 1 trillion, while colocation-only or facility-only views land near USD 100–300 billion.
A record 7,481 MW was under construction in North America’s primary markets in the first half of 2026, according to CBRE, with vacancy at 1.4%. DC Market Insights values North American spending at USD 256.52 billion in 2025.
Licences, delivery and payment
Which licence should I choose?
Single User is a view-only PDF for one person. Multi User adds a printable PDF and the Excel data for unlimited users at one location. Enterprise covers your whole company and includes 100 free analyst hours.
How and when will I receive the report?
By email, within 24–48 business hours of payment, in the formats of your licence.
How can I pay?
Securely through PayPal: with a PayPal account, a debit or credit card, or PayPal Pay Later where available. Prices are in US dollars.
Can I see a sample first?
Yes. Request a free sample and we will email it to you.
Can the report be tailored to my needs?
Yes. We can add countries, segments or data cuts. Talk to an analyst about the scope you need.
Can I get an invoice or pay against a purchase order?
Write to sales@dcmarketinsights.com and our team will help.